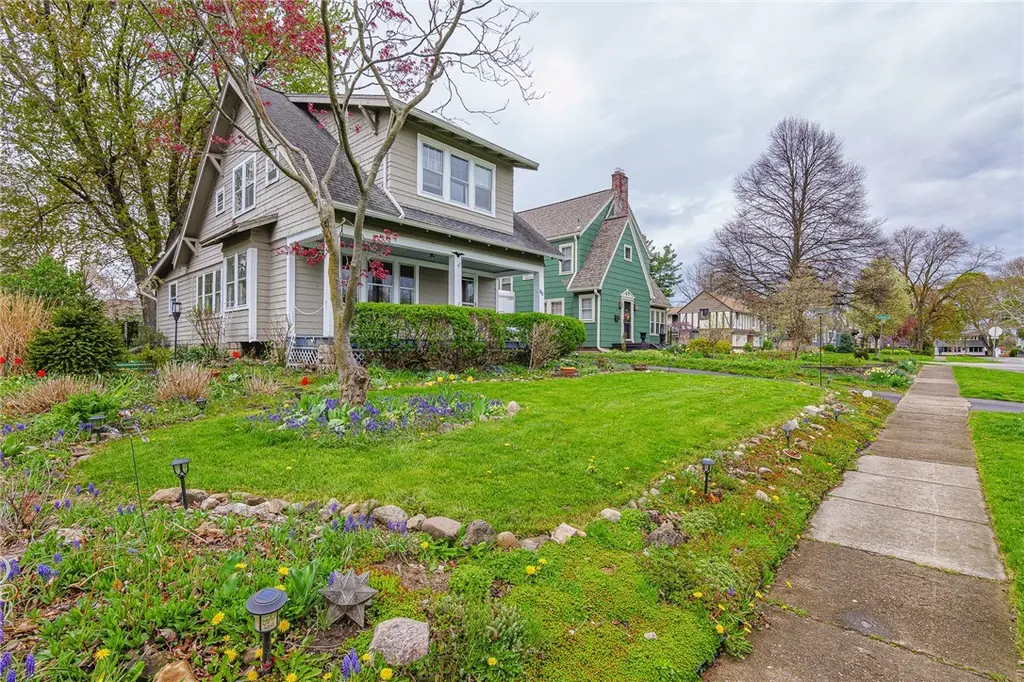
65 Bradford Rd · Brighton, NY
Flood risk 1/10 · Minimal
- FEMA flood zone
- X (unshaded)
- Chance of flooding over 30 yrs
- 0.0%
- Est. flood insurance / yr
- $473 – $860
Fire risk 1/10 · Minimal
- Est. fire insurance / yr
- $691 – $1,283
Heat risk 2/10 · Minimal
- Hot days now (above 95°F)
- 7 days/yr
- Hot days in 30 yrs
- 15 days/yr
Wind risk 1/10 · Minimal
- Chance of severe wind over 30 yrs
- —
Air-quality risk 2/10 · Minimal
- Unhealthy air days now
- 1 days/yr
- Unhealthy air days in 30 yrs
- 1 days/yr
Risk factors via First Street. Map © Google.
Why this score? — see what drove the C grade
The composite is a weighted blend of 9 inputs, each scored 0–100. Each bar is that input's sub-score; the figure is the points it added to the 100-point composite (weight × sub-score).
- Cash flow +16.8/30.0
- ARV discount +15.0/15.0
- Schools +6.1/10.0
- 1% rule +5.8/10.0
- DSCR +5.2/10.0
- Livability +4.0/5.0
- Rent growth +2.5/5.0
- Condition / age +2.5/5.0
- Appreciation +0.0/10.0
$289,000
🖨 Deal sheet (PDF) 📄 Offer letter ✓ Due diligence
Listing remarks
Character filled Brighton Bungalow - Located in one of Brighton's most popular and convenient neighborhoods! Hardwoods - Living Room - Dining Room and carpeted Family Room that could be converted to a 1st floor bedroom or in-law because there is a full bath! Renovated kitchen in '23. Eat-in area and 1st floor laundry that leads to large rear deck. Second floor has 3 bedrooms and another full bath! This 1920 Classic is ready for a new chapter! This Arts & Crafts style boasts the large covered front porch - wonderful gardens surround the home - There is a 2 car detached garage and a shed - Check out the Matterport Virtual Tour Open House Saturday 5/9 - 11 to 12:30
Key facts
- 8,712 sq ft lot
- 2 garage spots
- Built 1920
Property features AI
Exterior
- Parking: Detached garage with garage door opener; Two garage spaces
- Utilities: Electricity connected with circuit breakers; High-speed internet available; Public water connected; Sewer connected; Gas water heater
- Home design: Two-story; Existing construction; Rectangular residential lot; City street frontage; Lot dimensions approximately 60 x 150
- Construction: Wood siding; Copper plumbing; Asphalt roof; Block foundation; Resale condition
- Exterior features: Blacktop driveway; Deck (open); Porch; Partial fencing; Shed(s) and storage
Interior
- Kitchen: Gas oven; Gas range; Microwave; Refrigerator; Dishwasher; Disposal
- Bedrooms: Convertible bedroom (room count includes bedrooms)
- Flooring: Carpet; Hardwood; Tile; Varied flooring
- Bathrooms: Two full bathrooms; One main-level bathroom
- Heating & cooling: Gas heating; Radiator/steam heating
- Interior features: Separate/formal dining room; Separate/formal living room; Pantry; Natural woodwork; Window treatments; Drapes; Convertible bedroom; Programmable thermostat; Full basement
- Laundry & utility: Washer; Dryer; Main-level laundry
Neighborhood map
What this means for you Summary
Snapshot
- This is a 3-bed/2.0-bath single-family listed at $289k.
Deal economics
- At list price, monthly cash flow is $183 ($2k/yr) — positive.
- The deal already cash-flows at list — no discount required.
- Meets the 1% rule at list price ($3k rent vs $289k).
- Recommended offer: $285k (1.5% below list) — sets the bar for market timing.
- Cap rate 7.1% vs local median 3.9% in Brighton — top-decile yield for the area; either an underpriced asset or a hidden risk that comps aren't pricing in. Stress-test before assuming the spread holds.
Location & tenants
- Location reads 81/100 on livability (#89 in NY, #1,379 nationally) — a professional / high-income tenant draw. Strengths: housing A+, health & safety A+, employment B+; Watch: crime D+, amenities D-.
- Brighton Central School District (suburban): math 64% / reading 74% proficiency, ranked #142 of 590 in NY (top 24%) — acceptable for families but not a draw, mixed tenant base, ~2y average lease; only 10% free/reduced lunch — higher-income household profile.
- Zoned schools: French Road Elementary School (math 62% / reading 74%, grade B+, #522 of 2,108 statewide, top 25%, 711 students, 23% FRL); Twelve Corners Middle School (math 50% / reading 71%, grade B+, #153 of 729 statewide, top 21%, 781 students, 25% FRL); Brighton High School (math 100% / reading 92%, grade A+, #71 of 1,100 statewide, top 7%, 1,243 students, 23% FRL).
- Market conditions: 116 active listings in the ZIP; 3 comparable units currently listed for rent nearby; rentals lingering (median 46d on market — plan ~5-8 weeks vacancy on turnover, expect pricing pressure); 67% of comp listings sitting > 30 days — soft ceiling on asking rent; high-income renter base; 1,169 units permitted in Monroe County in 2024 (591 in 5+ unit buildings).
- This rent runs 30% of the median local income ($125k/yr) — at the standard rent-burdened threshold; future hikes will face affordability resistance.
Forward outlook
- Local home prices are declining (-3.0%/yr); year-one equity from $2k of loan paydown is wiped out by about $9k of value loss. Plan a longer hold.
- Monroe County population projected to shrink 6% by 2050 — rents likely to lag national; underwrite the cash flow, not the appreciation.
Negotiation context
- It's been on market 20 days — a 2% lower offer ($285k) is reasonable based on typical stale-listing flexibility.
Risks & watch-outs
- Watch-outs: property tax is 2.7% of price; built in 1920 — expect roof / HVAC / electrical / plumbing capex.
Questions for the listing agent
- Built in 1920 — when were the roof, HVAC, electrical panel, plumbing, and water heater last replaced?
- Property tax is high relative to price — has the assessment been appealed recently, and will the sale trigger a re-assessment?
- Is there a deadline driving the sale (1031 exchange, divorce, estate, relocation)? That informs how much negotiation room exists.
- Schools are B-rated — typically a magnet for longer-tenancy family renters. What's the average tenant stay here, and is there a school-zone premium baked into asking?
- Crime grade is D in this area — have there been break-ins, vandalism, or insurance claims at this property in the last 3 years? What carrier currently insures it and at what premium?
- What's the average days-on-market for RENTAL listings here right now (not sales)? A rising rental-DOM trend means longer vacancies and softer asking-rent achievability than the comps imply.
- What's the recent tenant-quality profile in this submarket — average credit score on applications, eviction rate, late-payment / NSF rate, and stable-employment percentage? A property-management company in the area should have these aggregated.
- How much new for-sale + rental construction is in the pipeline within 1–3 miles? Heavy new supply typically softens prices + rents 12–24 months out; constrained supply supports both.
Investment metrics
- 1% rule
- 1.08% ✓
- Cap rate
- 7.05%
- Cash-on-cash
- 2.71%
- DSCR
- 1.12
- GRM
- 7.7
CMA / ARV
- ARV (median comp)
- $427,007
- List price
- $289,000
- Delta
- -32.32%
- Verdict
- UNDERPRICED
- Comps
- 20 within 1.0 mi
Show comp detail 12 sales within ~0.75 mi
| Address | Dist | Beds/Ba | Sqft | Sold | Price | $/sf | Match |
|---|---|---|---|---|---|---|---|
| 166 Orchard Dr | 0.35mi | 3/2.5 | 1,643 (-5%) | 3mo | $425,000 | $259 | 71 |
| 122 Avalon Dr | 0.61mi | 3/1.5 | 1,731 (+0%) | 2mo | $485,000 | $280 | 68 |
| 70 Penarrow Road Rd | 0.65mi | 3/2.0 | 1,732 (+0%) | 2mo | $420,000 | $242 | 68 |
| 312 Troy Rd | 0.14mi | 4/2.0 (+1) | 1,553 (-10%) | 7mo | $365,000 | $235 | 66 |
| 15 Lynnwood Dr | 0.33mi | 3/2.0 | 1,548 (-10%) | 4mo | $340,000 | $220 | 64 |
| 296 Troy Rd | 0.15mi | 4/3.0 (+1) | 1,936 (+12%) | 1mo | $532,675 | $275 | 63 |
| 1330 Winton Rd S | 0.43mi | 3/1.5 | 1,606 (-7%) | 5mo | $320,000 | $199 | 62 |
| 174 Orchard Dr | 0.36mi | 3/2.0 | 1,550 (-10%) | 7mo | $450,000 | $290 | 60 |
| 2055 Westfall Rd | 0.27mi | 3/1.5 | 1,517 (-12%) | 6mo | $300,000 | $198 | 60 |
| 301 Idlewood Rd | 0.65mi | 4/1.5 (+1) | 1,810 (+5%) | 6mo | $475,000 | $262 | 50 |
| 161 Buckland Ave | 0.59mi | 4/1.5 (+1) | 1,617 (-6%) | 7mo | $525,000 | $325 | 49 |
| 56 Hunters Ln | 0.75mi | 3/2.5 | 1,926 (+11%) | 2mo | $506,000 | $263 | 42 |
Match score weights: distance 35% · size 25% · config 20% · recency 20%. Top-matched comps best support the ARV.
Projected returns pro-forma
-3.0% appreciation · 3.0% rent growth · sell at horizon
- IRR
- -11.9%
- Equity multiple
- 0.57×
- Total profit
- $-34,972
- Equity at exit
- $43,091
- IRR
- -2.7%
- Equity multiple
- 0.82×
- Total profit
- $-14,550
- Equity at exit
- $24,987
Cash invested: $80,920 (down + closing). Projections, not guarantees.
Landlord ↔ Tenant lean methodology
- Overall (STATE)
- 15 Strongly Tenant-Friendly
- State New York
- 15 Strongly Tenant-Friendly · D+10
- County
- — inherits STATE
- City
- — inherits STATE
ZIP-level market 14618
- Active inventory
- 116
- Price-to-rent
- 7.7×
Monthly cashflow live
- Estimated rent
- $3,132 medium interval (Pro) →
- Mortgage (P&I)
- −$1,516
- Tax from tax record
- −$656 /mo · $7,872/yr
- Insurance
- −$120
- HOA
- −$0
- Vacancy / Maint / Mgmt
- −$658
- Net cashflow
- $183
Break-even live
Sensitivity live
| Price | -10% $346 | -5% $264 | +0% $183 | +5% $101 | +10% $19 |
|---|---|---|---|---|---|
| Rent | -10% $-65 | -5% $59 | +0% $183 | +5% $306 | +10% $430 |
| Rate | -1.0pp $328 | -0.5pp $256 | base $183 | +0.5pp $108 | +1.0pp $32 |
UW: 25.0% down · 7.5% · 30yr · 1.5% tax · 5.0% vac · 8.0% maint · 8.0% mgmt
Financing live
Cash to close
- Down payment
- $72,250
- Closing costs
- $8,670
- Reserves months
- —
- Total cash needed
- —
Loan-product check · same deal, 3 products live
Conventional
25% down · 7.5% · 30yr
- Down + closing
- —
- Monthly P&I
- —
- Monthly cashflow
- —
- DSCR
- —
- Eligible?
- —
Personal DTI + credit; lowest rate.
DSCR
20% down · 8.5% · 30yr
- Down + closing
- —
- Monthly P&I
- —
- Monthly cashflow
- —
- DSCR
- —
- Eligible?
- —
No personal income docs; deal must DSCR.
Hard money
10% down · 12.0% · 12mo
- Down + closing
- —
- Monthly P&I
- —
- Monthly cashflow
- —
- DSCR
- —
- Eligible?
- —
Short-term bridge; refi at stabilization.
Rent comps 3 comps
| Address | Beds | Baths | Sqft | Rent | $/sqft | DOM | Units | Dist |
|---|---|---|---|---|---|---|---|---|
| 130 Brooklawn Dr Rochester, NY | 3.0 | 1.0 | 1380 | $2,950 | $2.14 | 45d | 1 | 0.18mi |
| 28 Chelmsford Rd Rochester, NY | 3.0 | 1.5 | 1365 | $3,100 | $2.27 | 45d | 1 | 0.55mi |
| 131 Greystone Ln Rochester, NY | 1.0–2.0 | 1.0–1.5 | 1000 | $1,555 | $1.55 | 4d | 1 | 1.29mi |
Listing history 3 events
-
2026-05-18status Pending 688-char remark
-
2026-05-09price $289,000 688-char remark
-
2026-04-28$299,000 Active 688-char remark
ⓘ Source: listings_history table (triggers on properties + properties_extension) + one-shot
backfill from property_details.listing_events for pre-trigger history.
Tax reassessment forecast NY · Partial reset (capped growth)
- Current annual tax
- $7,872 · $656/mo
- Projected year-2 tax
- $7,872 · $656/mo
- Expected delta
- $0/yr ($0/mo · 0.0%)
ⓘ Screening estimate from a state-policy table — verify with the county assessor before closing.
Climate risk First Street
- Flood 1/10 Low FEMA zone X (unshaded) · 0% chance over 30 yrs
- Wildfire 1/10 Low
- Heat 2/10 Low 7 d/yr ≥95°F today · 15 d/yr by 30 yrs out
- Wind 1/10 Low
- Air quality 2/10 Low 1 unhealthy d/yr today · 1 by 30 yrs out
Nearby sold comps map
Loading sold comps map…
Walkable amenities ~0.75 mi
Loading nearby amenities…
Taxation est. · year 1
- Rental income
- $37,589
- − Mortgage interest
- −$16,188
- − Property taxes
- −$7,872
- − Insurance
- −$1,445
- − Repairs & maintenance
- −$3,007
- − Management
- −$3,007
- − Depreciation
- −$8,407
- Taxable loss
- −$2,339
- Est. tax savings @ 24.0%
- +$561
- After-tax cash flow
- $2,752/yr
For passive investors: Depreciation is non-cash, so a rental often shows a tax loss while cash-flowing — sheltering income. Rental losses are passive: they offset passive income freely, and up to $25,000/yr can offset ordinary (W-2) income if you actively participate and your MAGI is under $100k (phasing out to $0 by $150k); unused losses carry forward. On sale, claimed depreciation is recaptured at up to 25%, and gains may owe capital-gains tax (a 1031 exchange can defer both). Figures are a year-1 estimate at your 24.0% rate — not tax advice; consult a CPA.
Schools (NCES district)
- District
- Brighton Central School District
- NCES district ID
- 3605460
- Math proficiency
- 64% ▼ -8.00%
- Reading proficiency
- 74% ▲ 6.00%
- Median HH income
- $71,403
- Composite
- 60.55/100
- National rank
- #837
- State rank
- #142 of 590 in NY
Livability — Brighton
- Score
- 81/100
- State rank
- #89
- US rank
- #1379
Category grades
Schools grade is shown separately in the Schools card above.
Census & demographics
- Census place
- Brighton, NY
- County
- Monroe County · 674,131 people
- City population
- 38,703
- Metro
- Rochester, NY
- Population (ZIP)
- 25,476
- Household income
- $125,098
- Rent vs Own
- Severe rent burden
- 548.0
Population outlook (Monroe County) Hauer SSP2
- Today (2025)
- 759,460 people
- By 2030
- 757,154 · -0.3%
- By 2040
- 740,644 · -2.5%
- By 2050
- 714,443 · -5.9%
- By 2075
- 645,883 · -15.0%
- By 2100
- 547,084 · -28.0%
Race, ethnicity, and origin ACS 2023
- Neighborhood character
- Predominantly White (80%)
- Race & ethnicity
- White 80% Asian 8% Two or more races 6% Black 4% Hispanic / Latino 3%
- Common ancestry
- Romanian 5% Scotch-Irish 3% Slovak 3%
- Foreign-born
- 10% · Canada, China, South Korea
- Languages at home
- 88% English-only · Other Asian/Pacific 2% Other Indo-European 2% Spanish 2%
Political lean MEDSL · Monroe
- 2024 margin
- D (+19.1) · D 59.5% · R 40.5%
- 2008→2024 swing
- +1.4pp toward D · 2008: 17.7pp · 2024: 19.1pp
- All cycles
- 2024: D+19.1 2020: D+21.0 2016: D+14.1 2012: D+17.4 2008: D+17.7
Not yet ingested
- Civics
- —
Market trends
- HPI YoY
- ▼ -246.83%
- Current HPI
- 271.6387
- Rent YoY
- —
- Metro
- Rochester, NY
- State GDP YoY
- ▲ 2.60%
- F500 in state
- 92
Industry mix (Fortune 500 HQ in NY)
| Industry | F500 HQs | Revenue |
|---|---|---|
| Financial Services | 10 | $950B |
|
||
| Consumer Goods | 9 | $162B |
|
||
| Insurance | 4 | $225B |
|
||
| Telecommunications | 2 | $144B |
|
||
| Pharmaceuticals | 2 | $112B |
|
||
| Media / Entertainment | 2 | $69B |
|
||
Price history
-3.3% since first listed3 events — show timeline
- 2026-05-18 Pending — UNYREIS
- 2026-05-09 Price Changed $289,000 UNYREIS
- 2026-04-28 Listed $299,000 UNYREIS
Property tax history
+1.7%/yrLatest (2025): $7,872 · +32.5% YoY. Source: county tax records.
Cash-flow waterfall
monthlySold comps — $/sqft
last 12 mo · ≤1 miLoading sold comps…