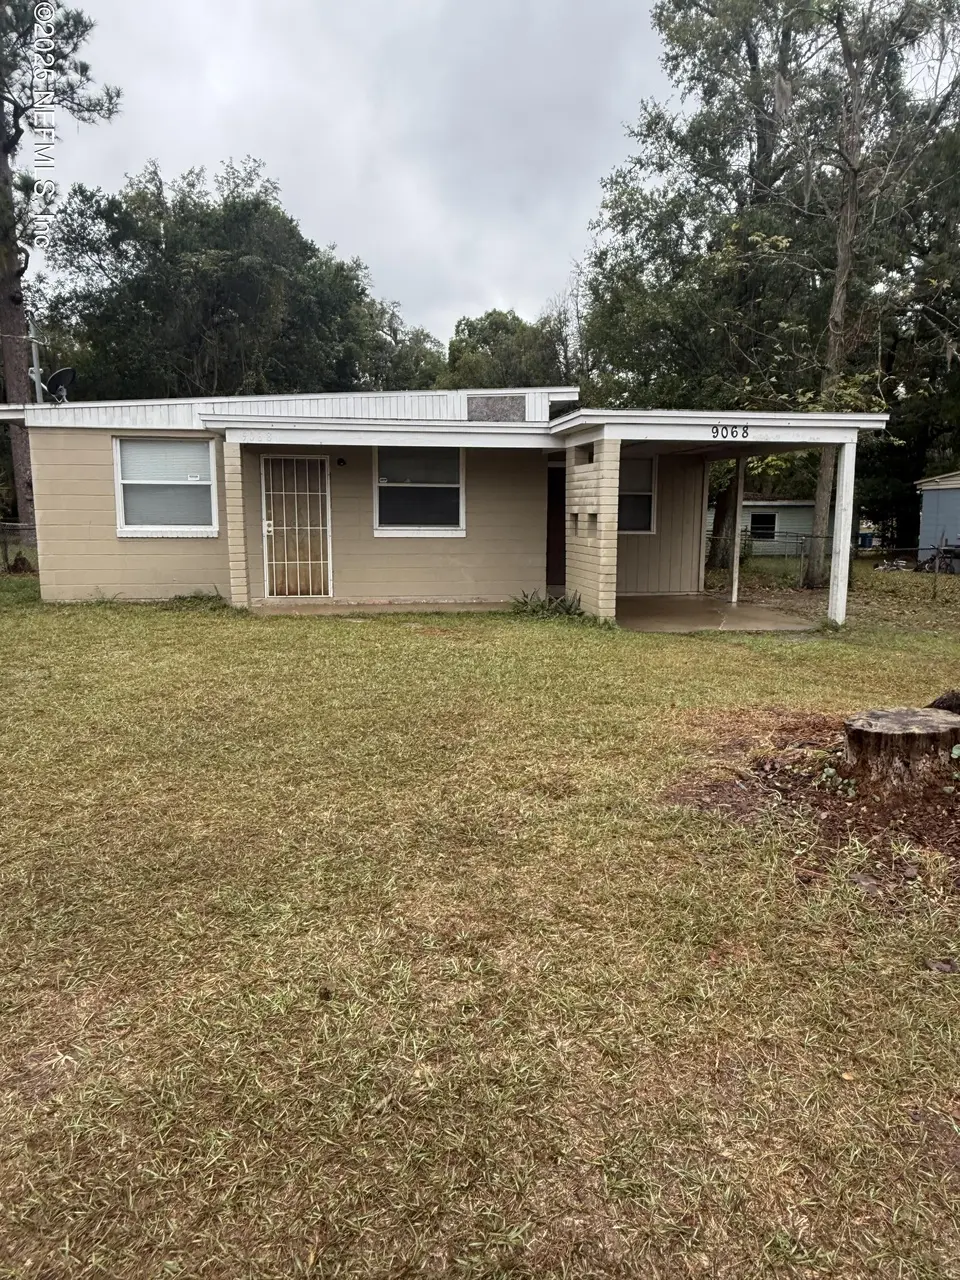
9068 11th Ave · Jacksonville, FL
Flood risk 7/10 · Major
- FEMA flood zone
- X (unshaded)
- Chance of flooding over 30 yrs
- 0.75%
- Est. flood insurance / yr
- $507 – $1,088
Fire risk 2/10 · Minimal
- Est. fire insurance / yr
- $947 – $1,759
Heat risk 9/10 · Severe
- Hot days now (above 107°F)
- 7 days/yr
- Hot days in 30 yrs
- 20 days/yr
Wind risk 9/10 · Severe
- Chance of severe wind over 30 yrs
- 99.0%
Air-quality risk 4/10 · Minor
- Unhealthy air days now
- 6 days/yr
- Unhealthy air days in 30 yrs
- 6 days/yr
Risk factors via First Street. Map © Google.
Why this score? — see what drove the B grade
The composite is a weighted blend of 9 inputs, each scored 0–100. Each bar is that input's sub-score; the figure is the points it added to the 100-point composite (weight × sub-score).
- Cash flow +30.0/30.0
- DSCR +10.0/10.0
- 1% rule +9.6/10.0
- ARV discount +9.0/15.0
- Livability +4.2/5.0
- Schools +3.9/10.0
- Condition / age +2.5/5.0
- Rent growth +2.2/5.0
- Appreciation +0.0/10.0
$95,900
🖨 Deal sheet 📄 Offer letter ✓ Due diligence
Listing remarks MLS
TURN KEY RENTAL 3/1 LVP AND TILE FLOOORING THROUGHOUT,CONCRETE BLOCK CONSTRUCTION. $1500 A MONTH RENTAL.
Key facts
- 6,098 sq ft lot
- Parking
- Built 1955
Property features AI
Finance
- HOA & community: Not a senior community
Exterior
- Parking: Carport (1 space)
- Utilities: Public sewer; Cable available; Electricity available
- Home design: Single-family residence; One story
- Construction: Block construction
- Exterior features: Shingle roof; City street frontage; Asphalt road surface
Interior
- Kitchen: Electric range; Refrigerator
- Bedrooms: 3 bedrooms
- Flooring: Tile; Vinyl
- Bathrooms: 1 full bathroom
- Heating & cooling: Central heating; Central air conditioning
- Interior features: Tile and vinyl flooring
- Laundry & utility: Electric dryer hookup
Neighborhood map
What this means for you Summary
Snapshot
- This is a 3-bed/1.0-bath single-family listed at $96k.
Deal economics
- At list price, monthly cash flow is $337 ($4k/yr) — positive.
- The deal already cash-flows at list — no discount required.
- Meets the 1% rule at list price ($1k rent vs $96k).
- Cap rate 11.3% vs local median 4.0% in Jacksonville — top-decile yield for the area; either an underpriced asset or a hidden risk that comps aren't pricing in. Stress-test before assuming the spread holds.
Location & tenants
- Location reads 83/100 on livability (#50 in FL, #911 nationally) — a professional / high-income tenant draw. Strengths: amenities A+, commute A+, housing A+.
- Duval (urban): math 46% / reading 45% proficiency, ranked #48 of 73 in FL (top 66%) — families likely to look elsewhere, expect single-tenant / working-renter base with shorter leases.
- Market conditions: Rents soft (-1.4%/yr); 291 active listings in the ZIP; 16 comparable units currently listed for rent nearby; rentals at typical pace (median 24d on market — plan ~3-4 weeks tenant-placement turnaround); lower-income renter base — watch delinquency; 6,503 units permitted in Duval County in 2024 (1,131 in 5+ unit buildings).
- This rent runs 41% of the median local income ($41k/yr) — at the standard rent-burdened threshold; future hikes will face affordability resistance.
Forward outlook
- Local home prices are declining (-3.0%/yr); year-one equity from $663 of loan paydown is wiped out by about $3k of value loss. Plan a longer hold.
- Duval County population projected at +19% by 2050 — long-run rental-demand tailwind backs the buy-and-hold thesis.
Negotiation context
- Only 12 days on market — expect competitive offers; lowballing is unlikely to land.
- 9 sale attempts since 22y ago with the ask held roughly flat each time — persistent listings suggest the price (not the market) is what's stuck; bring a comps-based counter.
- Current owner paid $80k; 19% above their basis — modest negotiation headroom, anchor on the comps not their cost.
Risks & watch-outs
- Watch-outs: flood insurance adds $66/mo; built in 1955 — expect roof / HVAC / electrical / plumbing capex.
- Climate carrying-cost: major flood risk; severe wind risk, 99% chance of damaging wind over 30y; extreme-heat days projected 7→20/yr by 2055 (HVAC capex compounding) — expect insurance premiums to compound above CPI over the hold.
Questions for the listing agent
- Built in 1955 — when were the roof, HVAC, electrical panel, plumbing, and water heater last replaced?
- What's the actual annual flood-insurance premium (NFIP or private), and is the property in a SFHA with mandatory coverage?
- Is there a deadline driving the sale (1031 exchange, divorce, estate, relocation)? That informs how much negotiation room exists.
- Schools are B-rated — typically a magnet for longer-tenancy family renters. What's the average tenant stay here, and is there a school-zone premium baked into asking?
- What's the average days-on-market for RENTAL listings here right now (not sales)? A rising rental-DOM trend means longer vacancies and softer asking-rent achievability than the comps imply.
- What's the recent tenant-quality profile in this submarket — average credit score on applications, eviction rate, late-payment / NSF rate, and stable-employment percentage? A property-management company in the area should have these aggregated.
- How much new for-sale + rental construction is in the pipeline within 1–3 miles? Heavy new supply typically softens prices + rents 12–24 months out; constrained supply supports both.
Investment metrics
- 1% rule
- 1.46% ✓
- Cap rate
- 11.34%
- Cash-on-cash
- 18.01%
- DSCR
- 1.80
- GRM
- 5.7
CMA / ARV
- ARV (on-the-fly)
- $99,120
- Comps found
- 12
Show comp detail 12 sales within ~0.75 mi
| Address | Dist | Beds/Ba | Sqft | Sold | Price | $/sf | Match |
|---|---|---|---|---|---|---|---|
| 9135 5th Ave | 0.32mi | 3/1.0 | 896 (+7%) | 1mo | $80,500 | $90 | 73 |
| 9152 6th Ave | 0.26mi | 2/1.0 (-1) | 792 (-6%) | 4mo | $119,000 | $150 | 70 |
| 9036 10th Ave | 0.06mi | 3/1.0 | 924 (+10%) | 13mo | $116,000 | $126 | 70 |
| 9346 10th Ave | 0.32mi | 2/1.0 (-1) | 864 (+3%) | 12mo | $124,000 | $144 | 65 |
| 9043 8th Ave | 0.17mi | 3/1.0 | 952 (+13%) | 10mo | $111,500 | $117 | 61 |
| 2140 Jayson Ave | 0.68mi | 3/1.0 | 768 (-9%) | 3mo | $82,000 | $107 | 52 |
| 9230 4th Ave | 0.38mi | 2/1.0 (-1) | 752 (-10%) | 12mo | $36,000 | $48 | 50 |
| 9058 Jefferson Ave | 0.66mi | 3/1.0 | 936 (+11%) | 0mo | $94,250 | $101 | 50 |
| 6722 Helston Ct | 0.72mi | 3/1.5 | 888 (+6%) | 15mo | $112,000 | $126 | 42 |
| 8726 4th Ave | 0.48mi | 2/1.0 (-1) | 952 (+13%) | 10mo | $85,000 | $89 | 42 |
| 9703 Campus Ave | 0.74mi | 3/2.0 | 760 (-10%) | 6mo | $90,000 | $118 | 41 |
| 2116 4th Ave | 0.65mi | 2/1.0 (-1) | 720 (-14%) | 11mo | $149,000 | $207 | 31 |
Match score weights: distance 35% · size 25% · config 20% · recency 20%. Top-matched comps best support the ARV.
Projected returns pro-forma
-3.0% appreciation · 0.0% rent growth · sell at horizon
- IRR
- 1.9%
- Equity multiple
- 1.07×
- Total profit
- $1,877
- Equity at exit
- $14,299
- IRR
- 7.9%
- Equity multiple
- 1.51×
- Total profit
- $13,709
- Equity at exit
- $8,292
Cash invested: $26,852 (down + closing). Projections, not guarantees.
Landlord ↔ Tenant lean methodology
- Overall (STATE)
- 87 Strongly Landlord-Friendly
- State Florida
- 87 Strongly Landlord-Friendly · R+3
- County
- — inherits STATE
- City
- — inherits STATE
ZIP-level market 32208
- Home prices YoY
- -33.6%
- Rents YoY
- -1.4%
- Active inventory
- 291
- Price-to-rent
- 5.7×
Monthly cashflow live
- Estimated rent
- $1,403 high interval (Pro) →
- Mortgage (P&I)
- −$503
- Tax from tax record
- −$163 /mo · $1,951/yr
- Insurance
- −$40
- Flood insurance flood zone
- −$66 /mo · $798/yr
- HOA
- −$0
- Vacancy / Maint / Mgmt
- −$295
- Net cashflow
- $337
Break-even live
UW: 25.0% down · 7.5% · 30yr · 1.5% tax · 5.0% vac · 8.0% maint · 8.0% mgmt
Financing live
Cash to close
- Down payment
- $23,975
- Closing costs
- $2,877
- Reserves months
- —
- Total cash needed
- —
Loan-product check · same deal, 3 products live
Conventional
25% down · 7.5% · 30yr
- Down + closing
- —
- Monthly P&I
- —
- Monthly cashflow
- —
- DSCR
- —
- Eligible?
- —
Personal DTI + credit; lowest rate.
DSCR
20% down · 8.5% · 30yr
- Down + closing
- —
- Monthly P&I
- —
- Monthly cashflow
- —
- DSCR
- —
- Eligible?
- —
No personal income docs; deal must DSCR.
Hard money
10% down · 12.0% · 12mo
- Down + closing
- —
- Monthly P&I
- —
- Monthly cashflow
- —
- DSCR
- —
- Eligible?
- —
Short-term bridge; refi at stabilization.
Rent comps 16 comps
| Address | Beds | Baths | Sqft | Rent | $/sqft | DOM | Units | Dist |
|---|---|---|---|---|---|---|---|---|
| 9050 7th Ave Jacksonville, FL | 3.0 | 1.0 | 896 | $1,485 | $1.66 | 23d | 1 | 0.16mi |
| 9248 9th Ave Jacksonville, FL | 2.0 | 1.0 | 646 | $995 | $1.54 | 23d | 1 | 0.22mi |
| 9017 6th Ave Jacksonville, FL | 2.0 | 1.0 | 1038 | $1,098 | $1.06 | 23d | 1 | 0.25mi |
| 9346 10th Ave Jacksonville, FL | 3.0 | 1.0 | 985 | $1,825 | $1.85 | 23d | 1 | 0.31mi |
| 8663 5th Ave Jacksonville, FL | 2.0 | 1.0 | 720 | $1,045 | $1.45 | 23d | 1 | 0.50mi |
| 2389 Hilly Rd Jacksonville, FL | 3.0 | 1.0 | 908 | $1,650 | $1.82 | 23d | 1 | 0.54mi |
| 8642 2nd Ave Jacksonville, FL | 3.0 | 2.0 | 1074 | $1,245 | $1.16 | 1d | 1 | 0.60mi |
| 8617 3rd Ave Jacksonville, FL | 3.0 | 1.0 | 1048 | $1,200 | $1.15 | 10d | 1 | 0.62mi |
| 1975 Rugby Rd Jacksonville, FL | 2.0 | 1.0 | 992 | $1,100 | $1.11 | 7d | 1 | 0.65mi |
| 9131 Jefferson Ave Jacksonville, FL | 3.0 | 1.0 | 910 | $1,350 | $1.48 | 4d | 1 | 0.66mi |
| 2534 Aubrey Ave Jacksonville, FL | 4.0 | 2.0 | 759 | $1,250 | $1.65 | 23d | 1 | 0.92mi |
| 2312 Palmdale St Jacksonville, FL | 3.0 | 2.0 | 972 | $1,231 | $1.27 | 23d | 1 | 0.99mi |
| 7927 Reid Ave Jacksonville, FL | 3.0 | 1.0 | 1055 | $1,500 | $1.42 | 23d | 1 | 1.15mi |
| 8253 Lexington Dr Jacksonville, FL | 3.0 | 1.0 | 910 | $1,330 | $1.46 | 23d | 1 | 1.30mi |
| 912 Saratoga Blvd Jacksonville, FL | 3.0 | 1.0 | 930 | $1,250 | $1.34 | 23d | 1 | 1.32mi |
| 9658 Gibson Ave Jacksonville, FL | 3.0 | 1.5 | 977 | $1,225 | $1.25 | 23d | 1 | 1.35mi |
Listing history 31 events
-
2026-06-08statusdays on market $95,900 Pending 12 DOM
-
2026-06-07days on market $95,900 Active 11 DOM
-
2026-06-05days on market $95,900 Active 8 DOM
-
2026-06-03days on market $95,900 Active 7 DOM
-
2026-06-02days on market $95,900 Active 6 DOM
-
2026-06-01days on market $95,900 Active 5 DOM
-
2026-05-31days on market $95,900 Active 4 DOM
-
2026-05-05$95,900 Active
-
2026-04-29status Active 105-char remark
Show marketing remark (105 chars)
TURN KEY RENTAL 3/1 LVP AND TILE FLOOORING THROUGHOUT,CONCRETE BLOCK CONSTRUCTION. $1500 A MONTH RENTAL.
-
2026-04-20status Pending 105-char remark
Show marketing remark (105 chars)
TURN KEY RENTAL 3/1 LVP AND TILE FLOOORING THROUGHOUT,CONCRETE BLOCK CONSTRUCTION. $1500 A MONTH RENTAL.
-
2026-04-20historical 105-char remark
Show marketing remark (105 chars)
TURN KEY RENTAL 3/1 LVP AND TILE FLOOORING THROUGHOUT,CONCRETE BLOCK CONSTRUCTION. $1500 A MONTH RENTAL.
-
2026-03-20$95,900 Active 105-char remark
Show marketing remark (105 chars)
TURN KEY RENTAL 3/1 LVP AND TILE FLOOORING THROUGHOUT,CONCRETE BLOCK CONSTRUCTION. $1500 A MONTH RENTAL.
-
2026-03-19status Active 105-char remark
Show marketing remark (105 chars)
TURN KEY RENTAL 3/1 LVP AND TILE FLOOORING THROUGHOUT,CONCRETE BLOCK CONSTRUCTION. $1500 A MONTH RENTAL.
-
2026-03-11status Pending 105-char remark
Show marketing remark (105 chars)
TURN KEY RENTAL 3/1 LVP AND TILE FLOOORING THROUGHOUT,CONCRETE BLOCK CONSTRUCTION. $1500 A MONTH RENTAL.
-
2026-03-11historical 105-char remark
Show marketing remark (105 chars)
TURN KEY RENTAL 3/1 LVP AND TILE FLOOORING THROUGHOUT,CONCRETE BLOCK CONSTRUCTION. $1500 A MONTH RENTAL.
-
2026-01-28$99,900 Active 105-char remark
Show marketing remark (105 chars)
TURN KEY RENTAL 3/1 LVP AND TILE FLOOORING THROUGHOUT,CONCRETE BLOCK CONSTRUCTION. $1500 A MONTH RENTAL.
-
2026-01-27historical
-
2025-12-04price $109,900
-
2025-12-04$109 Active
-
2019-07-24soldstatus $80,500
-
2009-01-14historical
-
2009-01-13soldstatus $13,000
-
2008-10-15$13,000
-
2005-03-07soldstatus $70,000
-
2005-02-02historical
-
2004-11-16historical
-
2004-08-02$78,500
-
2004-05-16$69,900
-
1999-07-23soldstatus $54,000
-
1999-07-23soldstatus $54,000
-
1976-11-05soldstatus $6,800
ⓘ Source: listings_history table (triggers on properties + properties_extension) + one-shot
backfill from property_details.listing_events for pre-trigger history.
Tax reassessment forecast FL · Resets to sale price
- Current annual tax
- $1,951 · $163/mo
- Projected year-2 tax
- $1,951 · $163/mo
- Expected delta
- $0/yr ($0/mo · 0.0%)
ⓘ Screening estimate from a state-policy table — verify with the county assessor before closing.
Climate risk First Street
- Flood 7/10 Severe FEMA zone X (unshaded) · 75% chance over 30 yrs
- Wildfire 2/10 Low
- Heat 9/10 Extreme 7 d/yr ≥107°F today · 20 d/yr by 30 yrs out
- Wind 9/10 Extreme 99% chance of damaging wind over 30 yrs
- Air quality 4/10 Moderate 6 unhealthy d/yr today · 6 by 30 yrs out
Nearby sold comps map
Loading sold comps map…
Walkable amenities ~0.75 mi
Loading nearby amenities…
Taxation est. · year 1
- Rental income
- $16,839
- − Mortgage interest
- −$5,372
- − Property taxes
- −$1,951
- − Insurance
- −$1,277
- − Repairs & maintenance
- −$1,347
- − Management
- −$1,347
- − Depreciation
- −$2,790
- Taxable income
- $2,755
- Est. tax owed @ 24.0%
- −$661
- After-tax cash flow
- $3,379/yr
For passive investors: Depreciation is non-cash, so a rental often shows a tax loss while cash-flowing — sheltering income. Rental losses are passive: they offset passive income freely, and up to $25,000/yr can offset ordinary (W-2) income if you actively participate and your MAGI is under $100k (phasing out to $0 by $150k); unused losses carry forward. On sale, claimed depreciation is recaptured at up to 25%, and gains may owe capital-gains tax (a 1031 exchange can defer both). Figures are a year-1 estimate at your 24.0% rate — not tax advice; consult a CPA.
Schools (NCES district)
- District
- Duval
- NCES district ID
- 1200480
- Math proficiency
- 46% ▼ -11.00%
- Reading proficiency
- 45% ▼ -4.00%
- Median HH income
- $48,987
- Composite
- 38.97/100
- National rank
- #4076
- State rank
- #48 of 73 in FL
Livability — Jacksonville
- Score
- 83/100
- State rank
- #50
- US rank
- #911
Category grades
Schools grade is shown separately in the Schools card above.
Census & demographics
- Census place
- Jacksonville, FL
- County
- Duval County · 1,015,274 people
- City population
- 979,034
- Metro
- Jacksonville, FL
- Population (ZIP)
- 32,699
- Household income
- $41,324
- Rent vs Own
- Severe rent burden
- 1765.0
Population outlook (Duval County) Hauer SSP2
- Today (2025)
- 1,013,010 people
- By 2030
- 1,059,228 · +4.6%
- By 2040
- 1,141,439 · +12.7%
- By 2050
- 1,205,258 · +19.0%
- By 2075
- 1,324,282 · +30.7%
- By 2100
- 1,319,620 · +30.3%
Race, ethnicity, and origin ACS 2023
- Neighborhood character
- Predominantly Black (77%)
- Race & ethnicity
- Black 77% White 16% Two or more races 4% Hispanic / Latino 3%
- Common ancestry
- Italian 1%
- Foreign-born
- 2% · Canada
- Languages at home
- 97% English-only · Spanish 2%
Political lean MEDSL · Duval
- 2024 margin
- Toss-up / Even · D 48.7% · R 50.1% · Other 1.2%
- 2008→2024 swing
- +0.4pp no change · 2008: -1.9pp · 2024: -1.5pp
- All cycles
- 2024: R+1.5 2020: D+3.8 2016: R+1.5 2012: R+3.6 2008: R+1.9
Not yet ingested
- Civics
- —
Market trends
- HPI YoY
- ▼ -110.56%
- Current HPI
- 217.9706
- Rent YoY
- ▼ -1.36%
- Metro
- Jacksonville, FL
- State GDP YoY
- ▲ 3.28%
- F500 in state
- 36
Industry mix (Fortune 500 HQ in FL)
| Industry | F500 HQs | Revenue |
|---|---|---|
| Industrial Technology | 2 | $29B |
|
||
| Insurance | 2 | $17B |
|
||
| Retail | 1 | $60B |
|
||
| Technology Distribution | 1 | $58B |
|
||
| Homebuilding | 1 | $35B |
|
||
| Technology Manufacturing | 1 | $35B |
|
||
Price history
+1310.3% since first listed24 events — show timeline
- 2026-05-05 Listed $95,900 realMLS
- 2026-04-29 Relisted — realMLS
- 2026-04-20 Pending — realMLS
- 2026-04-20 Listing Removed — realMLS
- 2026-03-20 Listed $95,900 realMLS
- 2026-03-19 Relisted — realMLS
- 2026-03-11 Pending — realMLS
- 2026-03-11 Listing Removed — realMLS
- 2026-01-28 Listed $99,900 realMLS
- 2026-01-27 Listing Removed — realMLS
- 2025-12-04 Price Changed $109,900 realMLS
- 2025-12-04 Listed $109 realMLS
- 2019-07-24 Sold (Public Records) $80,500 Public Records
- 2009-01-14 Listing Removed — realMLS
- 2009-01-13 Sold (MLS) $13,000 realMLS
- 2008-10-15 Listed $13,000 realMLS
- 2005-03-07 Sold (Public Records) $70,000 Public Records
- 2005-02-02 Listing Removed — realMLS
- 2004-11-16 Listing Removed — realMLS
- 2004-08-02 Listed $78,500 realMLS
- 2004-05-16 Listed $69,900 realMLS
- 1999-07-23 Sold (Public Records) $54,000 Public Records
- 1999-07-23 Sold (Public Records) $54,000 Public Records
- 1976-11-05 Sold (Public Records) $6,800 Public Records
Property tax history
+9.6%/yrLatest (2025): $1,951 · +18.3% YoY. Source: county tax records.
Cash-flow waterfall
monthlySold comps — $/sqft
last 12 mo · ≤1 miLoading sold comps…