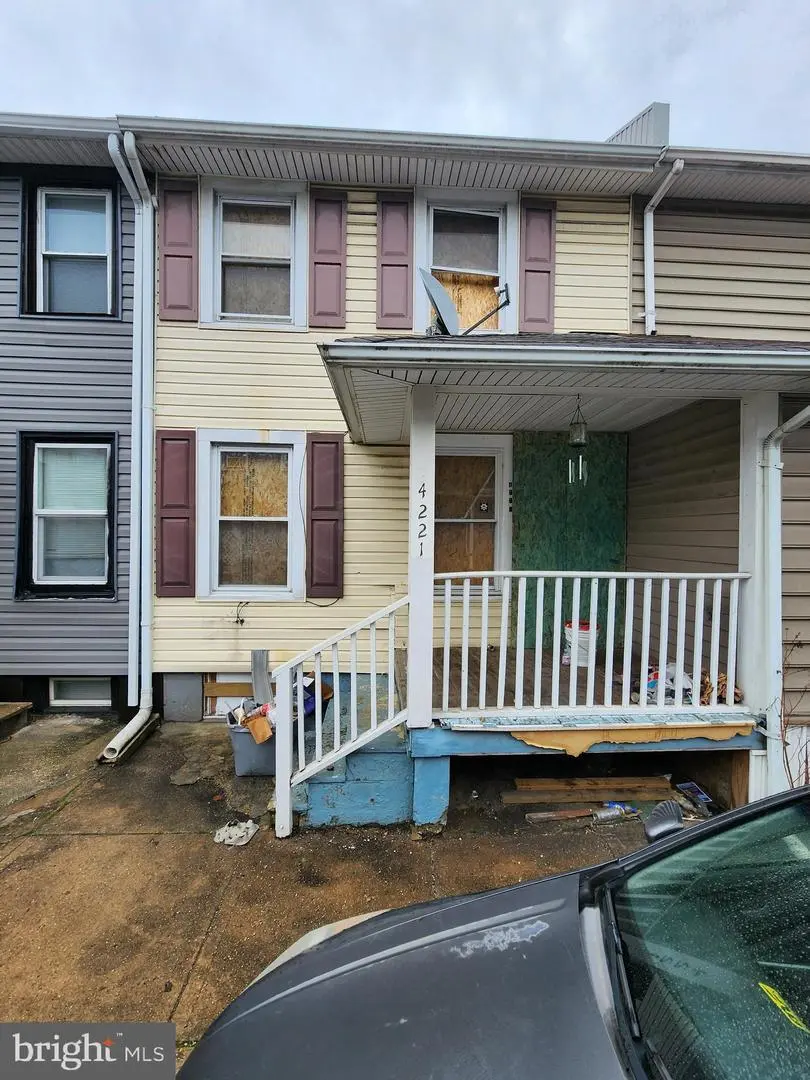
4221 Morrison Ct · Baltimore, MD
Flood risk 1/10 · Minimal
- FEMA flood zone
- X (unshaded)
- Chance of flooding over 30 yrs
- 0.0%
- Est. flood insurance / yr
- $473 – $860
Fire risk 1/10 · Minimal
- Est. fire insurance / yr
- $755 – $1,403
Heat risk 8/10 · Major
- Hot days now (above 103°F)
- 7 days/yr
- Hot days in 30 yrs
- 15 days/yr
Wind risk 6/10 · Moderate
- Chance of severe wind over 30 yrs
- 27.0%
Air-quality risk 4/10 · Minor
- Unhealthy air days now
- 5 days/yr
- Unhealthy air days in 30 yrs
- 7 days/yr
Risk factors via First Street. Map © Google.
Why this score? — see what drove the C- grade
The composite is a weighted blend of 9 inputs, each scored 0–100. Each bar is that input's sub-score; the figure is the points it added to the 100-point composite (weight × sub-score).
- Cash flow +15.0/30.0
- Appreciation +8.9/10.0
- ARV discount +7.5/15.0
- 1% rule +5.0/10.0
- DSCR +5.0/10.0
- Livability +3.8/5.0
- Rent growth +2.5/5.0
- Condition / age +2.5/5.0
- Schools +1.0/10.0
$30,000
🖨 Deal sheet 📄 Offer letter ✓ Due diligence
Listing remarks MLS
Price improvement. Full renovation opportunity in Curtis Bay with strong upside potential. The property requires a complete rehab with interior demolition already started, offering a head start for investors looking to complete the project. Traditional rowhome layout provides a straightforward renovation scope, ideal for resale or long-term rental strategy. After-repair value supported by nearby renovated comparable sales. Sold strictly as-is. Cash or renovation financing only.
Key facts
- Built 1920
- Listed 37 days
Neighborhood map
What this means for you Summary
Snapshot
- This is a 2-bed/1.0-bath townhouse listed at $30k.
Deal economics
- At list price, monthly cash flow is $834 ($10k/yr) — positive.
- The deal already cash-flows at list — no discount required.
- Meets the 1% rule at list price ($1k rent vs $30k).
- Recommended offer: $29k (3.0% below list) — sets the bar for market timing.
- Cap rate 39.6% vs local median 6.0% in Baltimore — top-decile yield for the area; either an underpriced asset or a hidden risk that comps aren't pricing in. Stress-test before assuming the spread holds.
Location & tenants
- Location reads 76/100 on livability (#90 in MD, #3,396 nationally) — a middle-class / working-renter tenant base. Strengths: amenities A+, commute A+, housing A+; Watch: schools D, crime F.
- Baltimore City Public Schools (urban): math 7% / reading 16% proficiency, ranked #24 of 24 in MD (top 100%) — low school quality limits family demand, transient renter base, plan for 1-2y turnover; 79% free/reduced lunch — lower-income household profile, screen leases tightly.
- Market conditions: 45 active listings in the ZIP; 22 comparable units currently listed for rent nearby; rentals at typical pace (median 24d on market — plan ~3-4 weeks tenant-placement turnaround); 1,273 units permitted in Baltimore city in 2024 (1,104 in 5+ unit buildings).
Forward outlook
- In year one you build about $3k of equity ($207 loan paydown + $2k appreciation (7.8% local appreciation)).
- Baltimore County population projected to shrink 4% by 2050 — rents likely to lag national; underwrite the cash flow, not the appreciation.
- At projected returns (7.8% appreciation + 3.0% rent growth), your $8k cash investment doubles in ~1 year — after that, you're playing with house money.
Negotiation context
- It's been on market 37 days — a 3% lower offer ($29k) is reasonable based on typical stale-listing flexibility.
- 7 sale attempts since 3y ago; this cycle's ask has dropped $12k (29%) from the opening price — seller is motivated, your offer sets the floor, not the list.
Risks & watch-outs
- Watch-outs: property tax is 4.4% of price; built in 1920 — expect roof / HVAC / electrical / plumbing capex.
- Climate carrying-cost: major wind risk, 27% chance of damaging wind over 30y; extreme-heat days projected 7→15/yr by 2055 (HVAC capex compounding) — expect insurance premiums to compound above CPI over the hold.
Questions for the listing agent
- It's been on market 37 days. Have you received any prior offers? Is the seller open to a 3% concession, seller financing, or rate buy-down credit?
- Built in 1920 — when were the roof, HVAC, electrical panel, plumbing, and water heater last replaced?
- Property tax is high relative to price — has the assessment been appealed recently, and will the sale trigger a re-assessment?
- Is there a deadline driving the sale (1031 exchange, divorce, estate, relocation)? That informs how much negotiation room exists.
- Schools are D-rated, which usually means shorter tenancies and higher turnover. Who's the typical renter profile here, and what's been the actual vacancy rate?
- Crime grade is F in this area — have there been break-ins, vandalism, or insurance claims at this property in the last 3 years? What carrier currently insures it and at what premium?
- What's the average days-on-market for RENTAL listings here right now (not sales)? A rising rental-DOM trend means longer vacancies and softer asking-rent achievability than the comps imply.
- What's the recent tenant-quality profile in this submarket — average credit score on applications, eviction rate, late-payment / NSF rate, and stable-employment percentage? A property-management company in the area should have these aggregated.
- How much new for-sale + rental construction is in the pipeline within 1–3 miles? Heavy new supply typically softens prices + rents 12–24 months out; constrained supply supports both.
Investment metrics
- 1% rule
- 4.70% ✓
- Cap rate
- 39.64%
- Cash-on-cash
- 119.10%
- DSCR
- 6.30
- GRM
- 1.8
CMA / ARV
- ARV (median comp)
- $68,506
- List price
- $30,000
- Delta
- -56.21%
- Verdict
- UNDERPRICED
- Comps
- 20 within 1.0 mi
Show comp detail 12 sales within ~0.75 mi
| Address | Dist | Beds/Ba | Sqft | Sold | Price | $/sf | Match |
|---|---|---|---|---|---|---|---|
| 4221 Morrison Ct | 0.00mi | 2/1.5 | 832 (0%) | 1mo | $25,000 | $30 | 97 |
| 4206 Grace Ct | 0.03mi | 2/1.0 | 832 (0%) | 6mo | $60,500 | $73 | 94 |
| 4101 Morrison Ct | 0.09mi | 2/1.0 | 832 (0%) | 6mo | $32,500 | $39 | 91 |
| 1607 Cereal St | 0.37mi | 2/1.0 | 840 (+1%) | 6mo | $70,000 | $83 | 76 |
| 3832 Saint Margaret St | 0.56mi | 2/1.0 | 810 (-3%) | 2mo | $90,000 | $111 | 68 |
| 1522 Plum St | 0.13mi | 2/1.0 | 728 (-12%) | 10mo | $65,000 | $89 | 65 |
| 3750 Saint Margaret St | 0.57mi | 2/1.0 | 784 (-6%) | 1mo | $140,000 | $179 | 62 |
| 3708 10th St | 0.64mi | 2/1.0 | 810 (-3%) | 6mo | $88,500 | $109 | 61 |
| 3727 Saint Margaret St | 0.56mi | 2/1.0 | 784 (-6%) | 6mo | $65,000 | $83 | 59 |
| 3816 10th St | 0.61mi | 2/1.0 | 864 (+4%) | 9mo | $126,800 | $147 | 57 |
| 3825 10th St | 0.58mi | 3/1.0 (+1) | 810 (-3%) | 10mo | $110,000 | $136 | 55 |
| 3608 Saint Victor St | 0.69mi | 3/2.0 (+1) | 864 (+4%) | 11mo | $150,000 | $174 | 43 |
Match score weights: distance 35% · size 25% · config 20% · recency 20%. Top-matched comps best support the ARV.
Projected returns pro-forma
7.75% appreciation · 3.0% rent growth · sell at horizon
- IRR
- —
- Equity multiple
- 8.74×
- Total profit
- $65,043
- Equity at exit
- $22,283
- IRR
- —
- Equity multiple
- 18.78×
- Total profit
- $149,393
- Equity at exit
- $43,755
Cash invested: $8,400 (down + closing). Projections, not guarantees.
Landlord ↔ Tenant lean methodology
- Overall (CITY)
- 12 Strongly Tenant-Friendly
- State Maryland
- 27 Tenant-Leaning · D+14
- County
- — inherits STATE
- City Baltimore
- 12 Strongly Tenant-Friendly · D+58
ZIP-level market 21226
- Home prices YoY
- 2.5%
- Active inventory
- 45
- Price-to-rent
- 1.8×
Monthly cashflow live
- Estimated rent
- $1,411 high interval (Pro) →
- Mortgage (P&I)
- −$157
- Tax from tax record
- −$111 /mo · $1,334/yr
- Insurance
- −$12
- HOA
- −$0
- Vacancy / Maint / Mgmt
- −$296
- Net cashflow
- $834
Break-even live
UW: 25.0% down · 7.5% · 30yr · 1.5% tax · 5.0% vac · 8.0% maint · 8.0% mgmt
Financing live
Cash to close
- Down payment
- $7,500
- Closing costs
- $900
- Reserves months
- —
- Total cash needed
- —
Loan-product check · same deal, 3 products live
Conventional
25% down · 7.5% · 30yr
- Down + closing
- —
- Monthly P&I
- —
- Monthly cashflow
- —
- DSCR
- —
- Eligible?
- —
Personal DTI + credit; lowest rate.
DSCR
20% down · 8.5% · 30yr
- Down + closing
- —
- Monthly P&I
- —
- Monthly cashflow
- —
- DSCR
- —
- Eligible?
- —
No personal income docs; deal must DSCR.
Hard money
10% down · 12.0% · 12mo
- Down + closing
- —
- Monthly P&I
- —
- Monthly cashflow
- —
- DSCR
- —
- Eligible?
- —
Short-term bridge; refi at stabilization.
Rent comps 22 comps
| Address | Beds | Baths | Sqft | Rent | $/sqft | DOM | Units | Dist |
|---|---|---|---|---|---|---|---|---|
| 1628 Plum St Apt B (CB) Baltimore, MD | 1.0 | 1.0 | 800 | $850 | $1.06 | 23d | 1 | 0.12mi |
| 1353 Cambria St Brooklyn, MD | 3.0 | 2.0 | 986 | $1,600 | $1.62 | 17d | 1 | 0.39mi |
| 1305 E Patapsco Ave Brooklyn, MD | 3.0 | 1.5 | 930 | $1,650 | $1.77 | 4d | 1 | 0.46mi |
| 1049 E Patapsco Ave Unit a Baltimore, MD | 2.0 | 1.0 | 748 | $1,257 | $1.68 | 43d | 1 | 0.57mi |
| 3826 10th St Unit Entire House Baltimore, MD | 3.0 | 2.0 | 1110 | $2,400 | $2.16 | 23d | 1 | 0.60mi |
| 837 E Jeffrey St Apt 1 Baltimore, MD | 1.0 | 1.0 | 1116 | $900 | $0.81 | 17d | 1 | 0.71mi |
| 837 E Jeffrey St Unit 2 Baltimore, MD | 1.0 | 1.0 | 1116 | $900 | $0.81 | 43d | 1 | 0.71mi |
| 807 Stoll St Unit 1 Baltimore, MD | 1.0 | 1.0 | 658 | $1,000 | $1.52 | 43d | 1 | 0.73mi |
| 3840 8th St Brooklyn, MD | 3.0 | 1.5 | 1088 | $1,606 | $1.48 | 4d | 1 | 0.82mi |
| 5215 Wasena Ave Brooklyn, MD | 3.0 | 1.0 | 1030 | $1,650 | $1.60 | 43d | 1 | 0.83mi |
| 5227 Patrick Henry Dr Brooklyn, MD | 2.0 | 1.0 | 736 | $1,326 | $1.80 | 21d | 1 | 0.92mi |
| 4206 Audrey Ave Brooklyn, MD | 2.0 | 2.0 | 1104 | $1,275 | $1.15 | 43d | 1 | 0.95mi |
| 4206 Audrey Ave Brooklyn, MD | 3.0 | 3.0 | 1104 | $1,950 | $1.77 | 23d | 1 | 0.95mi |
| 507 Washburn Ave Brooklyn, MD | 3.0 | 1.5 | 1024 | $2,500 | $2.44 | 23d | 1 | 1.00mi |
| 507 Washburn Ave Brooklyn, MD | 3.0 | 1.5 | 1024 | $2,500 | $2.44 | 4d | 1 | 1.00mi |
| 507 Washburn Ave Brooklyn, MD | 3.0 | 1.5 | 1024 | $2,500 | $2.44 | 20d | 1 | 1.00mi |
| 3528 6th St Brooklyn, MD | 2.0 | 2.5 | 1060 | $1,500 | $1.42 | 17d | 1 | 1.05mi |
| 1 Ballman Ct Unit 2 Baltimore, MD | 2.0 | 1.0 | 700 | $1,250 | $1.79 | 43d | 1 | 1.09mi |
| 4400 4th St Unit BASEMENT Baltimore, MD | 2.0 | 1.0 | 925 | $1,350 | $1.46 | 43d | 1 | 1.14mi |
| 520 Baltic Ave Unit B Baltimore, MD | 1.0 | 1.0 | 800 | $1,050 | $1.31 | 43d | 1 | 1.15mi |
| 4207 3rd St Unit 3 Brooklyn, MD | 2.0 | 1.0 | 850 | $1,595 | $1.88 | 5d | 1 | 1.21mi |
| 3513 Horton Ave Brooklyn, MD | 3.0 | 1.0 | 1020 | $1,600 | $1.57 | 17d | 1 | 1.25mi |
Listing history 20 events
-
2026-05-13status Pending 482-char remark
Show marketing remark (482 chars)
Price improvement. Full renovation opportunity in Curtis Bay with strong upside potential. The property requires a complete rehab with interior demolition already started, offering a head start for investors looking to complete the project. Traditional rowhome layout provides a straightforward renovation scope, ideal for resale or long-term rental strategy. After-repair value supported by nearby renovated comparable sales. Sold strictly as-is. Cash or renovation financing only.
-
2026-05-01price $30,000 482-char remark
Show marketing remark (482 chars)
Price improvement. Full renovation opportunity in Curtis Bay with strong upside potential. The property requires a complete rehab with interior demolition already started, offering a head start for investors looking to complete the project. Traditional rowhome layout provides a straightforward renovation scope, ideal for resale or long-term rental strategy. After-repair value supported by nearby renovated comparable sales. Sold strictly as-is. Cash or renovation financing only.
-
2026-04-16price $35,000 482-char remark
Show marketing remark (482 chars)
Price improvement. Full renovation opportunity in Curtis Bay with strong upside potential. The property requires a complete rehab with interior demolition already started, offering a head start for investors looking to complete the project. Traditional rowhome layout provides a straightforward renovation scope, ideal for resale or long-term rental strategy. After-repair value supported by nearby renovated comparable sales. Sold strictly as-is. Cash or renovation financing only.
-
2026-04-06$42,500 Active 482-char remark
Show marketing remark (482 chars)
Price improvement. Full renovation opportunity in Curtis Bay with strong upside potential. The property requires a complete rehab with interior demolition already started, offering a head start for investors looking to complete the project. Traditional rowhome layout provides a straightforward renovation scope, ideal for resale or long-term rental strategy. After-repair value supported by nearby renovated comparable sales. Sold strictly as-is. Cash or renovation financing only.
-
2026-04-05historical $42,500 482-char remark
Show marketing remark (482 chars)
Price improvement. Full renovation opportunity in Curtis Bay with strong upside potential. The property requires a complete rehab with interior demolition already started, offering a head start for investors looking to complete the project. Traditional rowhome layout provides a straightforward renovation scope, ideal for resale or long-term rental strategy. After-repair value supported by nearby renovated comparable sales. Sold strictly as-is. Cash or renovation financing only.
-
2025-03-04soldstatus $36,000 Closed
-
2025-02-08status Active Under Contract
-
2025-01-31historical
-
2025-01-27status Active
-
2025-01-15historical
-
2024-10-14$74,900 Active
-
2024-06-30historical
-
2024-01-31$74,900 Active
-
2024-01-10historical
-
2023-10-31historical
-
2023-10-04price $79,999
-
2023-09-28$85,000 Active
-
2023-09-19historical
-
2023-09-18$84,999 Active
-
2004-07-12soldstatus $42,900
ⓘ Source: listings_history table (triggers on properties + properties_extension) + one-shot
backfill from property_details.listing_events for pre-trigger history.
Tax reassessment forecast MD · Partial reset (capped growth)
- Current annual tax
- $1,334 · $111/mo
- Projected year-2 tax
- $1,334 · $111/mo
- Expected delta
- $0/yr ($0/mo · 0.0%)
ⓘ Screening estimate from a state-policy table — verify with the county assessor before closing.
Climate risk First Street
- Flood 1/10 Low FEMA zone X (unshaded) · 0% chance over 30 yrs
- Wildfire 1/10 Low
- Heat 8/10 Severe 7 d/yr ≥103°F today · 15 d/yr by 30 yrs out
- Wind 6/10 Major 27% chance of damaging wind over 30 yrs
- Air quality 4/10 Moderate 5 unhealthy d/yr today · 7 by 30 yrs out
Nearby sold comps map
Loading sold comps map…
Walkable amenities ~0.75 mi
Loading nearby amenities…
Taxation est. · year 1
- Rental income
- $16,932
- − Mortgage interest
- −$1,680
- − Property taxes
- −$1,334
- − Insurance
- −$150
- − Repairs & maintenance
- −$1,355
- − Management
- −$1,355
- − Depreciation
- −$873
- Taxable income
- $10,185
- Est. tax owed @ 24.0%
- −$2,444
- After-tax cash flow
- $7,560/yr
For passive investors: Depreciation is non-cash, so a rental often shows a tax loss while cash-flowing — sheltering income. Rental losses are passive: they offset passive income freely, and up to $25,000/yr can offset ordinary (W-2) income if you actively participate and your MAGI is under $100k (phasing out to $0 by $150k); unused losses carry forward. On sale, claimed depreciation is recaptured at up to 25%, and gains may owe capital-gains tax (a 1031 exchange can defer both). Figures are a year-1 estimate at your 24.0% rate — not tax advice; consult a CPA.
Schools (NCES district)
- District
- Baltimore City Public Schools
- NCES district ID
- 2400090
- Math proficiency
- 7% ▼ -9.00%
- Reading proficiency
- 16% ▼ -5.00%
- Median HH income
- $42,108
- Composite
- 10.08/100
- National rank
- #9805
- State rank
- #24 of 24 in MD
Livability — Baltimore
- Score
- 76/100
- State rank
- #90
- US rank
- #3396
Category grades
Schools grade is shown separately in the Schools card above.
Census & demographics
- Census place
- Baltimore, MD
- City population
- 61,566
- Population (ZIP)
- 6,593
Population outlook (Baltimore County) Hauer SSP2
- Today (2025)
- 624,249 people
- By 2030
- 621,541 · -0.4%
- By 2040
- 609,756 · -2.3%
- By 2050
- 597,249 · -4.3%
- By 2075
- 552,236 · -11.5%
- By 2100
- 513,934 · -17.7%
Race, ethnicity, and origin ACS 2023
- Neighborhood character
- Diverse neighborhood (Simpson 0.61)
- Race & ethnicity
- White 59% Black 18% Two or more races 13% Hispanic / Latino 8% Asian 4%
- Hispanic origin (detail)
- Mexican 4% Puerto Rican 3%
- Common ancestry
- Slovak 7% Romanian 2% Scotch-Irish 1%
- Foreign-born
- 7% · Canada, Jamaica
- Languages at home
- 91% English-only · Spanish 7% Tagalog/Filipino 1% Other Indo-European 1%
Political lean MEDSL · Baltimore
- 2024 margin
- Solid D (+73.0) · D 85.2% · R 12.2% · Other 2.6%
- 2008→2024 swing
- -2.5pp toward R · 2008: 75.5pp · 2024: 73.0pp
- All cycles
- 2024: D+73.0 2020: D+76.6 2016: D+74.6 2012: D+76.4 2008: D+75.5
Not yet ingested
- Civics
- —
Market trends
- HPI YoY
- ▲ 7.75%
- Current HPI
- 318.79
- Rent YoY
- —
- Metro
- —
- State GDP YoY
- ▲ 2.97%
- F500 in state
- 12
Industry mix (Fortune 500 HQ in MD)
| Industry | F500 HQs | Revenue |
|---|---|---|
| Aerospace / Defense | 1 | $71B |
|
||
| Utilities | 1 | $25B |
|
||
| Hotels | 1 | $24B |
|
||
| Consumer Goods | 1 | $7B |
|
||
| Real Estate | 1 | $6B |
|
||
| Chemicals | 1 | $2B |
|
||
Price history
-30.1% since first listed20 events — show timeline
- 2026-05-13 Pending — BRIGHT MLS
- 2026-05-01 Price Changed $30,000 BRIGHT MLS
- 2026-04-16 Price Changed $35,000 BRIGHT MLS
- 2026-04-06 Listed $42,500 BRIGHT MLS
- 2026-04-05 Coming Soon $42,500 BRIGHT MLS
- 2025-03-04 Sold (MLS) $36,000 BRIGHT MLS
- 2025-02-08 Relisted — BRIGHT MLS
- 2025-01-31 Listing Removed — BRIGHT MLS
- 2025-01-27 Relisted — BRIGHT MLS
- 2025-01-15 Listing Removed — BRIGHT MLS
- 2024-10-14 Listed $74,900 BRIGHT MLS
- 2024-06-30 Listing Removed — BRIGHT MLS
- 2024-01-31 Listed $74,900 BRIGHT MLS
- 2024-01-10 Coming Soon — BRIGHT MLS
- 2023-10-31 Listing Removed — BRIGHT MLS
- 2023-10-04 Price Changed $79,999 BRIGHT MLS
- 2023-09-28 Listed $85,000 BRIGHT MLS
- 2023-09-19 Listing Removed — BRIGHT MLS
- 2023-09-18 Listed $84,999 BRIGHT MLS
- 2004-07-12 Sold (Public Records) $42,900 Public Records
Property tax history
+0.4%/yrLatest (2025): $1,334 · +30.9% YoY. Source: county tax records.
Cash-flow waterfall
monthlySold comps — $/sqft
last 12 mo · ≤1 miLoading sold comps…