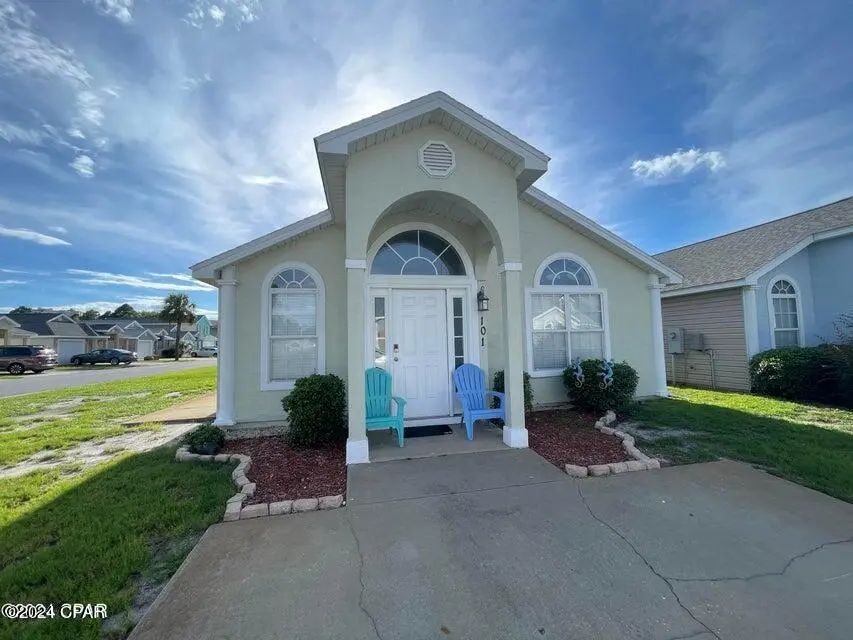
101 Seagrass Way · Panama City Beach, FL
Flood risk 1/10 · Minimal
- FEMA flood zone
- X (unshaded)
- Chance of flooding over 30 yrs
- 0.0%
- Est. flood insurance / yr
- $507 – $1,088
Fire risk 5/10 · Moderate
- Est. fire insurance / yr
- $947 – $1,759
Heat risk 10/10 · Severe
- Hot days now (above 105°F)
- 7 days/yr
- Hot days in 30 yrs
- 22 days/yr
Wind risk 9/10 · Severe
- Chance of severe wind over 30 yrs
- 99.0%
Air-quality risk 1/10 · Minimal
- Unhealthy air days now
- 0 days/yr
- Unhealthy air days in 30 yrs
- 0 days/yr
Risk factors via First Street. Map © Google.
Why this score? — see what drove the C- grade
The composite is a weighted blend of 9 inputs, each scored 0–100. Each bar is that input's sub-score; the figure is the points it added to the 100-point composite (weight × sub-score).
- Cash flow +15.4/30.0
- ARV discount +14.2/15.0
- DSCR +4.7/10.0
- Schools +4.3/10.0
- Livability +3.9/5.0
- 1% rule +3.8/10.0
- Condition / age +2.5/5.0
- Rent growth +2.4/5.0
- Appreciation +0.0/10.0
$285,000
🖨 Deal sheet (PDF) 📄 Offer letter ✓ Due diligence
Listing remarks MLS
Well Maintained, updated, 3/2 home is perfect beach home for any investor looking for long term or vacation rental, vacation/weekend getaway or any one looking for a primary home close to the beach! Palm Cove Subdivision offers 2 community pools & playground, also close enough to golf cart to the beach & amenities. All info taken from appraiser site & sizes approx. , please verify, if important.
Key facts
- Close to amenities
- Community pools
- Close to beach
Tags
Neighborhood map
What this means for you Summary
Snapshot
- This is a 3-bed/2.0-bath single-family listed at $285k.
Deal economics
- At list price, monthly cash flow is $107 ($1k/yr) — positive.
- The deal already cash-flows at list — no discount required.
- To meet the 1% rule (rent ≥ 1% of price), the offer needs to be $251k (12.0% below list).
- Recommended offer: $251k (12.0% below list) — sets the bar for 1% rule.
- Cap rate 6.7% vs local median 2.6% in Panama City Beach — top-decile yield for the area; either an underpriced asset or a hidden risk that comps aren't pricing in. Stress-test before assuming the spread holds.
Location & tenants
- Location reads 78/100 on livability (#172 in FL, #2,624 nationally) — a middle-class / working-renter tenant base. Strengths: crime A+, housing A+, health & safety A+; Watch: amenities D-, commute F.
- Bay (suburban): math 51% / reading 51% proficiency, ranked #29 of 73 in FL (top 40%) — acceptable for families but not a draw, mixed tenant base, ~2y average lease.
- Market conditions: Rents soft (-0.2%/yr); 705 active listings in the ZIP; 21 comparable units currently listed for rent nearby; rentals at typical pace (median 15d on market — plan ~3-4 weeks tenant-placement turnaround); solid renter incomes; 2,473 units permitted in Bay County in 2024 (559 in 5+ unit buildings).
- This rent runs 37% of the median local income ($81k/yr) — at the standard rent-burdened threshold; future hikes will face affordability resistance.
Forward outlook
- Local home prices are declining (-3.0%/yr); year-one equity from $2k of loan paydown is wiped out by about $9k of value loss. Plan a longer hold.
- Bay County population projected at +24% by 2050 — long-run rental-demand tailwind backs the buy-and-hold thesis.
Negotiation context
- It's been on market 114 days — a 9% lower offer ($259k) is reasonable based on typical stale-listing flexibility.
- 5 sale attempts since 8y ago; this cycle's ask has dropped $29k (9%) from the opening price — seller is motivated, your offer sets the floor, not the list.
- Current owner paid $166k; list at $285k implies a 72% gain — meaningful room to come down on a strong offer.
Risks & watch-outs
- Climate carrying-cost: severe wind risk, 99% chance of damaging wind over 30y; moderate wildfire risk; extreme-heat days projected 7→22/yr by 2055 (HVAC capex compounding) — expect insurance premiums to compound above CPI over the hold.
Questions for the listing agent
- It's been on market 114 days. Have you received any prior offers? Is the seller open to a 12% concession, seller financing, or rate buy-down credit?
- Why hasn't it sold? Are there any deal-killer items the seller is aware of (foundation, flood, title, zoning, code violations)?
- Is there a deadline driving the sale (1031 exchange, divorce, estate, relocation)? That informs how much negotiation room exists.
- Schools are B-rated — typically a magnet for longer-tenancy family renters. What's the average tenant stay here, and is there a school-zone premium baked into asking?
- What's the average days-on-market for RENTAL listings here right now (not sales)? A rising rental-DOM trend means longer vacancies and softer asking-rent achievability than the comps imply.
- What's the recent tenant-quality profile in this submarket — average credit score on applications, eviction rate, late-payment / NSF rate, and stable-employment percentage? A property-management company in the area should have these aggregated.
- How much new for-sale + rental construction is in the pipeline within 1–3 miles? Heavy new supply typically softens prices + rents 12–24 months out; constrained supply supports both.
Investment metrics
- 1% rule
- 0.88% ✗
- Cap rate
- 6.74%
- Cash-on-cash
- 1.61%
- DSCR
- 1.07
- GRM
- 9.5
CMA / ARV
- ARV (median comp)
- $334,510
- List price
- $285,000
- Delta
- -14.80%
- Verdict
- UNDERPRICED
- Comps
- 20 within 1.0 mi
Show comp detail 12 sales within ~0.75 mi
| Address | Dist | Beds/Ba | Sqft | Sold | Price | $/sf | Match |
|---|---|---|---|---|---|---|---|
| 11739 Sand Castle Ln | 0.10mi | 3/2.0 | 1,197 (0%) | 2mo | $319,000 | $266 | 94 |
| 121 Seagrass Way | 0.05mi | 3/2.0 | 1,183 (-1%) | 8mo | $280,000 | $237 | 90 |
| 11729 Sand Castle Ln | 0.10mi | 3/2.0 | 1,197 (0%) | 7mo | $318,000 | $266 | 90 |
| 220 Coquina Shell Way | 0.21mi | 3/2.0 | 1,190 (-1%) | 1mo | $295,000 | $248 | 88 |
| 205 Emerald Coast Club Blvd | 0.23mi | 3/2.0 | 1,197 (0%) | 4mo | $280,000 | $234 | 86 |
| 206 Seahorse Way | 0.15mi | 2/2.0 (-1) | 1,197 (0%) | 3mo | $250,000 | $209 | 86 |
| 220 Emerald Coast Club Blvd | 0.24mi | 3/2.0 | 1,190 (-1%) | 5mo | $270,000 | $227 | 84 |
| 122 White Cap Way | 0.13mi | 3/2.0 | 1,092 (-9%) | 3mo | $290,000 | $266 | 76 |
| 207 Coquina Shell Way | 0.20mi | 3/2.0 | 1,269 (+6%) | 7mo | $343,000 | $270 | 75 |
| 11822 Sand Dune Dr | 0.28mi | 3/2.0 | 1,272 (+6%) | 3mo | $352,000 | $277 | 74 |
| 108 Beacon Ln | 0.03mi | 3/2.0 | 1,348 (+13%) | 5mo | $250,000 | $185 | 74 |
| 11705 Cabana Ct | 0.15mi | 3/2.0 | 1,351 (+13%) | 3mo | $351,000 | $260 | 69 |
Match score weights: distance 35% · size 25% · config 20% · recency 20%. Top-matched comps best support the ARV.
Projected returns pro-forma
-3.0% appreciation · 0.0% rent growth · sell at horizon
- IRR
- -17.0%
- Equity multiple
- 0.41×
- Total profit
- $-46,733
- Equity at exit
- $42,494
- IRR
- -15.4%
- Equity multiple
- 0.24×
- Total profit
- $-60,405
- Equity at exit
- $24,642
Cash invested: $79,800 (down + closing). Projections, not guarantees.
Landlord ↔ Tenant lean methodology
- Overall (STATE)
- 87 Strongly Landlord-Friendly
- State Florida
- 87 Strongly Landlord-Friendly · R+3
- County
- — inherits STATE
- City
- — inherits STATE
ZIP-level market 32407
- Home prices YoY
- -29.5%
- Rents YoY
- -0.2%
- Active inventory
- 705
- Price-to-rent
- 9.5×
Monthly cashflow live
- Estimated rent
- $2,509 high interval (Pro) →
- Mortgage (P&I)
- −$1,495
- Tax from tax record
- −$261 /mo · $3,138/yr
- Insurance
- −$119
- HOA
- −$0
- Vacancy / Maint / Mgmt
- −$527
- Net cashflow
- $107
Break-even live
Sensitivity live
| Price | -10% $268 | -5% $188 | +0% $107 | +5% $26 | +10% $-54 |
|---|---|---|---|---|---|
| Rent | -10% $-91 | -5% $8 | +0% $107 | +5% $206 | +10% $305 |
| Rate | -1.0pp $251 | -0.5pp $180 | base $107 | +0.5pp $33 | +1.0pp $-42 |
UW: 25.0% down · 7.5% · 30yr · 1.5% tax · 5.0% vac · 8.0% maint · 8.0% mgmt
Financing live
Cash to close
- Down payment
- $71,250
- Closing costs
- $8,550
- Reserves months
- —
- Total cash needed
- —
Loan-product check · same deal, 3 products live
Conventional
25% down · 7.5% · 30yr
- Down + closing
- —
- Monthly P&I
- —
- Monthly cashflow
- —
- DSCR
- —
- Eligible?
- —
Personal DTI + credit; lowest rate.
DSCR
20% down · 8.5% · 30yr
- Down + closing
- —
- Monthly P&I
- —
- Monthly cashflow
- —
- DSCR
- —
- Eligible?
- —
No personal income docs; deal must DSCR.
Hard money
10% down · 12.0% · 12mo
- Down + closing
- —
- Monthly P&I
- —
- Monthly cashflow
- —
- DSCR
- —
- Eligible?
- —
Short-term bridge; refi at stabilization.
Rent comps 21 comps
| Address | Beds | Baths | Sqft | Rent | $/sqft | DOM | Units | Dist |
|---|---|---|---|---|---|---|---|---|
| 175 White Cap Way Unit 1 Panama City Beach, FL | 3.0 | 2.5 | 1432 | $1,750 | $1.22 | 14d | 1 | 0.09mi |
| 11222 Hutchison Blvd Unit 1523347P Panama City Beach, FL | 2.0 | 2.0 | 1194 | $3,907 | $3.27 | 22d | 1 | 0.12mi |
| 104 White Cap Way Panama City Beach, FL | 3.0 | 2.0 | 1146 | $2,700 | $2.36 | 22d | 1 | 0.12mi |
| 11709 Seashore Ln Panama City Beach, FL | 3.0 | 2.0 | 1269 | $2,300 | $1.81 | 14d | 1 | 0.16mi |
| 520 N Richard Jackson Blvd #1912 Panama City Beach, FL | 2.0 | 2.0 | 1200 | $2,375 | $1.98 | 14d | 1 | 0.31mi |
| 98 Paddock Club Dr Panama City Beach, FL | 1.0–3.0 | 1.0–2.0 | 1093 | $2,063 | $1.89 | 14d | 19 | 0.31mi |
| 800 Grand Panama Blvd Panama City Beach, FL | 3.0 | 1.0–2.0 | 978 | $2,699 | $2.76 | 14d | 30 | 0.36mi |
| 138 Bonnie Ln Panama City Beach, FL | 2.0 | 1.5 | 972 | $1,599 | $1.65 | 14d | 1 | 0.51mi |
| 136 Bonnie Ln Panama City Beach, FL | 2.0 | 1.5 | 972 | $1,750 | $1.80 | 14d | 1 | 0.51mi |
| 302 Cabana Blvd Panama City Beach, FL | 1.0–3.0 | 1.0–2.0 | 1184 | $1,806 | $1.53 | 14d | 15 | 0.59mi |
| 133 W Leslie Ln Unit 1 Panama City Beach, FL | 2.0 | 1.5 | 950 | $2,200 | $2.32 | 22d | 1 | 0.63mi |
| 12011 Front Beach Rd Unit 1523327P Panama City Beach, FL | 2.0 | 2.0 | 1076 | $3,796 | $3.53 | 14d | 1 | 0.64mi |
| 10400 Panama City Beach Pkwy Panama City Beach, FL | 1.0–3.0 | 1.0–2.0 | 1151 | $2,372 | $2.06 | 14d | 20 | 0.83mi |
| 10811 Front Beach Rd Unit 1354928P Panama City Beach, FL | 3.0 | 2.0 | 1194 | $3,463 | $2.90 | 14d | 1 | 0.86mi |
| 10625 Front Beach Rd Unit 1354975P Panama City Beach, FL | 2.0 | 2.0 | 1140 | $3,166 | $2.78 | 14d | 1 | 0.99mi |
| 204 Potters Bluff Dr Panama City Beach, FL | 1.0–3.0 | 1.0–2.0 | 1035 | $1,947 | $1.88 | 14d | 12 | 1.09mi |
| 104 Gulfside Ct Unit 1523320P Panama City Beach, FL | 3.0 | 3.0 | 1496 | $5,020 | $3.36 | 14d | 1 | 1.25mi |
| 998 Gulfside Ct Unit 1523366P Panama City Beach, FL | 2.0 | 2.0 | 1065 | $4,124 | $3.87 | 14d | 1 | 1.26mi |
| 9815 S Thomas Dr Unit 1523339P Panama City, FL | 3.0 | 2.0 | 1259 | $4,018 | $3.19 | 22d | 1 | 1.29mi |
| 9902 S Thomas Dr Unit 1354966P Panama City Beach, FL | 2.0 | 2.0 | 1259 | $1,970 | $1.56 | 14d | 1 | 1.37mi |
| 900 Clara Ave Panama City Beach, FL | 1.0–3.0 | 1.0–2.0 | 1134 | $2,175 | $1.92 | 14d | 15 | 1.46mi |
Listing history 31 events
-
2026-06-21days on market $285,000 Active 114 DOM
-
2026-06-19days on market $285,000 Active 112 DOM
-
2026-06-18days on market $285,000 Active 111 DOM
-
2026-06-17days on market $285,000 Active 110 DOM
-
2026-06-16days on market $285,000 Active 109 DOM
-
2026-06-15days on market $285,000 Active 108 DOM
-
2026-06-14days on market $285,000 Active 106 DOM
-
2026-06-13days on market $285,000 Active 105 DOM
-
2026-06-10days on market $285,000 Active 103 DOM
-
2026-06-09days on market $285,000 Active 102 DOM
-
2026-06-08days on market $285,000 Active 101 DOM
-
2026-06-07days on market $285,000 Active 100 DOM
-
2026-06-05days on market $285,000 Active 97 DOM
-
2026-06-03days on market $285,000 Active 96 DOM
-
2026-06-02days on market $285,000 Active 95 DOM
-
2026-06-01days on market $285,000 Active 94 DOM
-
2026-05-31days on market $285,000 Active 93 DOM
-
2026-05-30days on market $285,000 Active 92 DOM
-
2026-04-24price $290,000 417-char remark
Show marketing remark (417 chars)
Well Maintained, updated, 3/2 home is perfect beach home for any investor looking for long term or vacation rental, vacation/weekend getaway or any one looking for a primary home close to the beach! Palm Cove Subdivision offers 2 community pools & playground, also close enough to golf cart to the beach & amenities. All info taken from appraiser site & sizes approx. , please verify, if important.
-
2026-04-11price $300,000 417-char remark
Show marketing remark (417 chars)
Well Maintained, updated, 3/2 home is perfect beach home for any investor looking for long term or vacation rental, vacation/weekend getaway or any one looking for a primary home close to the beach! Palm Cove Subdivision offers 2 community pools & playground, also close enough to golf cart to the beach & amenities. All info taken from appraiser site & sizes approx. , please verify, if important.
-
2026-03-16price $309,000 417-char remark
Show marketing remark (417 chars)
Well Maintained, updated, 3/2 home is perfect beach home for any investor looking for long term or vacation rental, vacation/weekend getaway or any one looking for a primary home close to the beach! Palm Cove Subdivision offers 2 community pools & playground, also close enough to golf cart to the beach & amenities. All info taken from appraiser site & sizes approx. , please verify, if important.
-
2026-02-24$314,000 Active 417-char remark
Show marketing remark (417 chars)
Well Maintained, updated, 3/2 home is perfect beach home for any investor looking for long term or vacation rental, vacation/weekend getaway or any one looking for a primary home close to the beach! Palm Cove Subdivision offers 2 community pools & playground, also close enough to golf cart to the beach & amenities. All info taken from appraiser site & sizes approx. , please verify, if important.
-
2024-12-01historical
-
2024-10-18historical $2,300
-
2024-10-11$325,000 Active
-
2024-09-20price $2,300
-
2024-08-24$2,500
-
2024-02-15historical $2,400
-
2023-11-15$2,400
-
2018-10-05soldstatus $165,500
-
2018-08-21$169,900
ⓘ Source: listings_history table (triggers on properties + properties_extension) + one-shot
backfill from property_details.listing_events for pre-trigger history.
Tax reassessment forecast FL · Resets to sale price
- Current annual tax
- $3,138 · $261/mo
- Projected year-2 tax
- $3,138 · $261/mo
- Expected delta
- $0/yr ($0/mo · 0.0%)
ⓘ Screening estimate from a state-policy table — verify with the county assessor before closing.
Climate risk First Street
- Flood 1/10 Low FEMA zone X (unshaded) · 0% chance over 30 yrs
- Wildfire 5/10 Major
- Heat 10/10 Extreme 7 d/yr ≥105°F today · 22 d/yr by 30 yrs out
- Wind 9/10 Extreme 99% chance of damaging wind over 30 yrs
- Air quality 1/10 Low 0 unhealthy d/yr today · 0 by 30 yrs out
Nearby sold comps map
Loading sold comps map…
Walkable amenities ~0.75 mi
Loading nearby amenities…
Taxation est. · year 1
- Rental income
- $30,105
- − Mortgage interest
- −$15,964
- − Property taxes
- −$3,138
- − Insurance
- −$1,425
- − Repairs & maintenance
- −$2,408
- − Management
- −$2,408
- − Depreciation
- −$8,291
- Taxable loss
- −$3,530
- Est. tax savings @ 24.0%
- +$847
- After-tax cash flow
- $2,133/yr
For passive investors: Depreciation is non-cash, so a rental often shows a tax loss while cash-flowing — sheltering income. Rental losses are passive: they offset passive income freely, and up to $25,000/yr can offset ordinary (W-2) income if you actively participate and your MAGI is under $100k (phasing out to $0 by $150k); unused losses carry forward. On sale, claimed depreciation is recaptured at up to 25%, and gains may owe capital-gains tax (a 1031 exchange can defer both). Figures are a year-1 estimate at your 24.0% rate — not tax advice; consult a CPA.
Schools (NCES district)
- District
- Bay
- NCES district ID
- 1200090
- Math proficiency
- 51% ▼ -8.00%
- Reading proficiency
- 51% ▼ -7.00%
- Median HH income
- $47,740
- Composite
- 43.41/100
- National rank
- #3014
- State rank
- #29 of 73 in FL
Livability — Panama City Beach
- Score
- 78/100
- State rank
- #172
- US rank
- #2624
Category grades
Schools grade is shown separately in the Schools card above.
Census & demographics
- County
- Bay County · 163,593 people
- City population
- 50,689
- Metro
- Panama City, FL
- Population (ZIP)
- 16,404
- Household income
- $80,831
- Rent vs Own
- Severe rent burden
- 939.0
Population outlook (Bay County) Hauer SSP2
- Today (2025)
- 206,264 people
- By 2030
- 217,740 · +5.6%
- By 2040
- 238,738 · +15.7%
- By 2050
- 255,545 · +23.9%
- By 2075
- 288,295 · +39.8%
- By 2100
- 288,638 · +39.9%
Race, ethnicity, and origin ACS 2023
- Neighborhood character
- Predominantly White (73%)
- Race & ethnicity
- White 73% Black 10% Two or more races 9% Hispanic / Latino 8% Asian 2%
- Hispanic origin (detail)
- Mexican 2% Puerto Rican 2%
- Common ancestry
- Lithuanian 4% Italian 3% Portuguese 2%
- Foreign-born
- 12% · Canada, Jamaica, South Korea
- Languages at home
- 89% English-only · Spanish 6% Other Indo-European 1% Russian/Polish/Slavic 1%
Political lean MEDSL · Bay
- 2024 margin
- Solid R (+47.4) · D 25.8% · R 73.1% · Other 1.1%
- 2008→2024 swing
- -6.6pp toward R · 2008: -40.7pp · 2024: -47.4pp
- All cycles
- 2024: R+47.4 2020: R+43.5 2016: R+46.3 2012: R+43.6 2008: R+40.7
Not yet ingested
- Civics
- —
Market trends
- HPI YoY
- ▼ -116.39%
- Current HPI
- 277.8875
- Rent YoY
- ▼ -0.25%
- Metro
- Panama City, FL
- State GDP YoY
- ▲ 3.28%
- F500 in state
- 36
Industry mix (Fortune 500 HQ in FL)
| Industry | F500 HQs | Revenue |
|---|---|---|
| Industrial Technology | 2 | $29B |
|
||
| Insurance | 2 | $17B |
|
||
| Retail | 1 | $60B |
|
||
| Technology Distribution | 1 | $58B |
|
||
| Homebuilding | 1 | $35B |
|
||
| Technology Manufacturing | 1 | $35B |
|
||
Price history
+70.7% since first listed13 events — show timeline
- 2026-04-24 Price Changed $290,000 CPARMLS
- 2026-04-11 Price Changed $300,000 CPARMLS
- 2026-03-16 Price Changed $309,000 CPARMLS
- 2026-02-24 Listed $314,000 CPARMLS
- 2024-12-01 Listing Removed — CPARMLS
- 2024-10-18 Rental Removed $2,300 APPFOLIO
- 2024-10-11 Listed $325,000 CPARMLS
- 2024-09-20 Price Changed $2,300 APPFOLIO
- 2024-08-24 Listed for Rent $2,500 APPFOLIO
- 2024-02-15 Rental Removed $2,400 RENT.
- 2023-11-15 Listed for Rent $2,400 RENT.
- 2018-10-05 Sold (MLS) $165,500 CPARMLS
- 2018-08-21 Listed $169,900 CPARMLS
Property tax history
+8.9%/yrLatest (2025): $3,138 · +6.9% YoY. Source: county tax records.
Cash-flow waterfall
monthlySold comps — $/sqft
last 12 mo · ≤1 miLoading sold comps…