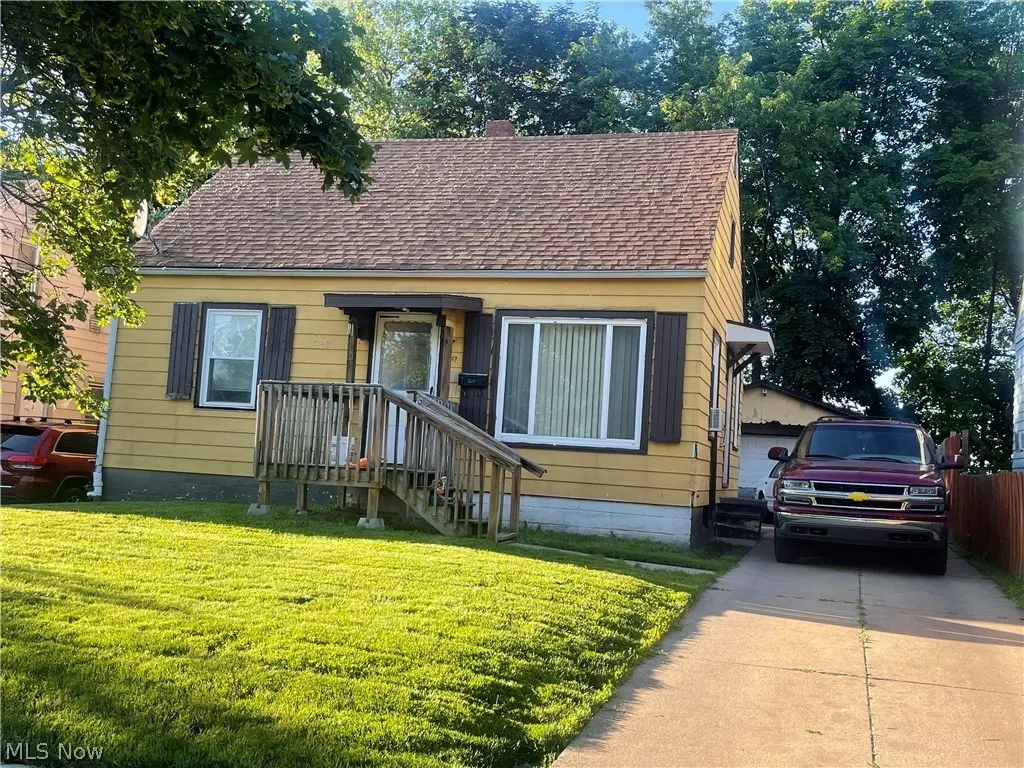
317 Stanton Ave · Akron, OH
Flood risk 1/10 · Minimal
- FEMA flood zone
- X (unshaded)
- Chance of flooding over 30 yrs
- 0.0%
- Est. flood insurance / yr
- $473 – $860
Fire risk 1/10 · Minimal
- Est. fire insurance / yr
- $713 – $1,323
Heat risk 3/10 · Minor
- Hot days now (above 96°F)
- 7 days/yr
- Hot days in 30 yrs
- 17 days/yr
Wind risk 1/10 · Minimal
- Chance of severe wind over 30 yrs
- —
Air-quality risk 3/10 · Minor
- Unhealthy air days now
- 2 days/yr
- Unhealthy air days in 30 yrs
- 4 days/yr
Risk factors via First Street. Map © Google.
Why this score? — see what drove the B+ grade
The composite is a weighted blend of 9 inputs, each scored 0–100. Each bar is that input's sub-score; the figure is the points it added to the 100-point composite (weight × sub-score).
- Cash flow +30.0/30.0
- ARV discount +15.0/15.0
- 1% rule +10.0/10.0
- DSCR +10.0/10.0
- Livability +4.0/5.0
- Rent growth +3.7/5.0
- Condition / age +2.5/5.0
- Schools +2.1/10.0
- Appreciation +0.0/10.0
$77,000
🖨 Deal sheet 📄 Offer letter ✓ Due diligence
Listing remarks
SELLING AS A PACKAGE ONLY WITH 1354 ARNOLD AVE, AKRON, OH (MLS 5213287) AND 2330 16TH ST SW, AKRON, OH (MLS 5213284)!!!! Come get your turn-key investment properties priced to sell to add to your existing portfolio or start your venture into rentals! Properties are in easy-to-rent Akron neighborhoods. All are within a 10 minute or less commute to major area hospitals, the University of Akron, and Stark State College Akron. Each home is currently tenant occupied. 317 Stanton Ave features 3 bedrooms, 1 bathroom, a full basement, and a single car garage. 1354 Arnold Ave features 2 bedrooms, 1 bathroom, a full basement, and a single car garage. 2330 16th St SW features 2 bedrooms, 1 bathro
Key facts
- 3,781 sq ft lot
- Garage
- Built 1947
Property features AI
Finance
- Financial info: Annual taxes reported: $835 (2025)
Exterior
- Parking: Detached 1-car garage; Driveway with concrete apron
- Utilities: Public water; Public sewer
- Home design: Single-family property; 941 above-grade finished area
- Construction: Aluminum siding; Asphalt shingle roof; Built as recorded in public records
- Exterior features: City lot
Interior
- Bedrooms: 2 bedrooms on the main level
- Bathrooms: 1 full bathroom on the main level
- Heating & cooling: Forced air heating; Gas heating
- Interior features: Full basement
- Laundry & utility: Laundry in basement
Neighborhood map
What this means for you Summary
Snapshot
- This is a 3-bed/1.0-bath single-family listed at $77k.
Deal economics
- At list price, monthly cash flow is $395 ($5k/yr) — positive.
- The deal already cash-flows at list — no discount required.
- Meets the 1% rule at list price ($1k rent vs $77k).
- Cap rate 12.4% vs local median 6.6% in Akron — top-decile yield for the area; either an underpriced asset or a hidden risk that comps aren't pricing in. Stress-test before assuming the spread holds.
Location & tenants
- Location reads 81/100 on livability (#104 in OH, #1,591 nationally) — a professional / high-income tenant draw. Strengths: amenities A+, commute A+, cost of living A+; Watch: crime F, employment F.
- Akron City (urban): math 22% / reading 30% proficiency, ranked #602 of 656 in OH (top 92%) — low school quality limits family demand, transient renter base, plan for 1-2y turnover; 66% free/reduced lunch — lower-income household profile, screen leases tightly.
- Market conditions: Rents rising fast (+4.6%/yr); 83 active listings in the ZIP; 40 comparable units currently listed for rent nearby; rentals at typical pace (median 23d on market — plan ~3-4 weeks tenant-placement turnaround); 48% of comp listings sitting > 30 days — soft ceiling on asking rent; 1,114 units permitted in Summit County in 2024 (397 in 5+ unit buildings).
Forward outlook
- Local home prices are declining (-3.0%/yr); year-one equity from $532 of loan paydown is wiped out by about $2k of value loss. Plan a longer hold.
- Summit County population projected to shrink 6% by 2050 — rents likely to lag national; underwrite the cash flow, not the appreciation.
- At projected returns (-3.0% appreciation + 4.6% rent growth), your $22k cash investment doubles in ~6 years — after that, you're playing with house money.
Negotiation context
- Only 10 days on market — expect competitive offers; lowballing is unlikely to land.
- 6 sale attempts since 31y ago with the ask held roughly flat each time — persistent listings suggest the price (not the market) is what's stuck; bring a comps-based counter.
Risks & watch-outs
- Watch-outs: built in 1947 — expect roof / HVAC / electrical / plumbing capex.
Questions for the listing agent
- Built in 1947 — when were the roof, HVAC, electrical panel, plumbing, and water heater last replaced?
- Is there a deadline driving the sale (1031 exchange, divorce, estate, relocation)? That informs how much negotiation room exists.
- Crime grade is F in this area — have there been break-ins, vandalism, or insurance claims at this property in the last 3 years? What carrier currently insures it and at what premium?
- What's the average days-on-market for RENTAL listings here right now (not sales)? A rising rental-DOM trend means longer vacancies and softer asking-rent achievability than the comps imply.
- What's the recent tenant-quality profile in this submarket — average credit score on applications, eviction rate, late-payment / NSF rate, and stable-employment percentage? A property-management company in the area should have these aggregated.
- How much new for-sale + rental construction is in the pipeline within 1–3 miles? Heavy new supply typically softens prices + rents 12–24 months out; constrained supply supports both.
Investment metrics
- 1% rule
- 1.52% ✓
- Cap rate
- 12.45%
- Cash-on-cash
- 21.99%
- DSCR
- 1.98
- GRM
- 5.5
CMA / ARV
- ARV (on-the-fly)
- $93,159
- Comps found
- 12
Show comp detail 12 sales within ~0.75 mi
| Address | Dist | Beds/Ba | Sqft | Sold | Price | $/sf | Match |
|---|---|---|---|---|---|---|---|
| 1133 Bellows St | 0.11mi | 3/1.0 | 933 (-1%) | 2mo | $110,000 | $118 | 92 |
| 1100 Beardsley St | 0.23mi | 3/1.0 | 1,075 (+14%) | 2mo | $107,000 | $100 | 64 |
| 912 Ashland Ave | 0.39mi | 2/1.0 (-1) | 864 (-8%) | 1mo | $87,000 | $101 | 62 |
| 791 Allyn St | 0.59mi | 3/1.0 | 992 (+5%) | 4mo | $85,000 | $86 | 60 |
| 147 Brighton Dr | 0.44mi | 3/1.0 | 1,040 (+10%) | 2mo | $100,000 | $96 | 60 |
| 526 Clifford Ave | 0.59mi | 2/1.0 (-1) | 978 (+4%) | 2mo | $132,000 | $135 | 60 |
| 129 E Emerling Ave | 0.43mi | 3/1.0 | 1,039 (+10%) | 6mo | $40,000 | $38 | 57 |
| 1239 Lily St | 0.44mi | 2/1.0 (-1) | 846 (-10%) | 6mo | $66,800 | $79 | 53 |
| 1243 Dietz Ave | 0.58mi | 2/1.0 (-1) | 1,024 (+9%) | 2mo | $90,000 | $88 | 52 |
| 106 E Emerling Ave | 0.47mi | 3/2.0 | 1,047 (+11%) | 6mo | $39,900 | $38 | 50 |
| 1137 Herberich Ave | 0.54mi | 2/1.0 (-1) | 816 (-13%) | 2mo | $115,575 | $142 | 46 |
| 1263 Herberich Ave | 0.64mi | 3/1.5 | 1,076 (+14%) | 2mo | $107,000 | $99 | 42 |
Match score weights: distance 35% · size 25% · config 20% · recency 20%. Top-matched comps best support the ARV.
Projected returns pro-forma
-3.0% appreciation · 4.62% rent growth · sell at horizon
- IRR
- 16.5%
- Equity multiple
- 1.68×
- Total profit
- $14,638
- Equity at exit
- $11,481
- IRR
- 26.2%
- Equity multiple
- 3.48×
- Total profit
- $53,437
- Equity at exit
- $6,658
Cash invested: $21,560 (down + closing). Projections, not guarantees.
Landlord ↔ Tenant lean methodology
- Overall (STATE)
- 73 Landlord-Friendly
- State Ohio
- 73 Landlord-Friendly · R+6
- County
- — inherits STATE
- City
- — inherits STATE
ZIP-level market 44301
- Home prices YoY
- -25.7%
- Rents YoY
- 4.6%
- Active inventory
- 83
- Price-to-rent
- 5.5×
Monthly cashflow live
- Estimated rent
- $1,171 high interval (Pro) →
- Mortgage (P&I)
- −$404
- Tax from tax record
- −$94 /mo · $1,132/yr
- Insurance
- −$32
- HOA
- −$0
- Vacancy / Maint / Mgmt
- −$246
- Net cashflow
- $395
Break-even live
UW: 25.0% down · 7.5% · 30yr · 1.5% tax · 5.0% vac · 8.0% maint · 8.0% mgmt
Financing live
Cash to close
- Down payment
- $19,250
- Closing costs
- $2,310
- Reserves months
- —
- Total cash needed
- —
Loan-product check · same deal, 3 products live
Conventional
25% down · 7.5% · 30yr
- Down + closing
- —
- Monthly P&I
- —
- Monthly cashflow
- —
- DSCR
- —
- Eligible?
- —
Personal DTI + credit; lowest rate.
DSCR
20% down · 8.5% · 30yr
- Down + closing
- —
- Monthly P&I
- —
- Monthly cashflow
- —
- DSCR
- —
- Eligible?
- —
No personal income docs; deal must DSCR.
Hard money
10% down · 12.0% · 12mo
- Down + closing
- —
- Monthly P&I
- —
- Monthly cashflow
- —
- DSCR
- —
- Eligible?
- —
Short-term bridge; refi at stabilization.
Rent comps 40 comps
| Address | Beds | Baths | Sqft | Rent | $/sqft | DOM | Units | Dist |
|---|---|---|---|---|---|---|---|---|
| 147 Brighton Dr Akron, OH | 3.0 | 1.0 | 1040 | $1,350 | $1.30 | 23d | 1 | 0.43mi |
| 94 Brighton Dr Akron, OH | 3.0 | 1.0 | 1000 | $1,100 | $1.10 | 43d | 1 | 0.51mi |
| 45 E Emerling Ave Unit F Akron, OH | 2.0 | 1.0 | 850 | $795 | $0.94 | 43d | 1 | 0.53mi |
| 67 E Archwood Ave Unit A Akron, OH | 2.0 | 1.0 | 1000 | $850 | $0.85 | 43d | 1 | 0.55mi |
| 46 Brighton Dr Akron, OH | 2.0 | 1.0 | 850 | $1,100 | $1.29 | 43d | 1 | 0.57mi |
| 1036 Neptune Ave Akron, OH | 3.0 | 1.0 | 1000 | $1,350 | $1.35 | 43d | 1 | 0.57mi |
| 1102 Neptune Ave Akron, OH | 3.0 | 1.0 | 1000 | $1,200 | $1.20 | 43d | 1 | 0.59mi |
| 58 E Archwood Ave Akron, OH | 2.0 | 1.0 | 750 | $850 | $1.13 | 43d | 1 | 0.60mi |
| 629 Morgan Ave Akron, OH | 2.0 | 1.0 | 960 | $1,200 | $1.25 | 43d | 1 | 0.64mi |
| 374 E Voris St Akron, OH | 3.0 | 1.0 | 876 | $1,150 | $1.31 | 23d | 1 | 0.78mi |
| 689 Kling St Akron, OH | 3.0 | 1.0 | 780 | $1,075 | $1.38 | 21d | 1 | 0.80mi |
| 662 Sumner St Akron, OH | 2.0 | 1.0 | 915 | $999 | $1.09 | 43d | 1 | 0.86mi |
| 658 Sumner St Akron, OH | 2.0 | 1.0 | 915 | $999 | $1.09 | 43d | 1 | 0.87mi |
| 1313 Coventry St Akron, OH | 2.0 | 1.0 | 913 | $1,250 | $1.37 | 14d | 1 | 0.88mi |
| 600 Sherman St Akron, OH | 4.0 | 1.0–2.0 | 824 | $1,400 | $1.70 | 14d | 14 | 0.95mi |
| 393 Cross St Unit 393 Akron, OH | 2.0 | 1.0 | 864 | $775 | $0.90 | 43d | 1 | 1.06mi |
| 1204 Inman St Akron, OH | 3.0 | 1.0 | 1080 | $1,200 | $1.11 | 23d | 1 | 1.06mi |
| 484 Hammel St Akron, OH | 2.0 | 1.0 | 792 | $1,100 | $1.39 | 43d | 1 | 1.13mi |
| 505 Rentschler St Unit Down Akron, OH | 2.0 | 1.0 | 825 | $850 | $1.03 | 14d | 1 | 1.15mi |
| 418 Power St Akron, OH | 3.0 | 1.0 | 1000 | $999 | $1.00 | 23d | 1 | 1.16mi |
| 902 Cole Ave Akron, OH | 3.0 | 1.0 | 984 | $1,050 | $1.07 | 14d | 1 | 1.17mi |
| 864 Wyley Ave Akron, OH | 2.0 | 1.0 | 800 | $1,500 | $1.88 | 43d | 1 | 1.18mi |
| 420 Power St Akron, OH | 3.0 | 1.0 | 900 | $800 | $0.89 | 23d | 1 | 1.18mi |
| 621 Hudson Ave Akron, OH | 3.0 | 1.0 | 780 | $1,100 | $1.41 | 14d | 1 | 1.18mi |
| 467 Spicer St Akron, OH | 2.0 | 1.0 | 800 | $915 | $1.14 | 23d | 1 | 1.20mi |
| 461 Spicer St Akron, OH | 3.0 | 2.0 | 1000 | $995 | $0.99 | 43d | 1 | 1.21mi |
| 470 Sumner St Unit 2 Akron, OH | 2.0 | 1.0 | 560 | $900 | $1.61 | 23d | 1 | 1.22mi |
| 764 Lindsay Ave Akron, OH | 3.0 | 1.0 | 1000 | $1,295 | $1.29 | 14d | 1 | 1.23mi |
| 195 Wheeler St Apt 301 Akron, OH | 2.0 | 1.0 | 600 | $750 | $1.25 | 43d | 1 | 1.24mi |
| 287 Wheeler St Akron, OH | 3.0 | 1.0 | 1100 | $1,350 | $1.23 | 23d | 1 | 1.26mi |
| 437 Sumner St Apt D Akron, OH | 2.0 | 1.5 | 750 | $900 | $1.20 | 23d | 1 | 1.27mi |
| 437 Sumner St Apt R Akron, OH | 2.0 | 1.5 | 600 | $500 | $0.83 | 23d | 1 | 1.27mi |
| 437 Sumner St Apt A Akron, OH | 3.0 | 1.5 | 750 | $1,200 | $1.60 | 23d | 1 | 1.27mi |
| 437 Sumner St Apt T Akron, OH | 3.0 | 1.5 | 600 | $960 | $1.60 | 23d | 1 | 1.27mi |
| 437 Sumner St Apt P Akron, OH | 3.0 | 1.5 | 600 | $750 | $1.25 | 23d | 1 | 1.27mi |
| 421 Allyn St Unit 2 Akron, OH | 3.0 | 1.0 | 743 | $850 | $1.14 | 43d | 1 | 1.28mi |
| 972 Concord Ave Akron, OH | 2.0 | 1.0 | 720 | $1,173 | $1.63 | 43d | 1 | 1.31mi |
| 406 Sumner St Akron, OH | 2.0–4.0 | 1.0–2.0 | 836 | $1,085 | $1.30 | 14d | 3 | 1.32mi |
| 530 S Main St Akron, OH | 1.0–2.0 | 1.0–2.0 | 937 | $2,195 | $2.34 | 43d | 2 | 1.33mi |
| 1005 Pardee Ave Akron, OH | 2.0 | 1.0 | 862 | $1,025 | $1.19 | 43d | 1 | 1.34mi |
Listing history 10 events
-
2026-06-09status $77,000 Pending 10 DOM
-
2026-06-08days on market $77,000 Active 10 DOM
-
2026-06-07days on market $77,000 Active 9 DOM
-
2026-06-05days on market $77,000 Active 6 DOM
-
2026-06-03days on market $77,000 Active 5 DOM
-
2026-06-02days on market $77,000 Active 4 DOM
-
2026-06-01days on market $77,000 Active 3 DOM
-
2026-05-31days on market $77,000 Active 2 DOM
-
2026-05-31remarks 699-char remark
-
2026-05-31$77,000 Active 1 DOM
ⓘ Source: listings_history table (triggers on properties + properties_extension) + one-shot
backfill from property_details.listing_events for pre-trigger history.
Tax reassessment forecast OH · Partial reset (capped growth)
- Current annual tax
- $1,132 · $94/mo
- Projected year-2 tax
- $1,167 · $97/mo
- Expected delta
- +$35/yr (+$3/mo · 3.0%)
ⓘ Screening estimate from a state-policy table — verify with the county assessor before closing.
Climate risk First Street
- Flood 1/10 Low FEMA zone X (unshaded) · 0% chance over 30 yrs
- Wildfire 1/10 Low
- Heat 3/10 Moderate 7 d/yr ≥96°F today · 17 d/yr by 30 yrs out
- Wind 1/10 Low
- Air quality 3/10 Moderate 2 unhealthy d/yr today · 4 by 30 yrs out
Nearby sold comps map
Loading sold comps map…
Walkable amenities ~0.75 mi
Loading nearby amenities…
Taxation est. · year 1
- Rental income
- $14,054
- − Mortgage interest
- −$4,313
- − Property taxes
- −$1,132
- − Insurance
- −$385
- − Repairs & maintenance
- −$1,124
- − Management
- −$1,124
- − Depreciation
- −$2,240
- Taxable income
- $3,735
- Est. tax owed @ 24.0%
- −$896
- After-tax cash flow
- $3,844/yr
For passive investors: Depreciation is non-cash, so a rental often shows a tax loss while cash-flowing — sheltering income. Rental losses are passive: they offset passive income freely, and up to $25,000/yr can offset ordinary (W-2) income if you actively participate and your MAGI is under $100k (phasing out to $0 by $150k); unused losses carry forward. On sale, claimed depreciation is recaptured at up to 25%, and gains may owe capital-gains tax (a 1031 exchange can defer both). Figures are a year-1 estimate at your 24.0% rate — not tax advice; consult a CPA.
Schools (NCES district)
- District
- Akron City
- NCES district ID
- 3904348
- Math proficiency
- 22% ▼ -17.00%
- Reading proficiency
- 30% ▼ -12.00%
- Median HH income
- $33,811
- Composite
- 21.31/100
- National rank
- #8383
- State rank
- #602 of 656 in OH
Livability — Akron
- Score
- 81/100
- State rank
- #104
- US rank
- #1591
Category grades
Schools grade is shown separately in the Schools card above.
Census & demographics
- Census place
- Akron, OH
- County
- Summit County · 440,783 people
- City population
- 174,375
- Metro
- Akron, OH
- Population (ZIP)
- 13,668
- Household income
- $51,321
- Rent vs Own
- Severe rent burden
- 446.0
Population outlook (Summit County) Hauer SSP2
- Today (2025)
- 546,583 people
- By 2030
- 544,028 · -0.5%
- By 2040
- 531,363 · -2.8%
- By 2050
- 514,923 · -5.8%
- By 2075
- 481,765 · -11.9%
- By 2100
- 432,265 · -20.9%
Race, ethnicity, and origin ACS 2023
- Neighborhood character
- Diverse neighborhood (Simpson 0.63)
- Race & ethnicity
- White 52% Black 30% Two or more races 11% Hispanic / Latino 5% Asian 2%
- Hispanic origin (detail)
- Mexican 3%
- Common ancestry
- Romanian 4% Lithuanian 2% Serbian 1%
- Foreign-born
- 6% · Canada
- Languages at home
- 92% English-only · Spanish 4% Other Indo-European 1% Other Asian/Pacific 1%
Political lean MEDSL · Summit
- 2024 margin
- Lean D (+7.0) · D 53.0% · R 46.0%
- 2008→2024 swing
- -9.6pp toward R · 2008: 16.6pp · 2024: 7.0pp
- All cycles
- 2024: D+7.0 2020: D+9.6 2016: D+8.2 2012: D+14.8 2008: D+16.6
Not yet ingested
- Civics
- —
Market trends
- HPI YoY
- ▼ -74.09%
- Current HPI
- 213.697
- Rent YoY
- ▲ 4.62%
- Metro
- Akron, OH
- State GDP YoY
- ▲ 1.98%
- F500 in state
- 48
Industry mix (Fortune 500 HQ in OH)
| Industry | F500 HQs | Revenue |
|---|---|---|
| Insurance | 3 | $145B |
|
||
| Industrial Machinery | 3 | $49B |
|
||
| Financial Services | 3 | $24B |
|
||
| Consumer Goods | 2 | $93B |
|
||
| Aerospace / Defense | 2 | $47B |
|
||
| Utilities | 2 | $33B |
|
||
Price history
+45.6% since first listed12 events — show timeline
- 2026-05-29 Listed $77,000 MLSNOW
- 2019-07-26 Sold (Public Records) $140,000 Public Records
- 2007-08-28 Listing Removed — MLSNOW
- 2006-09-20 Listing Removed — MLSNOW
- 2006-08-29 Listed $24,900 MLSNOW
- 2006-03-20 Listed $45,900 MLSNOW
- 1996-07-10 Listing Removed — MLSNOW
- 1996-04-10 Listed $52,900 MLSNOW
- 1996-03-14 Listing Removed — MLSNOW
- 1996-03-01 Listing Removed — MLSNOW
- 1996-02-16 Listed $54,900 MLSNOW
- 1995-09-01 Listed $52,900 MLSNOW
Property tax history
+15.5%/yrLatest (2025): $1,132 · +46.7% YoY. Source: county tax records.
Cash-flow waterfall
monthlySold comps — $/sqft
last 12 mo · ≤1 miLoading sold comps…