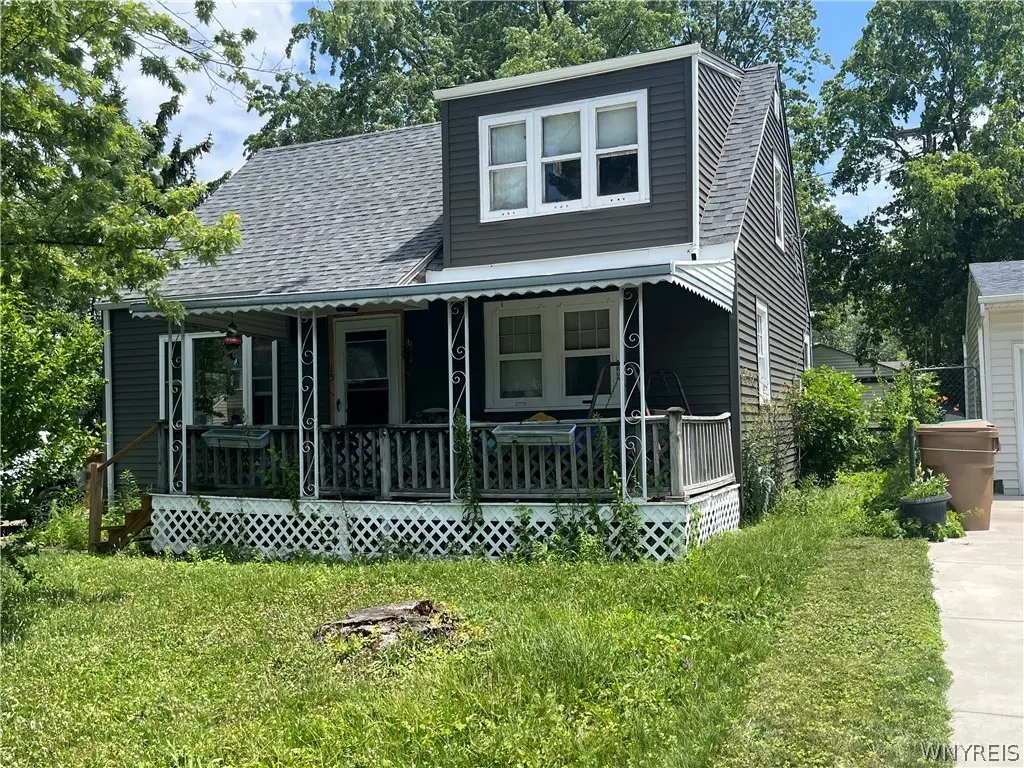
15 Allendale Rd · Cheektowaga, NY
Flood risk 4/10 · Minor
- FEMA flood zone
- X (unshaded)
- Chance of flooding over 30 yrs
- 0.2%
- Est. flood insurance / yr
- $473 – $860
Fire risk 1/10 · Minimal
- Est. fire insurance / yr
- $691 – $1,283
Heat risk 3/10 · Minor
- Hot days now (above 93°F)
- 7 days/yr
- Hot days in 30 yrs
- 15 days/yr
Wind risk 1/10 · Minimal
- Chance of severe wind over 30 yrs
- —
Air-quality risk 3/10 · Minor
- Unhealthy air days now
- 2 days/yr
- Unhealthy air days in 30 yrs
- 3 days/yr
Risk factors via First Street. Map © Google.
Why this score? — see what drove the B+ grade
The composite is a weighted blend of 9 inputs, each scored 0–100. Each bar is that input's sub-score; the figure is the points it added to the 100-point composite (weight × sub-score).
- Cash flow +30.0/30.0
- ARV discount +15.0/15.0
- 1% rule +10.0/10.0
- DSCR +10.0/10.0
- Livability +4.2/5.0
- Schools +3.8/10.0
- Rent growth +2.7/5.0
- Condition / age +2.5/5.0
- Appreciation +0.0/10.0
$89,900
🖨 Deal sheet (PDF) 📄 Offer letter ✓ Due diligence
Listing remarks
4 Bed Room Cape Cod on very nice Street, Roof approximately 6 years old, Circuit Breakers, fenced rear yard, vacant for easy showings, House being Sold in its present "AS-IS' Condition. Offers due Tuesday, April 7, 2026 at 1:00 pm.
Key facts
- 4,792 sq ft lot
- Built 1943
- Listed 8 days
Neighborhood map
What this means for you Summary
Snapshot
- This is a 3-bed/1.0-bath single-family listed at $90k.
Deal economics
- At list price, monthly cash flow is $484 ($6k/yr) — positive.
- The deal already cash-flows at list — no discount required.
- Meets the 1% rule at list price ($1k rent vs $90k).
- Cap rate 12.7% vs local median 3.8% in Cheektowaga — top-decile yield for the area; either an underpriced asset or a hidden risk that comps aren't pricing in. Stress-test before assuming the spread holds.
Location & tenants
- Location reads 84/100 on livability (#54 in NY, #811 nationally) — a professional / high-income tenant draw. Strengths: commute A+, housing A+, health & safety A+; Watch: crime C-.
- Cleveland Hill Union Free School District (urban): math 42% / reading 46% proficiency, ranked #468 of 590 in NY (top 79%) — families likely to look elsewhere, expect single-tenant / working-renter base with shorter leases.
- Market conditions: Rents flat; 239 active listings in the ZIP; 17 comparable units currently listed for rent nearby; rentals at typical pace (median 25d on market — plan ~3-4 weeks tenant-placement turnaround); 47% of comp listings sitting > 30 days — soft ceiling on asking rent; lower-income renter base — watch delinquency; 1,244 units permitted in Erie County in 2024 (563 in 5+ unit buildings).
- This rent runs 37% of the median local income ($45k/yr) — at the standard rent-burdened threshold; future hikes will face affordability resistance.
Forward outlook
- Local home prices are declining (-3.0%/yr); year-one equity from $622 of loan paydown is wiped out by about $3k of value loss. Plan a longer hold.
- At projected returns (-3.0% appreciation + 0.7% rent growth), your $25k cash investment doubles in ~7 years — after that, you're playing with house money.
Negotiation context
- Only 8 days on market — expect competitive offers; lowballing is unlikely to land.
- 2 sale attempts with the ask held roughly flat each time — persistent listings suggest the price (not the market) is what's stuck; bring a comps-based counter.
Risks & watch-outs
- Watch-outs: built in 1943 — expect roof / HVAC / electrical / plumbing capex.
Questions for the listing agent
- Built in 1943 — when were the roof, HVAC, electrical panel, plumbing, and water heater last replaced?
- Is there a deadline driving the sale (1031 exchange, divorce, estate, relocation)? That informs how much negotiation room exists.
- Schools are B-rated — typically a magnet for longer-tenancy family renters. What's the average tenant stay here, and is there a school-zone premium baked into asking?
- What's the average days-on-market for RENTAL listings here right now (not sales)? A rising rental-DOM trend means longer vacancies and softer asking-rent achievability than the comps imply.
- What's the recent tenant-quality profile in this submarket — average credit score on applications, eviction rate, late-payment / NSF rate, and stable-employment percentage? A property-management company in the area should have these aggregated.
- How much new for-sale + rental construction is in the pipeline within 1–3 miles? Heavy new supply typically softens prices + rents 12–24 months out; constrained supply supports both.
Investment metrics
- 1% rule
- 1.56% ✓
- Cap rate
- 12.75%
- Cash-on-cash
- 23.06%
- DSCR
- 2.03
- GRM
- 5.4
CMA / ARV
- ARV (on-the-fly)
- $175,032
- Comps found
- 12
Show comp detail 12 sales within ~0.75 mi
| Address | Dist | Beds/Ba | Sqft | Sold | Price | $/sf | Match |
|---|---|---|---|---|---|---|---|
| 358 Hastings Ave | 0.36mi | 3/1.0 | 1,152 (+3%) | 2mo | $128,500 | $112 | 78 |
| 19 Allendale Rd | 0.01mi | 4/1.0 (+1) | 990 (-12%) | 1mo | $165,000 | $167 | 74 |
| 322 Phyllis Ave | 0.43mi | 2/1.0 (-1) | 1,098 (-2%) | 0mo | $175,000 | $159 | 71 |
| 492 Hewitt Ave | 0.47mi | 3/1.0 | 1,065 (-5%) | 2mo | $241,000 | $226 | 68 |
| 99 Fennimore Ave | 0.57mi | 3/1.0 | 1,100 (-2%) | 3mo | $115,000 | $105 | 68 |
| 223 Phyllis Ave | 0.56mi | 3/1.0 | 1,082 (-4%) | 0mo | $68,500 | $63 | 68 |
| 2 Campwood Ct | 0.55mi | 2/1.5 (-1) | 1,070 (-5%) | 1mo | $271,350 | $254 | 59 |
| 695 Mount Vernon Rd | 0.60mi | 3/1.5 | 1,220 (+9%) | 1mo | $250,000 | $205 | 55 |
| 601 Lasalle Ave | 0.67mi | 4/1.0 (+1) | 1,188 (+6%) | 1mo | $165,000 | $139 | 53 |
| 496 Berkshire Ave | 0.64mi | 3/1.0 | 1,266 (+13%) | 1mo | $125,000 | $99 | 48 |
| 84 Fennimore Ave | 0.58mi | 3/1.0 | 961 (-14%) | 1mo | $149,900 | $156 | 48 |
| 622 Lasalle Ave | 0.64mi | 4/1.0 (+1) | 1,258 (+12%) | 3mo | $115,000 | $91 | 43 |
Match score weights: distance 35% · size 25% · config 20% · recency 20%. Top-matched comps best support the ARV.
Projected returns pro-forma
-3.0% appreciation · 0.67% rent growth · sell at horizon
- IRR
- 13.4%
- Equity multiple
- 1.52×
- Total profit
- $13,053
- Equity at exit
- $13,404
- IRR
- 20.4%
- Equity multiple
- 2.53×
- Total profit
- $38,567
- Equity at exit
- $7,773
Cash invested: $25,172 (down + closing). Projections, not guarantees.
Landlord ↔ Tenant lean methodology
- Overall (STATE)
- 15 Strongly Tenant-Friendly
- State New York
- 15 Strongly Tenant-Friendly · D+10
- County
- — inherits STATE
- City
- — inherits STATE
ZIP-level market 14215
- Home prices YoY
- -30.0%
- Rents YoY
- 0.7%
- Active inventory
- 239
- Price-to-rent
- 5.4×
Monthly cashflow live
- Estimated rent
- $1,399 high interval (Pro) →
- Mortgage (P&I)
- −$471
- Tax est. 1.5%
- −$112 /mo · $1,348/yr
- Insurance
- −$37
- HOA
- −$0
- Vacancy / Maint / Mgmt
- −$294
- Net cashflow
- $484
Break-even live
Sensitivity live
| Price | -10% $546 | -5% $515 | +0% $484 | +5% $453 | +10% $422 |
|---|---|---|---|---|---|
| Rent | -10% $373 | -5% $428 | +0% $484 | +5% $539 | +10% $594 |
| Rate | -1.0pp $529 | -0.5pp $507 | base $484 | +0.5pp $460 | +1.0pp $437 |
UW: 25.0% down · 7.5% · 30yr · 1.5% tax · 5.0% vac · 8.0% maint · 8.0% mgmt
Financing live
Cash to close
- Down payment
- $22,475
- Closing costs
- $2,697
- Reserves months
- —
- Total cash needed
- —
Loan-product check · same deal, 3 products live
Conventional
25% down · 7.5% · 30yr
- Down + closing
- —
- Monthly P&I
- —
- Monthly cashflow
- —
- DSCR
- —
- Eligible?
- —
Personal DTI + credit; lowest rate.
DSCR
20% down · 8.5% · 30yr
- Down + closing
- —
- Monthly P&I
- —
- Monthly cashflow
- —
- DSCR
- —
- Eligible?
- —
No personal income docs; deal must DSCR.
Hard money
10% down · 12.0% · 12mo
- Down + closing
- —
- Monthly P&I
- —
- Monthly cashflow
- —
- DSCR
- —
- Eligible?
- —
Short-term bridge; refi at stabilization.
Rent comps 17 comps
| Address | Beds | Baths | Sqft | Rent | $/sqft | DOM | Units | Dist |
|---|---|---|---|---|---|---|---|---|
| 189 Westminster Ave Buffalo, NY | 4.0 | 1.5 | 1065 | $1,595 | $1.50 | 11d | 1 | 0.52mi |
| 44 Aurora Dr Buffalo, NY | 3.0 | 1.0 | 1272 | $3,300 | $2.59 | 3d | 1 | 0.60mi |
| 97 Davidson Ave Buffalo, NY | 3.0 | 1.0 | 925 | $1,495 | $1.62 | 3d | 1 | 0.71mi |
| 507 Lisbon Ave Unit 2 Buffalo, NY | 2.0 | 1.0 | 850 | $1,050 | $1.24 | 45d | 1 | 0.74mi |
| 220 Dartmouth Ave Buffalo, NY | 2.0 | 1.0 | 1000 | $1,100 | $1.10 | 25d | 1 | 0.98mi |
| 103 Preston Rd Unit Lower Cheektowaga, NY | 2.0 | 1.0 | 882 | $1,300 | $1.47 | 4d | 1 | 1.05mi |
| 4035-4055 Harlem Rd Unit 4081B Buffalo, NY | 2.0 | 1.0 | 815 | $1,649 | $2.02 | 3d | 1 | 1.12mi |
| 265 Lisbon Ave Unit 2 Buffalo, NY | 3.0 | 1.0 | 1200 | $1,400 | $1.17 | 45d | 1 | 1.18mi |
| 263 Minnesota Ave Unit Upper Buffalo, NY | 3.0 | 1.0 | 1242 | $1,500 | $1.21 | 15d | 1 | 1.21mi |
| 160 Courtland Ave Buffalo, NY | 2.0 | 1.0 | 810 | $1,025 | $1.27 | 15d | 1 | 1.25mi |
| 140 Parkridge Ave Buffalo, NY | 3.0 | 1.0 | 990 | $1,500 | $1.52 | 45d | 1 | 1.27mi |
| 222 Lisbon Ave Unit Upper Buffalo, NY | 3.0 | 1.0 | 1400 | $1,400 | $1.00 | 45d | 1 | 1.28mi |
| 222 Lisbon Ave Buffalo, NY | 4.0 | 1.0 | 1300 | $1,400 | $1.08 | 25d | 1 | 1.28mi |
| 17 Proctor Ave Unit 1 Buffalo, NY | 2.0 | 1.0 | 900 | $1,100 | $1.22 | 45d | 1 | 1.29mi |
| 74 Dorris Ave Buffalo, NY | 3.0 | 1.0 | 1200 | $1,450 | $1.21 | 45d | 1 | 1.38mi |
| 61 Courtland Ave Unit Lower Buffalo, NY | 2.0 | 1.0 | 1000 | $1,300 | $1.30 | 45d | 1 | 1.45mi |
| 249 Newburgh Ave Unit 2 Buffalo, NY | 2.0 | 1.0 | 930 | $1,300 | $1.40 | 45d | 1 | 1.46mi |
Listing history 5 events
-
2026-04-08status Pending
-
2026-03-30$89,900 Active
-
2025-07-17status Pending
-
2025-07-16historical
-
2025-07-07$65,000 Active
ⓘ Source: listings_history table (triggers on properties + properties_extension) + one-shot
backfill from property_details.listing_events for pre-trigger history.
Climate risk First Street
- Flood 4/10 Moderate FEMA zone X (unshaded) · 20% chance over 30 yrs
- Wildfire 1/10 Low
- Heat 3/10 Moderate 7 d/yr ≥93°F today · 15 d/yr by 30 yrs out
- Wind 1/10 Low
- Air quality 3/10 Moderate 2 unhealthy d/yr today · 3 by 30 yrs out
Nearby sold comps map
Loading sold comps map…
Walkable amenities ~0.75 mi
Loading nearby amenities…
Taxation est. · year 1
- Rental income
- $16,784
- − Mortgage interest
- −$5,036
- − Property taxes
- −$1,348
- − Insurance
- −$450
- − Repairs & maintenance
- −$1,343
- − Management
- −$1,343
- − Depreciation
- −$2,615
- Taxable income
- $4,649
- Est. tax owed @ 24.0%
- −$1,116
- After-tax cash flow
- $4,688/yr
For passive investors: Depreciation is non-cash, so a rental often shows a tax loss while cash-flowing — sheltering income. Rental losses are passive: they offset passive income freely, and up to $25,000/yr can offset ordinary (W-2) income if you actively participate and your MAGI is under $100k (phasing out to $0 by $150k); unused losses carry forward. On sale, claimed depreciation is recaptured at up to 25%, and gains may owe capital-gains tax (a 1031 exchange can defer both). Figures are a year-1 estimate at your 24.0% rate — not tax advice; consult a CPA.
Schools (NCES district)
- District
- Cleveland Hill Union Free School District
- NCES district ID
- 3607680
- Math proficiency
- 42% ▼ -15.00%
- Reading proficiency
- 46% ▼ -9.00%
- Median HH income
- $50,785
- Composite
- 37.87/100
- National rank
- #4323
- State rank
- #468 of 590 in NY
Livability — Cheektowaga
- Score
- 84/100
- State rank
- #54
- US rank
- #811
Category grades
Schools grade is shown separately in the Schools card above.
Census & demographics
- Census place
- Cheektowaga, NY
- County
- Erie County · 714,559 people
- City population
- 55,470
- Metro
- Buffalo-Cheektowaga, NY
- Population (ZIP)
- 42,524
- Household income
- $44,955
- Rent vs Own
- Severe rent burden
- 2873.0
Population outlook (Erie County) Hauer SSP2
- Today (2025)
- 933,037 people
- By 2030
- 935,181 · +0.2%
- By 2040
- 928,531 · -0.5%
- By 2050
- 905,725 · -2.9%
- By 2075
- 834,037 · -10.6%
- By 2100
- 708,033 · -24.1%
Race, ethnicity, and origin ACS 2023
- Neighborhood character
- Predominantly Black (67%)
- Race & ethnicity
- Black 67% White 15% Asian 7% Hispanic / Latino 6% Two or more races 6%
- Hispanic origin (detail)
- Puerto Rican 4%
- Common ancestry
- Romanian 4% Lithuanian 1% Italian 1%
- Foreign-born
- 9% · Canada, China
- Languages at home
- 88% English-only · Other Indo-European 4% Spanish 4% Chinese 1%
Political lean MEDSL · Erie
- 2024 margin
- Lean D (+9.7) · D 54.8% · R 45.2%
- 2008→2024 swing
- -7.9pp toward R · 2008: 17.5pp · 2024: 9.7pp
- All cycles
- 2024: D+9.7 2020: D+14.7 2016: D+4.8 2012: D+15.6 2008: D+17.5
Not yet ingested
- Civics
- —
Market trends
- HPI YoY
- ▼ -126.29%
- Current HPI
- 295.2966
- Rent YoY
- ▲ 0.67%
- Metro
- Buffalo-Cheektowaga, NY
- State GDP YoY
- ▲ 2.60%
- F500 in state
- 92
Industry mix (Fortune 500 HQ in NY)
| Industry | F500 HQs | Revenue |
|---|---|---|
| Financial Services | 10 | $950B |
|
||
| Consumer Goods | 9 | $162B |
|
||
| Insurance | 4 | $225B |
|
||
| Telecommunications | 2 | $144B |
|
||
| Pharmaceuticals | 2 | $112B |
|
||
| Media / Entertainment | 2 | $69B |
|
||
Price history
+38.3% since first listed5 events — show timeline
- 2026-04-08 Pending — WNYREIS
- 2026-03-30 Listed $89,900 WNYREIS
- 2025-07-17 Pending — WNYREIS
- 2025-07-16 Listing Removed — WNYREIS
- 2025-07-07 Listed $65,000 WNYREIS
Property tax history
+5.2%/yrLatest (2025): $5,122 · +1.0% YoY. Source: county tax records.
Cash-flow waterfall
monthlySold comps — $/sqft
last 12 mo · ≤1 miLoading sold comps…