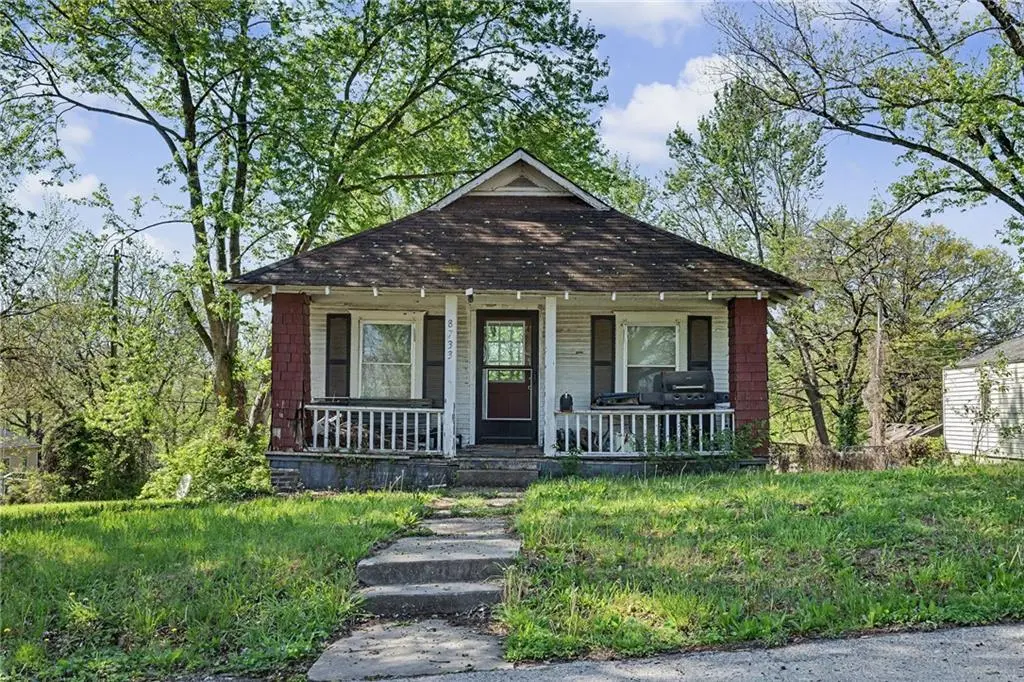
8733 E Saint John Ave · Independence, MO
Flood risk 1/10 · Minimal
- FEMA flood zone
- X (unshaded)
- Chance of flooding over 30 yrs
- 0.0%
- Est. flood insurance / yr
- $473 – $860
Fire risk 2/10 · Minimal
- Est. fire insurance / yr
- $1,054 – $1,958
Heat risk 4/10 · Minor
- Hot days now (above 107°F)
- 7 days/yr
- Hot days in 30 yrs
- 16 days/yr
Wind risk 2/10 · Minimal
- Chance of severe wind over 30 yrs
- —
Air-quality risk 3/10 · Minor
- Unhealthy air days now
- 2 days/yr
- Unhealthy air days in 30 yrs
- 3 days/yr
Risk factors via First Street. Map © Google.
Why this score? — see what drove the B- grade
The composite is a weighted blend of 9 inputs, each scored 0–100. Each bar is that input's sub-score; the figure is the points it added to the 100-point composite (weight × sub-score).
- Cash flow +28.0/30.0
- Appreciation +10.0/10.0
- DSCR +9.9/10.0
- 1% rule +6.8/10.0
- Livability +4.1/5.0
- ARV discount +3.4/15.0
- Schools +2.7/10.0
- Rent growth +2.5/5.0
- Condition / age +2.5/5.0
$88,500
🖨 Deal sheet (PDF) 📄 Offer letter ✓ Due diligence
Listing remarks
This home is one of eleven properties being offered as part of a unique investment portfolio opportunity. All MLS numbers are listed below, and buyers have the flexibility to purchase properties individually or bundle multiple homes together. This property is currently tenant occupied, so showings are unavailable or will be very limited. Being sold as-is, the goal is to maintain the current tenant and provide a seamless transition for investors seeking an established, income-producing property. Please reach out to Nate Longwell with questions, offers, or additional information. MLS NUMBERS: 2620321, 2620316, 2620313, 2620307, 2620302, 2620301, 2620297, 2620292, 2620225, 2620222, 2620202
Key facts
- 7,003 sq ft lot
- Built 1912
- Listed 37 days
Property features AI
Finance
- Financial info: Annual tax: $588
Exterior
- Parking: Off-street parking
- Utilities: City/Public water (verify)
- Home design: Single-family residence; Residential property
- Construction: Frame construction; Composition roof; About 101+ years old
- Exterior features: Lot approximately 7,003 square feet
Interior
- Bedrooms: 2 bedrooms
- Bathrooms: 1 full bathroom
- Heating & cooling: Other heating; Electric cooling
- Interior features: Ranch floor plan; Basement (other)
Neighborhood map
What this means for you Summary
Snapshot
- This is a 2-bed/1.0-bath single-family listed at $88k.
Deal economics
- At list price, monthly cash flow is $274 ($3k/yr) — positive.
- The deal already cash-flows at list — no discount required.
- Meets the 1% rule at list price ($1k rent vs $88k).
- Recommended offer: $86k (3.0% below list) — sets the bar for market timing.
- Cap rate 10.0% vs local median 5.0% in Independence — top-decile yield for the area; either an underpriced asset or a hidden risk that comps aren't pricing in. Stress-test before assuming the spread holds.
Location & tenants
- Location reads 82/100 on livability (#10 in MO, #1,296 nationally) — a professional / high-income tenant draw. Strengths: amenities A+, commute A+, cost of living A+; Watch: employment D+, crime F.
- Independence 30 (suburban): math 26% / reading 38% proficiency, ranked #252 of 324 in MO (top 78%) — families likely to look elsewhere, expect single-tenant / working-renter base with shorter leases.
- Zoned schools: Fairmount Elem. (math 27% / reading 37%, grade F, #761 of 1,115 statewide, top 72%, 312 students, 82% FRL); Clifford H. Nowlin Middle (math 13% / reading 29%, grade F, #342 of 391 statewide, top 88%, 875 students, 80% FRL); Van Horn High (math 13% / reading 27%, grade F, #472 of 521 statewide, top 91%, 1,047 students, 72% FRL) — zoned schools average 78% FRL vs 58% district-wide (20 pts higher); higher-poverty schools than district average — tighter screening recommended.
- Market conditions: 45 active listings in the ZIP; 12 comparable units currently listed for rent nearby; rentals at typical pace (median 26d on market — plan ~3-4 weeks tenant-placement turnaround); 42% of comp listings sitting > 30 days — soft ceiling on asking rent; 4,002 units permitted in Jackson County in 2024 (2,271 in 5+ unit buildings).
Forward outlook
- In year one you build about $9k of equity ($612 loan paydown + $9k appreciation (10.0% local appreciation)).
- Jackson County population projected at +4% by 2050 — modest demand growth; plan on rents tracking national, not racing it.
- At projected returns (10.0% appreciation + 3.0% rent growth), your $25k cash investment doubles in ~2 years — after that, you're playing with house money.
- By year 4, paydown + projected appreciation supports a ~$34k cash-out refi (75% LTV) — recoverable capital for the next deal without selling this one.
Negotiation context
- It's been on market 38 days — a 3% lower offer ($86k) is reasonable based on typical stale-listing flexibility.
- 2 sale attempts with the ask held roughly flat each time — persistent listings suggest the price (not the market) is what's stuck; bring a comps-based counter.
Risks & watch-outs
- Watch-outs: built in 1912 — expect roof / HVAC / electrical / plumbing capex.
Questions for the listing agent
- It's been on market 38 days. Have you received any prior offers? Is the seller open to a 3% concession, seller financing, or rate buy-down credit?
- Built in 1912 — when were the roof, HVAC, electrical panel, plumbing, and water heater last replaced?
- Is there a deadline driving the sale (1031 exchange, divorce, estate, relocation)? That informs how much negotiation room exists.
- Crime grade is F in this area — have there been break-ins, vandalism, or insurance claims at this property in the last 3 years? What carrier currently insures it and at what premium?
- What's the average days-on-market for RENTAL listings here right now (not sales)? A rising rental-DOM trend means longer vacancies and softer asking-rent achievability than the comps imply.
- What's the recent tenant-quality profile in this submarket — average credit score on applications, eviction rate, late-payment / NSF rate, and stable-employment percentage? A property-management company in the area should have these aggregated.
- How much new for-sale + rental construction is in the pipeline within 1–3 miles? Heavy new supply typically softens prices + rents 12–24 months out; constrained supply supports both.
Investment metrics
- 1% rule
- 1.18% ✓
- Cap rate
- 10.01%
- Cash-on-cash
- 13.27%
- DSCR
- 1.59
- GRM
- 7.1
CMA / ARV
- ARV (median comp)
- $81,117
- List price
- $88,500
- Delta
- 9.10%
- Verdict
- FAIR
- Comps
- 20 within 1.0 mi
Show comp detail 12 sales within ~0.75 mi
| Address | Dist | Beds/Ba | Sqft | Sold | Price | $/sf | Match |
|---|---|---|---|---|---|---|---|
| 8806 E Smart Ave | 0.29mi | 2/1.0 | 908 (-3%) | 6mo | $95,000 | $105 | 77 |
| 107 N Ditzler Ave | 0.50mi | 3/2.0 (+1) | 934 (+0%) | 2mo | $178,500 | $191 | 66 |
| 8908 E Thompson Ave | 0.40mi | 2/1.0 | 859 (-8%) | 5mo | $68,500 | $80 | 64 |
| 210 N Glenwood Ave | 0.67mi | 2/1.0 | 960 (+3%) | 0mo | $106,000 | $110 | 64 |
| 8907 E Smart Ave | 0.38mi | 3/1.0 (+1) | 936 (+0%) | 17mo | $115,000 | $123 | 62 |
| 125 S Brookside St | 0.56mi | 2/1.0 | 855 (-8%) | 4mo | $90,000 | $105 | 56 |
| 107 N Crescent Ave | 0.74mi | 2/1.0 | 942 (+1%) | 14mo | $142,750 | $152 | 52 |
| 578 S Oxford Ave | 0.74mi | 3/1.0 (+1) | 990 (+6%) | 2mo | $89,000 | $90 | 48 |
| 548 S Brookside Ave | 0.68mi | 2/1.0 | 875 (-6%) | 17mo | $45,000 | $51 | 44 |
| 8715 E Roberts St | 0.41mi | 3/1.5 (+1) | 1,056 (+13%) | 12mo | $20,000 | $19 | 42 |
| 526 S Brookside Ave | 0.63mi | 2/1.0 | 821 (-12%) | 14mo | $29,000 | $35 | 39 |
| 716 Lewis Ave | 0.58mi | 3/1.0 (+1) | 1,062 (+14%) | 8mo | $49,000 | $46 | 38 |
Match score weights: distance 35% · size 25% · config 20% · recency 20%. Top-matched comps best support the ARV.
Projected returns pro-forma
10.0% appreciation · 3.0% rent growth · sell at horizon
- IRR
- 34.0%
- Equity multiple
- 3.65×
- Total profit
- $65,633
- Equity at exit
- $79,728
- IRR
- 29.3%
- Equity multiple
- 8.24×
- Total profit
- $179,508
- Equity at exit
- $171,936
Cash invested: $24,780 (down + closing). Projections, not guarantees.
Landlord ↔ Tenant lean methodology
- Overall (STATE)
- 81 Strongly Landlord-Friendly
- State Missouri
- 81 Strongly Landlord-Friendly · R+10
- County
- — inherits STATE
- City
- — inherits STATE
ZIP-level market 64053
- Home prices YoY
- 17.9%
- Active inventory
- 45
- Price-to-rent
- 7.1×
Monthly cashflow live
- Estimated rent
- $1,043 high interval (Pro) →
- Mortgage (P&I)
- −$464
- Tax from tax record
- −$49 /mo · $588/yr
- Insurance
- −$37
- HOA
- −$0
- Vacancy / Maint / Mgmt
- −$219
- Net cashflow
- $274
Break-even live
Sensitivity live
| Price | -10% $324 | -5% $299 | +0% $274 | +5% $249 | +10% $224 |
|---|---|---|---|---|---|
| Rent | -10% $192 | -5% $233 | +0% $274 | +5% $315 | +10% $356 |
| Rate | -1.0pp $319 | -0.5pp $297 | base $274 | +0.5pp $251 | +1.0pp $228 |
UW: 25.0% down · 7.5% · 30yr · 1.5% tax · 5.0% vac · 8.0% maint · 8.0% mgmt
Financing live
Cash to close
- Down payment
- $22,125
- Closing costs
- $2,655
- Reserves months
- —
- Total cash needed
- —
Loan-product check · same deal, 3 products live
Conventional
25% down · 7.5% · 30yr
- Down + closing
- —
- Monthly P&I
- —
- Monthly cashflow
- —
- DSCR
- —
- Eligible?
- —
Personal DTI + credit; lowest rate.
DSCR
20% down · 8.5% · 30yr
- Down + closing
- —
- Monthly P&I
- —
- Monthly cashflow
- —
- DSCR
- —
- Eligible?
- —
No personal income docs; deal must DSCR.
Hard money
10% down · 12.0% · 12mo
- Down + closing
- —
- Monthly P&I
- —
- Monthly cashflow
- —
- DSCR
- —
- Eligible?
- —
Short-term bridge; refi at stabilization.
Rent comps 12 comps
| Address | Beds | Baths | Sqft | Rent | $/sqft | DOM | Units | Dist |
|---|---|---|---|---|---|---|---|---|
| 8705 E Smart Ave Independence, MO | 2.0 | 1.0 | 750 | $1,000 | $1.33 | 46d | 1 | 0.33mi |
| 576 S Oxford Ave Independence, MO | 3.0 | 2.0 | 1098 | $1,400 | $1.28 | 46d | 1 | 0.74mi |
| 578 S Oxford Ave Independence, MO | 3.0 | 1.0 | 990 | $1,400 | $1.41 | 0d | 1 | 0.75mi |
| 600 S Glenwood Ave Unit F Independence, MO | 2.0 | 1.0 | 750 | $995 | $1.33 | 22d | 1 | 0.82mi |
| 600 S Glenwood Ave Unit E Independence, MO | 1.0 | 1.0 | 600 | $725 | $1.21 | 46d | 1 | 0.83mi |
| 600 S Glenwood Ave Unit I Independence, MO | 1.0 | 1.0 | 700 | $695 | $0.99 | 46d | 1 | 0.83mi |
| 9528 E Winner Rd Independence, MO | 1.0–3.0 | 1.0 | 730 | $999 | $1.37 | 46d | 1 | 1.17mi |
| 303 N Huttig Ave Independence, MO | 2.0 | 1.0 | 640 | $1,200 | $1.88 | 0d | 1 | 1.20mi |
| 563 S Ash Ave Unit 3 Independence, MO | 2.0 | 1.0 | 650 | $950 | $1.46 | 4d | 1 | 1.32mi |
| 1601 Blue Ridge Blvd Independence, MO | 2.0 | 1.0 | 515 | $1,025 | $1.99 | 0d | 3 | 1.33mi |
| 611 Ewing Ave Unit B Kansas City, MO | 1.0 | 1.0 | 700 | $800 | $1.14 | 25d | 1 | 1.40mi |
| 611 Ewing Ave Unit A Kansas City, MO | 1.0 | 1.0 | 700 | $800 | $1.14 | 0d | 1 | 1.40mi |
Listing history 21 events
-
2026-06-21days on market $88,500 Active 38 DOM
-
2026-06-18days on market $88,500 Active 35 DOM
-
2026-06-17days on market $88,500 Active 34 DOM
-
2026-06-16days on market $88,500 Active 33 DOM
-
2026-06-15days on market $88,500 Active 32 DOM
-
2026-06-13days on market $88,500 Active 30 DOM
-
2026-06-09days on market $88,500 Active 26 DOM
-
2026-06-08days on market $88,500 Active 25 DOM
-
2026-06-07days on market $88,500 Active 24 DOM
-
2026-06-05days on market $88,500 Active 21 DOM
-
2026-06-03days on market $88,500 Active 20 DOM
-
2026-06-02days on market $88,500 Active 19 DOM
-
2026-06-01days on market $88,500 Active 18 DOM
-
2026-05-31days on market $88,500 Active 17 DOM
-
2026-05-15$88,500 Active 696-char remark
-
2026-05-15historical $88,500 696-char remark
-
2025-09-30historical
-
2025-06-20price $90,000
-
2025-04-10$93,000 Active
-
2010-09-01soldstatus
-
2004-06-04soldstatus
ⓘ Source: listings_history table (triggers on properties + properties_extension) + one-shot
backfill from property_details.listing_events for pre-trigger history.
Tax reassessment forecast MO · Resets to sale price
- Current annual tax
- $588 · $49/mo
- Projected year-2 tax
- $858 · $72/mo
- Expected delta
- +$270/yr (+$23/mo · 46.0%)
ⓘ Screening estimate from a state-policy table — verify with the county assessor before closing.
Climate risk First Street
- Flood 1/10 Low FEMA zone X (unshaded) · 0% chance over 30 yrs
- Wildfire 2/10 Low
- Heat 4/10 Moderate 7 d/yr ≥107°F today · 16 d/yr by 30 yrs out
- Wind 2/10 Low
- Air quality 3/10 Moderate 2 unhealthy d/yr today · 3 by 30 yrs out
Nearby sold comps map
Loading sold comps map…
Walkable amenities ~0.75 mi
Loading nearby amenities…
Taxation est. · year 1
- Rental income
- $12,517
- − Mortgage interest
- −$4,957
- − Property taxes
- −$588
- − Insurance
- −$442
- − Repairs & maintenance
- −$1,001
- − Management
- −$1,001
- − Depreciation
- −$2,575
- Taxable income
- $1,952
- Est. tax owed @ 24.0%
- −$469
- After-tax cash flow
- $2,820/yr
For passive investors: Depreciation is non-cash, so a rental often shows a tax loss while cash-flowing — sheltering income. Rental losses are passive: they offset passive income freely, and up to $25,000/yr can offset ordinary (W-2) income if you actively participate and your MAGI is under $100k (phasing out to $0 by $150k); unused losses carry forward. On sale, claimed depreciation is recaptured at up to 25%, and gains may owe capital-gains tax (a 1031 exchange can defer both). Figures are a year-1 estimate at your 24.0% rate — not tax advice; consult a CPA.
Schools (NCES district)
- District
- Independence 30
- NCES district ID
- 2915480
- Math proficiency
- 26% ▼ -8.00%
- Reading proficiency
- 38% ▼ -5.00%
- Median HH income
- $41,843
- Composite
- 27.04/100
- National rank
- #7054
- State rank
- #252 of 324 in MO
Livability — Independence
- Score
- 82/100
- State rank
- #10
- US rank
- #1296
Category grades
Schools grade is shown separately in the Schools card above.
Census & demographics
- Census place
- Independence, MO
- County
- Jackson County · 687,798 people
- City population
- 117,675
- Metro
- Kansas City, MO-KS
- Population (ZIP)
- 6,775
- Household income
- $47,285
- Rent vs Own
- Severe rent burden
- 330.0
Population outlook (Jackson County) Hauer SSP2
- Today (2025)
- 719,589 people
- By 2030
- 731,456 · +1.6%
- By 2040
- 746,689 · +3.8%
- By 2050
- 749,289 · +4.1%
- By 2075
- 736,227 · +2.3%
- By 2100
- 668,210 · -7.1%
Race, ethnicity, and origin ACS 2023
- Neighborhood character
- Diverse neighborhood (Simpson 0.57)
- Race & ethnicity
- White 59% Hispanic / Latino 28% Two or more races 14% Black 9% Native American 3%
- Hispanic origin (detail)
- Mexican 25%
- Common ancestry
- Italian 12% Lithuanian 3% Slovak 1%
- Foreign-born
- 12% · Canada, China
- Languages at home
- 78% English-only · Spanish 21%
Political lean MEDSL · Jackson
- 2024 margin
- D (+19.3) · D 58.9% · R 39.5% · Other 1.6%
- 2008→2024 swing
- -6.1pp toward R · 2008: 25.4pp · 2024: 19.3pp
- All cycles
- 2024: D+19.3 2020: D+22.0 2016: D+16.6 2012: D+19.0 2008: D+25.4
Not yet ingested
- Civics
- —
Market trends
- HPI YoY
- ▲ 52.69%
- Current HPI
- 347.9512
- Rent YoY
- —
- Metro
- Kansas City, MO-KS
- State GDP YoY
- ▲ 1.84%
- F500 in state
- 20
Industry mix (Fortune 500 HQ in MO)
| Industry | F500 HQs | Revenue |
|---|---|---|
| Healthcare | 1 | $163B |
|
||
| Insurance | 1 | $21B |
|
||
| Industrial Technology | 1 | $17B |
|
||
| Retail | 1 | $16B |
|
||
| Industrial Distribution | 1 | $10B |
|
||
| Utilities | 1 | $9B |
|
||
Price history
-4.8% since first listed7 events — show timeline
- 2026-05-15 Listed $88,500 Heartland MLS as Distributed by MLS Grid
- 2026-05-15 Coming Soon $88,500 Heartland MLS as Distributed by MLS Grid
- 2025-09-30 Listing Removed — Heartland MLS as Distributed by MLS Grid
- 2025-06-20 Price Changed $90,000 Heartland MLS as Distributed by MLS Grid
- 2025-04-10 Listed $93,000 Heartland MLS as Distributed by MLS Grid
- 2010-09-01 Sold (Public Records) — Public Records
- 2004-06-04 Sold (Public Records) — Public Records
Property tax history
+7.0%/yrLatest (2025): $588 · -11.8% YoY. Source: county tax records.
Cash-flow waterfall
monthlySold comps — $/sqft
last 12 mo · ≤1 miLoading sold comps…