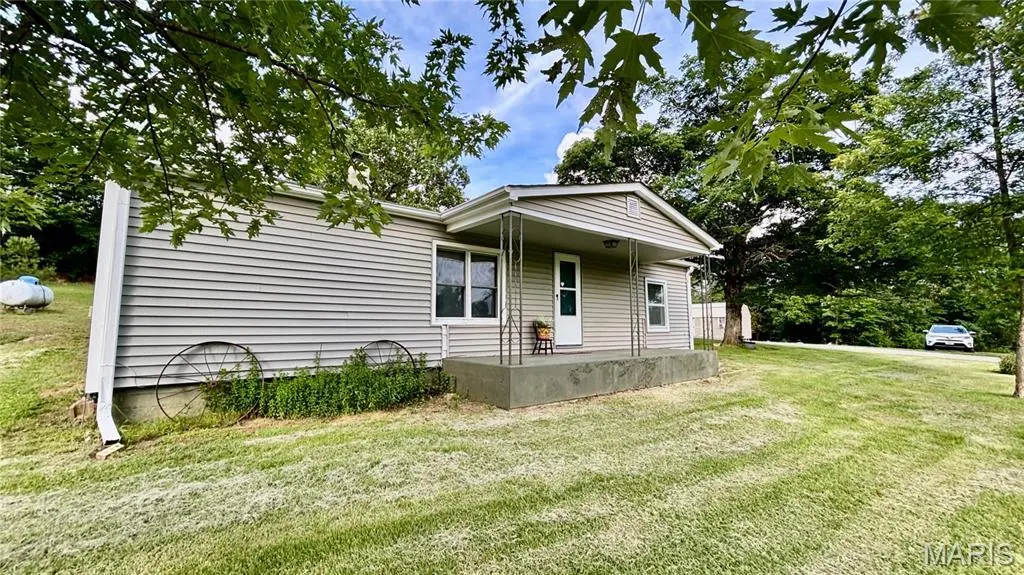
14754 State Hwy F · Potosi, MO
Flood risk 1/10 · Minimal
- FEMA flood zone
- X (unshaded)
- Chance of flooding over 30 yrs
- 0.0%
- Est. flood insurance / yr
- $507 – $1,088
Fire risk 5/10 · Moderate
- Est. fire insurance / yr
- $1,054 – $1,958
Heat risk 4/10 · Minor
- Hot days now (above 104°F)
- 7 days/yr
- Hot days in 30 yrs
- 19 days/yr
Wind risk 2/10 · Minimal
- Chance of severe wind over 30 yrs
- 1.0%
Air-quality risk 2/10 · Minimal
- Unhealthy air days now
- 0 days/yr
- Unhealthy air days in 30 yrs
- 1 days/yr
Risk factors via First Street. Map © Google.
Why this score? — see what drove the D grade
The composite is a weighted blend of 9 inputs, each scored 0–100. Each bar is that input's sub-score; the figure is the points it added to the 100-point composite (weight × sub-score).
- Appreciation +10.0/10.0
- Cash flow +7.6/30.0
- ARV discount +7.5/15.0
- Schools +4.1/10.0
- Livability +3.2/5.0
- Rent growth +2.5/5.0
- Condition / age +2.5/5.0
- DSCR +1.7/10.0
- 1% rule +0.9/10.0
$179,000
🖨 Deal sheet (PDF) 📄 Offer letter ✓ Due diligence
Listing remarks MLS
GREAT COUNTRY LIVING JUST OUT OF TOWN--ROOM FOR THE GARDEN, PETS AND AWAY FROM THE HUSTLE. TWO BEDROOM ONE BATH, STORAGE ROOM, LAUNDRY ROOM, OFFICE ROOM, BACK PORCH AND FRONT PORCH ALL ON 4.79+/-ACRES, NICE BIG YARD. CHAIN LINK FENCED AREA FOR THE PETS.
Key facts
- 4.79 acre lot
- Garage
- Built 1954
Property features AI
Finance
- Other: Private ownership
- Financial info: Lease not considered
Exterior
- Parking: One-car garage
- Utilities: Public water; Septic tank; Electricity (220 volts); Electricity connected; Propane; Water connected
- Home design: Single-family attached residence; One level
- Construction: Vinyl siding
- Exterior features: Covered patio; Rear porch; Screened porch; Back yard; Front yard; Adjoins wooded area; Cleared areas; Heavy woods; Orchard(s); Barn(s) on the property
Interior
- Kitchen: Electric oven
- Bedrooms: Three bedrooms on the main level
- Flooring: Carpet; Laminate
- Bathrooms: One full bathroom (main level)
- Heating & cooling: Electric heating; Central air conditioning
- Interior features: Insulated windows with storm and tilt-in features; Window treatments
- Laundry & utility: Washer and dryer; Main-level laundry room
Neighborhood map
What this means for you Summary
Snapshot
- This is a 3-bed/1.0-bath other listed at $179k.
Deal economics
- At list price, monthly cash flow is $-213 ($-3k/yr) — negative.
- To cash-flow at today's rent, offer at most $141k (21.1% below list).
- To meet the 1% rule (rent ≥ 1% of price), the offer needs to be $106k (41.0% below list).
- Recommended offer: $106k (41.0% below list) — sets the bar for 1% rule.
- Cap rate 4.9% vs local median 2.7% in Potosi — top-decile yield for the area; either an underpriced asset or a hidden risk that comps aren't pricing in. Stress-test before assuming the spread holds.
Location & tenants
- Location reads 65/100 on livability (#287 in MO) — a middle-class / working-renter tenant base. Strengths: cost of living A+, housing A, health & safety B+; Watch: crime F, amenities D-, commute F.
- Potosi R-III (town): math 44% / reading 56% proficiency, ranked #53 of 324 in MO (top 16%) — acceptable for families but not a draw, mixed tenant base, ~2y average lease.
- Zoned schools: Potosi Elem. (math 52% / reading 57%, grade C, #190 of 1,115 statewide, top 19%, 606 students, 100% FRL); Potosi High (math 37% / reading 57%, grade D-, #155 of 521 statewide, top 32%, 682 students, 100% FRL) — zoned schools average 100% FRL vs 56% district-wide (44 pts higher); higher-poverty schools than district average — tighter screening recommended.
- Market conditions: 82 active listings in the ZIP.
Forward outlook
- In year one you build about $19k of equity ($1k loan paydown + $18k appreciation (10.0% local appreciation)).
- Washington County population projected at -21% by 2050 — secular population decline; favor cash flow + early exit over multi-decade hold.
- By year 2, paydown + projected appreciation supports a ~$31k cash-out refi (75% LTV) — recoverable capital for the next deal without selling this one.
Negotiation context
- Only 11 days on market — expect competitive offers; lowballing is unlikely to land.
- 2 sale attempts since 10y ago; this cycle's ask is 99900% above the opening price — seller raised mid-cycle; expect resistance to lowballs.
Risks & watch-outs
- Watch-outs: built in 1954 — expect roof / HVAC / electrical / plumbing capex.
- Climate carrying-cost: moderate wildfire risk — expect insurance premiums to compound above CPI over the hold.
Questions for the listing agent
- What do current leases actually rent for vs. the listed asking? Can we see a recent rent roll and the last 12 months of T-12 income?
- Built in 1954 — when were the roof, HVAC, electrical panel, plumbing, and water heater last replaced?
- Is there a deadline driving the sale (1031 exchange, divorce, estate, relocation)? That informs how much negotiation room exists.
- Schools are D-rated, which usually means shorter tenancies and higher turnover. Who's the typical renter profile here, and what's been the actual vacancy rate?
- Crime grade is F in this area — have there been break-ins, vandalism, or insurance claims at this property in the last 3 years? What carrier currently insures it and at what premium?
- The area grade is low — what's the realistic commute time and amenity access for the typical tenant pool here? Any planned neighborhood developments (good or bad) we should know about?
- What's the average days-on-market for RENTAL listings here right now (not sales)? A rising rental-DOM trend means longer vacancies and softer asking-rent achievability than the comps imply.
- What's the recent tenant-quality profile in this submarket — average credit score on applications, eviction rate, late-payment / NSF rate, and stable-employment percentage? A property-management company in the area should have these aggregated.
- How much new for-sale + rental construction is in the pipeline within 1–3 miles? Heavy new supply typically softens prices + rents 12–24 months out; constrained supply supports both.
Investment metrics
- 1% rule
- 0.59% ✗
- Cap rate
- 4.86%
- Cash-on-cash
- -5.11%
- DSCR
- 0.77
- GRM
- 14.1
CMA / ARV
No comps found within radius.
Projected returns pro-forma
10.0% appreciation · 3.0% rent growth · sell at horizon
- IRR
- 20.6%
- Equity multiple
- 2.67×
- Total profit
- $83,796
- Equity at exit
- $161,257
- IRR
- 18.7%
- Equity multiple
- 6.13×
- Total profit
- $257,254
- Equity at exit
- $347,758
Cash invested: $50,120 (down + closing). Projections, not guarantees.
Landlord ↔ Tenant lean methodology
- Overall (STATE)
- 81 Strongly Landlord-Friendly
- State Missouri
- 81 Strongly Landlord-Friendly · R+10
- County
- — inherits STATE
- City
- — inherits STATE
ZIP-level market 63664
- Home prices YoY
- 25.1%
- Active inventory
- 82
- Price-to-rent
- 14.1×
Monthly cashflow live
- Estimated rent
- $1,055 medium interval (Pro) →
- Mortgage (P&I)
- −$939
- Tax from tax record
- −$34 /mo · $405/yr
- Insurance
- −$75
- HOA
- −$0
- Vacancy / Maint / Mgmt
- −$222
- Net cashflow
- $-213
Break-even live
Sensitivity live
| Price | -10% $-112 | -5% $-163 | +0% $-213 | +5% $-264 | +10% $-315 |
|---|---|---|---|---|---|
| Rent | -10% $-297 | -5% $-255 | +0% $-213 | +5% $-172 | +10% $-130 |
| Rate | -1.0pp $-123 | -0.5pp $-168 | base $-213 | +0.5pp $-260 | +1.0pp $-307 |
UW: 25.0% down · 7.5% · 30yr · 1.5% tax · 5.0% vac · 8.0% maint · 8.0% mgmt
Financing live
Cash to close
- Down payment
- $44,750
- Closing costs
- $5,370
- Reserves months
- —
- Total cash needed
- —
Loan-product check · same deal, 3 products live
Conventional
25% down · 7.5% · 30yr
- Down + closing
- —
- Monthly P&I
- —
- Monthly cashflow
- —
- DSCR
- —
- Eligible?
- —
Personal DTI + credit; lowest rate.
DSCR
20% down · 8.5% · 30yr
- Down + closing
- —
- Monthly P&I
- —
- Monthly cashflow
- —
- DSCR
- —
- Eligible?
- —
No personal income docs; deal must DSCR.
Hard money
10% down · 12.0% · 12mo
- Down + closing
- —
- Monthly P&I
- —
- Monthly cashflow
- —
- DSCR
- —
- Eligible?
- —
Short-term bridge; refi at stabilization.
Listing history 8 events
-
2026-06-21days on market $179,000 Active 11 DOM
-
2026-06-18days on market $179,000 Active 9 DOM
-
2026-06-17days on market $179,000 Active 8 DOM
-
2026-06-16days on market $179,000 Active 7 DOM
-
2026-06-15days on market $179,000 Active 6 DOM
-
2026-06-13days on market $179,000 Active 4 DOM
-
2026-06-12days on market $179,000 Active 3 DOM
-
2026-06-09$179,000 Active 1 DOM
ⓘ Source: listings_history table (triggers on properties + properties_extension) + one-shot
backfill from property_details.listing_events for pre-trigger history.
Tax reassessment forecast MO · Resets to sale price
- Current annual tax
- $405 · $34/mo
- Projected year-2 tax
- $1,736 · $145/mo
- Expected delta
- +$1,331/yr (+$111/mo · 328.5%)
ⓘ Screening estimate from a state-policy table — verify with the county assessor before closing.
Climate risk First Street
- Flood 1/10 Low FEMA zone X (unshaded) · 0% chance over 30 yrs
- Wildfire 5/10 Major
- Heat 4/10 Moderate 7 d/yr ≥104°F today · 19 d/yr by 30 yrs out
- Wind 2/10 Low 100% chance of damaging wind over 30 yrs
- Air quality 2/10 Low 0 unhealthy d/yr today · 1 by 30 yrs out
Nearby sold comps map
Loading sold comps map…
Walkable amenities ~0.75 mi
Loading nearby amenities…
Taxation est. · year 1
- Rental income
- $12,663
- − Mortgage interest
- −$10,027
- − Property taxes
- −$405
- − Insurance
- −$895
- − Repairs & maintenance
- −$1,013
- − Management
- −$1,013
- − Depreciation
- −$5,207
- Taxable loss
- −$5,897
- Est. tax savings @ 24.0%
- +$1,415
- After-tax cash flow
- $-1,145/yr
For passive investors: Depreciation is non-cash, so a rental often shows a tax loss while cash-flowing — sheltering income. Rental losses are passive: they offset passive income freely, and up to $25,000/yr can offset ordinary (W-2) income if you actively participate and your MAGI is under $100k (phasing out to $0 by $150k); unused losses carry forward. On sale, claimed depreciation is recaptured at up to 25%, and gains may owe capital-gains tax (a 1031 exchange can defer both). Figures are a year-1 estimate at your 24.0% rate — not tax advice; consult a CPA.
Schools (NCES district)
- District
- Potosi R-III
- NCES district ID
- 2925500
- Math proficiency
- 44% ▼ -14.00%
- Reading proficiency
- 56% ▼ -6.00%
- Median HH income
- $34,151
- Composite
- 41.22/100
- National rank
- #3536
- State rank
- #53 of 324 in MO
Livability — Potosi
- Score
- 65/100
- State rank
- #287
- US rank
- #13297
Category grades
Schools grade is shown separately in the Schools card above.
Census & demographics
- Population (ZIP)
- 9,060
Population outlook (Washington County) Hauer SSP2
- Today (2025)
- 23,761 people
- By 2030
- 22,923 · -3.5%
- By 2040
- 20,992 · -11.7%
- By 2050
- 18,849 · -20.7%
- By 2075
- 13,749 · -42.1%
- By 2100
- 9,016 · -62.1%
Race, ethnicity, and origin ACS 2023
- Neighborhood character
- Predominantly White (91%)
- Race & ethnicity
- White 91% Two or more races 7% Hispanic / Latino 2%
- Common ancestry
- Lithuanian 9% Italian 2% Serbian 1%
- Foreign-born
- 0%
Political lean MEDSL · Washington
- 2024 margin
- Solid R (+65.2) · D 17.1% · R 82.3%
- 2008→2024 swing
- -65.3pp toward R · 2008: 0.1pp · 2024: -65.2pp
- All cycles
- 2024: R+65.2 2020: R+62.6 2016: R+55.2 2012: R+18.6 2008: D+0.1
Not yet ingested
- Civics
- —
Market trends
- HPI YoY
- ▲ 59.56%
- Current HPI
- 296.5011
- Rent YoY
- —
- Metro
- —
- State GDP YoY
- ▲ 1.84%
- F500 in state
- 20
Industry mix (Fortune 500 HQ in MO)
| Industry | F500 HQs | Revenue |
|---|---|---|
| Healthcare | 1 | $163B |
|
||
| Insurance | 1 | $21B |
|
||
| Industrial Technology | 1 | $17B |
|
||
| Retail | 1 | $16B |
|
||
| Industrial Distribution | 1 | $10B |
|
||
| Utilities | 1 | $9B |
|
||
Price history
+186.4% since first listed5 events — show timeline
- 2026-06-09 Price Changed $179,000 MARIS as Distributed by MLS Grid
- 2026-06-09 Listed $179 MARIS as Distributed by MLS Grid
- 2026-06-09 Coming Soon $179 MARIS as Distributed by MLS Grid
- 2016-06-08 Listed $62,500 MARIS as Distributed by MLS Grid
- 2016-06-08 Sold (MLS) — MARIS as Distributed by MLS Grid
Property tax history
+0.2%/yrLatest (2025): $405 · -2.1% YoY. Source: county tax records.
Cash-flow waterfall
monthlySold comps — $/sqft
last 12 mo · ≤1 miLoading sold comps…