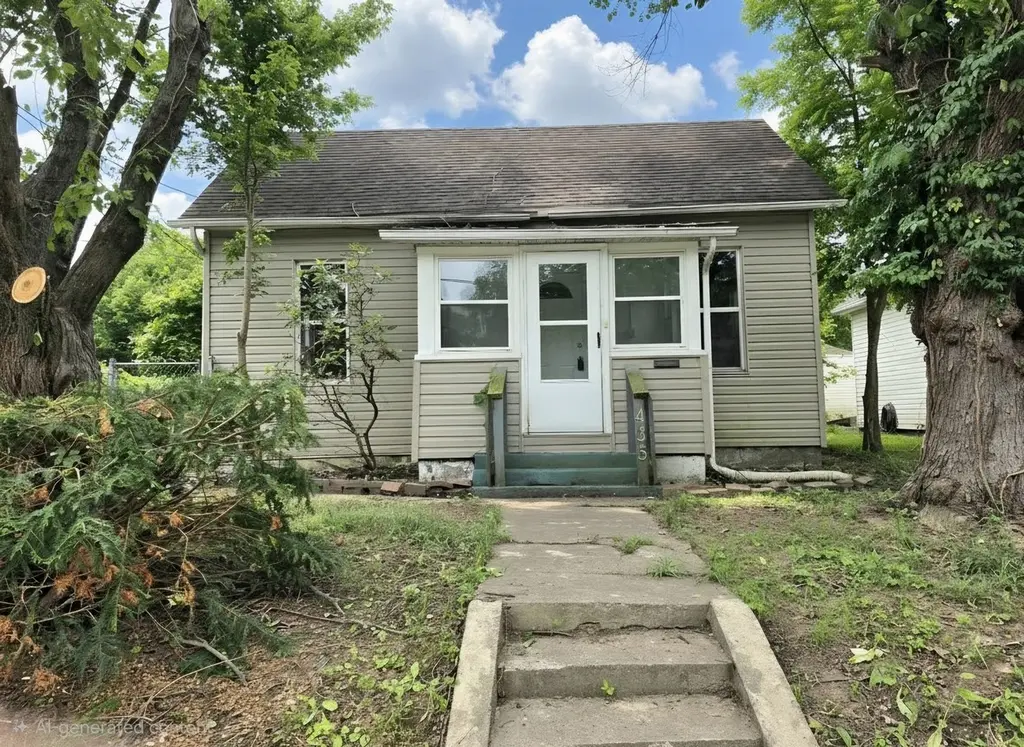
435 Lucier St · Murphysboro, IL
Flood risk 1/10 · Minimal
- FEMA flood zone
- X (unshaded)
- Chance of flooding over 30 yrs
- 0.0%
- Est. flood insurance / yr
- $507 – $1,088
Fire risk 1/10 · Minimal
- Est. fire insurance / yr
- $804 – $1,492
Heat risk 5/10 · Moderate
- Hot days now (above 107°F)
- 7 days/yr
- Hot days in 30 yrs
- 21 days/yr
Wind risk 2/10 · Minimal
- Chance of severe wind over 30 yrs
- 2.0%
Air-quality risk 1/10 · Minimal
- Unhealthy air days now
- 0 days/yr
- Unhealthy air days in 30 yrs
- 0 days/yr
Risk factors via First Street. Map © Google.
Why this score? — see what drove the C grade
The composite is a weighted blend of 9 inputs, each scored 0–100. Each bar is that input's sub-score; the figure is the points it added to the 100-point composite (weight × sub-score).
- Cash flow +28.8/30.0
- DSCR +10.0/10.0
- 1% rule +8.8/10.0
- Livability +2.7/5.0
- Rent growth +2.5/5.0
- Condition / age +2.5/5.0
- ARV discount +1.1/15.0
- Schools +0.8/10.0
- Appreciation +0.0/10.0
$60,000
🖨 Deal sheet 📄 Offer letter ✓ Due diligence
Listing remarks
Charming, full of potential, and ready for your personal touch! This inviting 2-bedroom, 1-bath home offers comfortable living spaces, classic charm, and endless possibilities for any buyer whether you are a first-time home buyer, investor, downsizing or anything in between this home has something for you! Step inside to find a spacious family room perfect for relaxing, entertaining, or gathering with friends and family. The large kitchen provides plenty of cabinet and counter space with room to create the kitchen of your dreams. Outside, you'll appreciate the detached 1-car garage along with the property's character and curb appeal. Whether you're looking for a cozy place to call home o
Key facts
- 6,098 sq ft lot
- Garage
- Built 1923
Property features AI
Finance
- Other: Property assessed/area living area source: Assessor
- HOA & community: No master association fee required
Exterior
- Parking: Detached garage plus additional parking (total 5 spaces); One garage space
- Utilities: Public water; Public sewer; Electric service (standard)
- Home design: Detached single-family home; Single story; Built over 100 years ago; Asphalt roof; Vinyl siding; Fee simple ownership
- Construction: Vinyl siding construction; Asphalt roof; Unfinished basement (approx. 1,142 unfinished sq ft)
- Exterior features: Lot dimensions approximately 47 x 130; Lot smaller than 0.25 acre
Interior
- Kitchen: Kitchen on main level (14 x 11) with laminate flooring
- Bedrooms: Master bedroom on main level (13 x 12) with hardwood flooring; Second bedroom on main level (15 x 11) with carpet
- Flooring: Hardwood in master bedroom; Carpet in living room and bedroom; Vinyl in dining room; Laminate in kitchen
- Bathrooms: One full bathroom
- Heating & cooling: Natural gas heating; Central air conditioning
- Interior features: Five total rooms; Unfinished full basement
- Laundry & utility: Laundry area located in bathroom
Neighborhood map
What this means for you Summary
Snapshot
- This is a 1-bed/1.0-bath single-family listed at $60k.
Deal economics
- At list price, monthly cash flow is $202 ($2k/yr) — positive.
- The deal already cash-flows at list — no discount required.
- Meets the 1% rule at list price ($825 rent vs $60k).
- Recommended offer: $59k (1.5% below list) — sets the bar for market timing.
- Cap rate 10.3% vs local median 6.2% in Murphysboro — top-decile yield for the area; either an underpriced asset or a hidden risk that comps aren't pricing in. Stress-test before assuming the spread holds.
Location & tenants
- Location reads 54/100 on livability (#1,265 in IL) — a working-class tenant base; expect higher turnover. Strengths: cost of living A+, housing A-; Watch: schools F, crime D-, amenities F.
- Murphysboro CUSD 186 (town): math 9% / reading 10% proficiency, ranked #585 of 620 in IL (top 94%) — low school quality limits family demand, transient renter base, plan for 1-2y turnover; 62% free/reduced lunch — lower-income household profile, screen leases tightly.
- Market conditions: 79 active listings in the ZIP; 1 comparable units currently listed for rent nearby; 5 units permitted in Jackson County in 2024 (0 in 5+ unit buildings).
Forward outlook
- Local home prices are declining (-3.0%/yr); year-one equity from $415 of loan paydown is wiped out by about $2k of value loss. Plan a longer hold.
- At projected returns (-3.0% appreciation + 3.0% rent growth), your $17k cash investment doubles in ~9 years — after that, you're playing with house money.
Negotiation context
- It's been on market 25 days — a 2% lower offer ($59k) is reasonable based on typical stale-listing flexibility.
- 5 sale attempts since 7y ago with the ask held roughly flat each time — persistent listings suggest the price (not the market) is what's stuck; bring a comps-based counter.
- Current owner paid $33k; list at $60k implies a 82% gain — meaningful room to come down on a strong offer.
Risks & watch-outs
- Watch-outs: built in 1923 — expect roof / HVAC / electrical / plumbing capex.
- Climate carrying-cost: extreme-heat days projected 7→21/yr by 2055 (HVAC capex compounding) — expect insurance premiums to compound above CPI over the hold.
Questions for the listing agent
- Built in 1923 — when were the roof, HVAC, electrical panel, plumbing, and water heater last replaced?
- Is there a deadline driving the sale (1031 exchange, divorce, estate, relocation)? That informs how much negotiation room exists.
- Schools are F-rated, which usually means shorter tenancies and higher turnover. Who's the typical renter profile here, and what's been the actual vacancy rate?
- Crime grade is D in this area — have there been break-ins, vandalism, or insurance claims at this property in the last 3 years? What carrier currently insures it and at what premium?
- What's the average days-on-market for RENTAL listings here right now (not sales)? A rising rental-DOM trend means longer vacancies and softer asking-rent achievability than the comps imply.
- What's the recent tenant-quality profile in this submarket — average credit score on applications, eviction rate, late-payment / NSF rate, and stable-employment percentage? A property-management company in the area should have these aggregated.
- How much new for-sale + rental construction is in the pipeline within 1–3 miles? Heavy new supply typically softens prices + rents 12–24 months out; constrained supply supports both.
Investment metrics
- 1% rule
- 1.38% ✓
- Cap rate
- 10.33%
- Cash-on-cash
- 14.41%
- DSCR
- 1.64
- GRM
- 6.1
CMA / ARV
- ARV (on-the-fly)
- $52,532
- Comps found
- 12
Show comp detail 12 sales within ~0.75 mi
| Address | Dist | Beds/Ba | Sqft | Sold | Price | $/sf | Match |
|---|---|---|---|---|---|---|---|
| 403 North St | 0.16mi | 2/1.0 (+1) | 1,147 (+0%) | 1mo | $124,800 | $109 | 86 |
| 526 N 9th St | 0.36mi | 2/1.5 (+1) | 1,196 (+5%) | 9mo | $30,000 | $25 | 61 |
| 526 N 9th St | 0.36mi | 2/1.5 (+1) | 1,196 (+5%) | 9mo | $30,000 | $25 | 61 |
| 1502 Gartside St | 0.64mi | 2/1.0 (+1) | 1,200 (+5%) | 6mo | $55,000 | $46 | 51 |
| 1502 Gartside St | 0.64mi | 2/1.0 (+1) | 1,200 (+5%) | 6mo | $55,000 | $46 | 51 |
| 1318 Olive St | 0.61mi | 2/1.0 (+1) | 1,048 (-8%) | 6mo | $70,000 | $67 | 48 |
| 918 Keough Dr | 0.68mi | 2/1.0 (+1) | 1,196 (+5%) | 15mo | $105,000 | $88 | 43 |
| 918 Keough Dr | 0.68mi | 2/1.0 (+1) | 1,196 (+5%) | 15mo | $105,000 | $88 | 43 |
| 1312 Olive St | 0.60mi | 2/2.0 (+1) | 1,184 (+4%) | 21mo | $50,000 | $42 | 39 |
| 1520 Gartside St | 0.68mi | 2/1.0 (+1) | 980 (-14%) | 1mo | $100,000 | $102 | 38 |
| 465 Old Brick Rd | 0.73mi | 2/1.0 (+1) | 1,072 (-6%) | 16mo | $17,754 | $17 | 37 |
| 465 Old Brick Rd | 0.73mi | 2/1.0 (+1) | 1,072 (-6%) | 16mo | $17,754 | $17 | 37 |
Match score weights: distance 35% · size 25% · config 20% · recency 20%. Top-matched comps best support the ARV.
Projected returns pro-forma
-3.0% appreciation · 3.0% rent growth · sell at horizon
- IRR
- 4.9%
- Equity multiple
- 1.19×
- Total profit
- $3,160
- Equity at exit
- $8,946
- IRR
- 14.3%
- Equity multiple
- 2.16×
- Total profit
- $19,436
- Equity at exit
- $5,188
Cash invested: $16,800 (down + closing). Projections, not guarantees.
Landlord ↔ Tenant lean methodology
- Overall (STATE)
- 43 Moderately Tenant-Leaning
- State Illinois
- 43 Moderately Tenant-Leaning · D+7
- County
- — inherits STATE
- City
- — inherits STATE
ZIP-level market 62966
- Active inventory
- 79
- Price-to-rent
- 6.1×
Monthly cashflow live
- Estimated rent
- $825 medium interval (Pro) →
- Mortgage (P&I)
- −$315
- Tax from tax record
- −$110 /mo · $1,324/yr
- Insurance
- −$25
- HOA
- −$0
- Vacancy / Maint / Mgmt
- −$173
- Net cashflow
- $202
Break-even live
UW: 25.0% down · 7.5% · 30yr · 1.5% tax · 5.0% vac · 8.0% maint · 8.0% mgmt
Financing live
Cash to close
- Down payment
- $15,000
- Closing costs
- $1,800
- Reserves months
- —
- Total cash needed
- —
Loan-product check · same deal, 3 products live
Conventional
25% down · 7.5% · 30yr
- Down + closing
- —
- Monthly P&I
- —
- Monthly cashflow
- —
- DSCR
- —
- Eligible?
- —
Personal DTI + credit; lowest rate.
DSCR
20% down · 8.5% · 30yr
- Down + closing
- —
- Monthly P&I
- —
- Monthly cashflow
- —
- DSCR
- —
- Eligible?
- —
No personal income docs; deal must DSCR.
Hard money
10% down · 12.0% · 12mo
- Down + closing
- —
- Monthly P&I
- —
- Monthly cashflow
- —
- DSCR
- —
- Eligible?
- —
Short-term bridge; refi at stabilization.
Rent comps 1 comps
| Address | Beds | Baths | Sqft | Rent | $/sqft | DOM | Units | Dist |
|---|---|---|---|---|---|---|---|---|
| 502 Lucier St Murphysboro, IL | 2.0 | 1.0 | 988 | $825 | $0.84 | 43d | 1 | 0.06mi |
Listing history 29 events
-
2026-06-19days on market $60,000 Active 25 DOM
-
2026-06-18days on market $60,000 Active 24 DOM
-
2026-06-17days on market $60,000 Active 23 DOM
-
2026-06-16days on market $60,000 Active 22 DOM
-
2026-06-15days on market $60,000 Active 21 DOM
-
2026-06-14days on market $60,000 Active 19 DOM
-
2026-06-13days on market $60,000 Active 18 DOM
-
2026-06-10days on market $60,000 Active 16 DOM
-
2026-06-09days on market $60,000 Active 15 DOM
-
2026-06-09days on market $60,000 Active 14 DOM
-
2026-06-07days on market $60,000 Active 13 DOM
-
2026-06-05days on market $60,000 Active 10 DOM
-
2026-06-02days on market $60,000 Active 8 DOM
-
2026-06-01days on market $60,000 Active 7 DOM
-
2026-05-31days on market $60,000 Active 6 DOM
-
2026-05-30days on market $60,000 Active 5 DOM
-
2026-05-24$60,000 Active
-
2024-09-12soldstatus $33,000
-
2024-03-28status Active
-
2024-03-28historical
-
2024-03-28historical
-
2024-03-13historical Under Contract
-
2023-11-25Active
-
2021-08-06historical
-
2020-08-31soldstatus $18,000
-
2020-08-31soldstatus
-
2020-08-31soldstatus $18,000
-
2019-11-06$25,000
-
2019-11-06$25,000
ⓘ Source: listings_history table (triggers on properties + properties_extension) + one-shot
backfill from property_details.listing_events for pre-trigger history.
Tax reassessment forecast IL · Partial reset (capped growth)
- Current annual tax
- $1,324 · $110/mo
- Projected year-2 tax
- $1,343 · $112/mo
- Expected delta
- +$19/yr (+$2/mo · 1.4%)
ⓘ Screening estimate from a state-policy table — verify with the county assessor before closing.
Climate risk First Street
- Flood 1/10 Low FEMA zone X (unshaded) · 0% chance over 30 yrs
- Wildfire 1/10 Low
- Heat 5/10 Major 7 d/yr ≥107°F today · 21 d/yr by 30 yrs out
- Wind 2/10 Low 2% chance of damaging wind over 30 yrs
- Air quality 1/10 Low 0 unhealthy d/yr today · 0 by 30 yrs out
Nearby sold comps map
Loading sold comps map…
Walkable amenities ~0.75 mi
Loading nearby amenities…
Taxation est. · year 1
- Rental income
- $9,900
- − Mortgage interest
- −$3,361
- − Property taxes
- −$1,324
- − Insurance
- −$300
- − Repairs & maintenance
- −$792
- − Management
- −$792
- − Depreciation
- −$1,745
- Taxable income
- $1,585
- Est. tax owed @ 24.0%
- −$380
- After-tax cash flow
- $2,040/yr
For passive investors: Depreciation is non-cash, so a rental often shows a tax loss while cash-flowing — sheltering income. Rental losses are passive: they offset passive income freely, and up to $25,000/yr can offset ordinary (W-2) income if you actively participate and your MAGI is under $100k (phasing out to $0 by $150k); unused losses carry forward. On sale, claimed depreciation is recaptured at up to 25%, and gains may owe capital-gains tax (a 1031 exchange can defer both). Figures are a year-1 estimate at your 24.0% rate — not tax advice; consult a CPA.
Schools (NCES district)
- District
- Murphysboro CUSD 186
- NCES district ID
- 1727610
- Math proficiency
- 9% ▼ -9.00%
- Reading proficiency
- 10% ▼ -8.00%
- Median HH income
- $36,963
- Composite
- 7.97/100
- National rank
- #9925
- State rank
- #585 of 620 in IL
Livability — Murphysboro
- Score
- 54/100
- State rank
- #1265
- US rank
- #23786
Category grades
Schools grade is shown separately in the Schools card above.
Census & demographics
- Census place
- Murphysboro, IL
- City population
- 13,995
- Population (ZIP)
- 13,995
Population outlook (Jackson County) Hauer SSP2
- Today (2025)
- 59,093 people
- By 2030
- 59,628 · +0.9%
- By 2040
- 59,495 · +0.7%
- By 2050
- 58,811 · -0.5%
- By 2075
- 57,683 · -2.4%
- By 2100
- 55,337 · -6.4%
Race, ethnicity, and origin ACS 2023
- Neighborhood character
- Predominantly White (77%)
- Race & ethnicity
- White 77% Hispanic / Latino 8% Black 8% Two or more races 6%
- Hispanic origin (detail)
- Mexican 3% Puerto Rican 1%
- Common ancestry
- Lithuanian 5% Slovak 3% Italian 2%
- Foreign-born
- 4% · Canada, South Korea
- Languages at home
- 91% English-only · Spanish 6% Russian/Polish/Slavic 1%
Political lean MEDSL · Jackson
- 2024 margin
- Toss-up / Even · D 51.0% · R 47.5% · Other 1.4%
- 2008→2024 swing
- -18.3pp toward R · 2008: 21.8pp · 2024: 3.5pp
- All cycles
- 2024: D+3.5 2020: D+1.3 2016: D+3.0 2012: D+10.3 2008: D+21.8
Not yet ingested
- Civics
- —
Market trends
- HPI YoY
- ▼ -76.39%
- Current HPI
- 95.9393
- Rent YoY
- —
- Metro
- —
- State GDP YoY
- ▲ 1.59%
- F500 in state
- 60
Industry mix (Fortune 500 HQ in IL)
| Industry | F500 HQs | Revenue |
|---|---|---|
| Insurance | 4 | $201B |
|
||
| Consumer Goods | 4 | $87B |
|
||
| Industrial Machinery | 3 | $64B |
|
||
| Healthcare | 2 | $55B |
|
||
| Retail / Pharmacy | 1 | $148B |
|
||
| Agriculture / Food | 1 | $86B |
|
||
Price history
+140.0% since first listed13 events — show timeline
- 2026-05-24 Listed $60,000 MRED as Distributed by MLS Grid
- 2024-09-12 Sold (Public Records) $33,000 Public Records
- 2024-03-28 Relisted — RMLSA as Distributed by MLS Grid
- 2024-03-28 Listing Removed — MRED as Distributed by MLS Grid
- 2024-03-28 Listing Removed — RMLSA as Distributed by MLS Grid
- 2024-03-13 Contingent — RMLSA as Distributed by MLS Grid
- 2023-11-25 Listed — RMLSA as Distributed by MLS Grid
- 2021-08-06 Listing Removed — RMLSA as Distributed by MLS Grid
- 2020-08-31 Sold (MLS) $18,000 RMLSA as Distributed by MLS Grid
- 2020-08-31 Sold (MLS) — MARIS as Distributed by MLS Grid
- 2020-08-31 Sold (MLS) $18,000 MRED as Distributed by MLS Grid
- 2019-11-06 Listed $25,000 RMLSA as Distributed by MLS Grid
- 2019-11-06 Listed $25,000 MRED as Distributed by MLS Grid
Property tax history
-0.4%/yrLatest (2024): $1,324 · +6.1% YoY. Source: county tax records.
Cash-flow waterfall
monthlySold comps — $/sqft
last 12 mo · ≤1 miLoading sold comps…