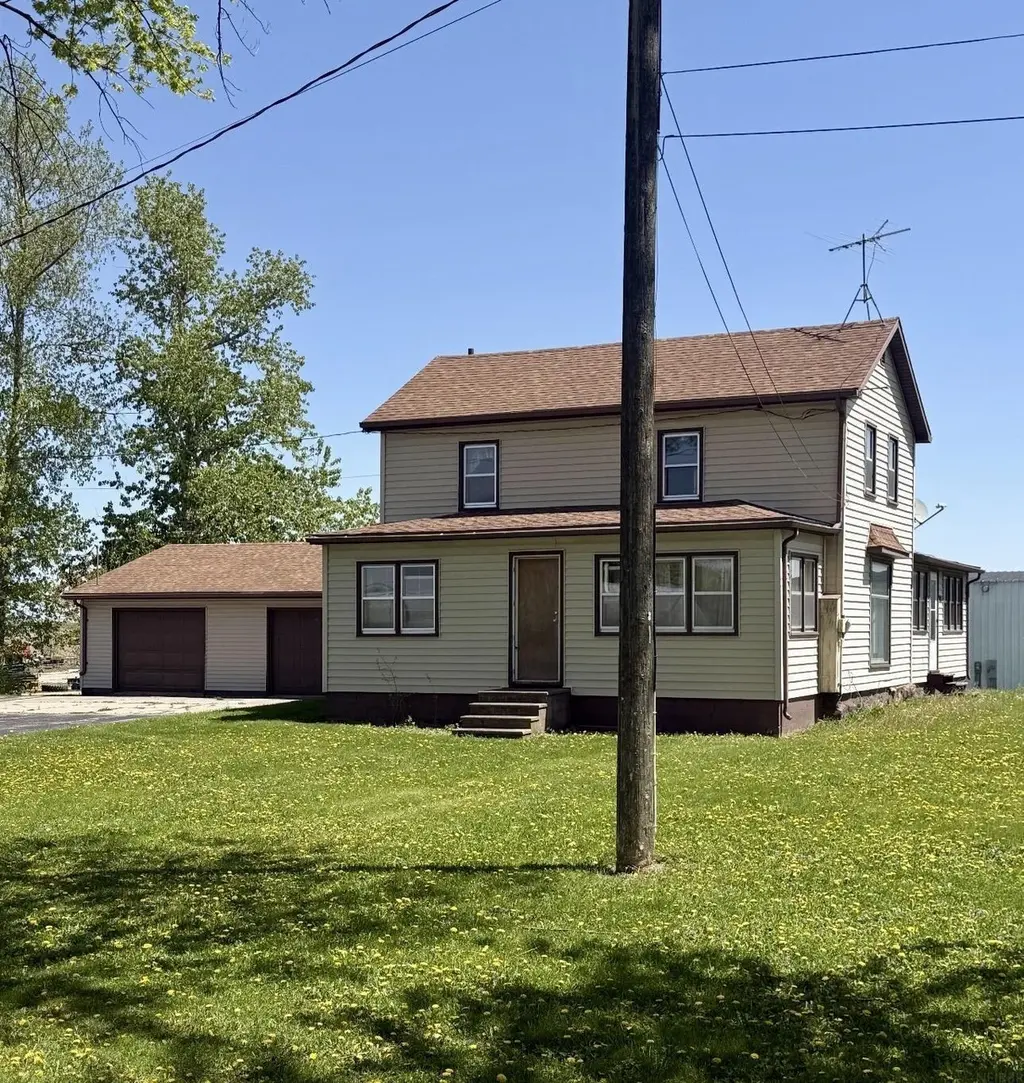
402 E Union St · Edgewood, IA
Flood risk 1/10 · Minimal
- FEMA flood zone
- X (unshaded)
- Chance of flooding over 30 yrs
- 0.0%
- Est. flood insurance / yr
- $473 – $860
Fire risk 1/10 · Minimal
- Est. fire insurance / yr
- $902 – $1,676
Heat risk 2/10 · Minimal
- Hot days now (above 99°F)
- 7 days/yr
- Hot days in 30 yrs
- 15 days/yr
Wind risk 2/10 · Minimal
- Chance of severe wind over 30 yrs
- —
Air-quality risk 2/10 · Minimal
- Unhealthy air days now
- 0 days/yr
- Unhealthy air days in 30 yrs
- 1 days/yr
Risk factors via First Street. Map © Google.
Why this score? — see what drove the C+ grade
The composite is a weighted blend of 9 inputs, each scored 0–100. Each bar is that input's sub-score; the figure is the points it added to the 100-point composite (weight × sub-score).
- Cash flow +20.1/30.0
- Appreciation +10.0/10.0
- ARV discount +7.5/15.0
- 1% rule +6.4/10.0
- DSCR +6.4/10.0
- Schools +5.7/10.0
- Livability +3.5/5.0
- Rent growth +2.5/5.0
- Condition / age +2.5/5.0
$99,900
🖨 Deal sheet 📄 Offer letter ✓ Due diligence
Listing remarks
Opportunity awaits! This property offers a chance to build equity and make it your own. Being sold as-is. With a little vision and work, this could be a great home or investment!
Key facts
- 1.89 acre lot
- 2 parking spots
- Built 1899
Property features AI
Finance
- Financial info: Annual tax amount listed (not included per instructions)
Exterior
- Parking: Carport with 2 spaces
- Utilities: Public water; Public sewer
- Home design: Single-family residence; 2 stories
- Construction: Vinyl siding; Built with block basement
- Exterior features: Shingle roof; Lot size about 1.89 acres; Zoned A-1
Interior
- Bathrooms: 1 full bathroom
- Heating & cooling: Natural gas heating; Has cooling (type: Other)
- Interior features: No fireplace; Block basement
Neighborhood map
What this means for you Summary
Snapshot
- This is a 3-bed/1.0-bath single-family listed at $100k.
Deal economics
- At list price, monthly cash flow is $124 ($1k/yr) — positive.
- The deal already cash-flows at list — no discount required.
- Meets the 1% rule at list price ($1k rent vs $100k).
- Recommended offer: $98k (1.5% below list) — sets the bar for market timing.
Location & tenants
- Location reads 69/100 on livability (#413 in IA) — a middle-class / working-renter tenant base. Strengths: cost of living A+, housing A+, schools B; Watch: health & safety C-, employment D+, amenities F.
- Edgewood-Colesburg Community School District (rural): math 68% / reading 65% proficiency, ranked #178 of 289 in IA (top 62%) — acceptable for families but not a draw, mixed tenant base, ~2y average lease.
- Market conditions: 3 active listings in the ZIP; 48 units permitted in Clayton County in 2024 (0 in 5+ unit buildings).
Forward outlook
- In year one you build about $11k of equity ($691 loan paydown + $10k appreciation (10.0% local appreciation)).
- Clayton County population projected at -21% by 2050 — secular population decline; favor cash flow + early exit over multi-decade hold.
- At projected returns (10.0% appreciation + 3.0% rent growth), your $28k cash investment doubles in ~3 years — after that, you're playing with house money.
- By year 4, paydown + projected appreciation supports a ~$38k cash-out refi (75% LTV) — recoverable capital for the next deal without selling this one.
Negotiation context
- It's been on market 15 days — a 2% lower offer ($98k) is reasonable based on typical stale-listing flexibility.
Risks & watch-outs
- Watch-outs: property tax is 2.6% of price; built in 1899 — expect roof / HVAC / electrical / plumbing capex.
Questions for the listing agent
- Built in 1899 — when were the roof, HVAC, electrical panel, plumbing, and water heater last replaced?
- Property tax is high relative to price — has the assessment been appealed recently, and will the sale trigger a re-assessment?
- Is there a deadline driving the sale (1031 exchange, divorce, estate, relocation)? That informs how much negotiation room exists.
- Schools are B-rated — typically a magnet for longer-tenancy family renters. What's the average tenant stay here, and is there a school-zone premium baked into asking?
- What's the average days-on-market for RENTAL listings here right now (not sales)? A rising rental-DOM trend means longer vacancies and softer asking-rent achievability than the comps imply.
- What's the recent tenant-quality profile in this submarket — average credit score on applications, eviction rate, late-payment / NSF rate, and stable-employment percentage? A property-management company in the area should have these aggregated.
- How much new for-sale + rental construction is in the pipeline within 1–3 miles? Heavy new supply typically softens prices + rents 12–24 months out; constrained supply supports both.
Investment metrics
- 1% rule
- 1.14% ✓
- Cap rate
- 7.78%
- Cash-on-cash
- 5.31%
- DSCR
- 1.24
- GRM
- 7.3
CMA / ARV
- ARV (on-the-fly)
- $221,672
- Comps found
- 3
Show comp detail 3 sales within ~0.75 mi
| Address | Dist | Beds/Ba | Sqft | Sold | Price | $/sf | Match |
|---|---|---|---|---|---|---|---|
| 403 N Chestnut St | 0.49mi | 3/2.0 | 1,900 (+4%) | 24mo | $230,000 | $121 | 47 |
| 302 N Chestnut St | 0.50mi | 3/1.5 | 1,600 (-13%) | 18mo | $178,000 | $111 | 39 |
| 209 Woods Edge Dr | 0.64mi | 3/2.0 | 1,564 (-15%) | 6mo | $265,000 | $169 | 37 |
Match score weights: distance 35% · size 25% · config 20% · recency 20%. Top-matched comps best support the ARV.
Projected returns pro-forma
10.0% appreciation · 3.0% rent growth · sell at horizon
- IRR
- 28.2%
- Equity multiple
- 3.23×
- Total profit
- $62,359
- Equity at exit
- $89,998
- IRR
- 24.5%
- Equity multiple
- 7.35×
- Total profit
- $177,581
- Equity at exit
- $194,084
Cash invested: $27,972 (down + closing). Projections, not guarantees.
Landlord ↔ Tenant lean methodology
- Overall (STATE)
- 83 Strongly Landlord-Friendly
- State Iowa
- 83 Strongly Landlord-Friendly · R+6
- County
- — inherits STATE
- City
- — inherits STATE
ZIP-level market 52042
- Home prices YoY
- 8.4%
- Active inventory
- 3
- Price-to-rent
- 7.3×
Monthly cashflow live
- Estimated rent
- $1,141 medium interval (Pro) →
- Mortgage (P&I)
- −$524
- Tax from tax record
- −$212 /mo · $2,548/yr
- Insurance
- −$42
- HOA
- −$0
- Vacancy / Maint / Mgmt
- −$240
- Net cashflow
- $124
Break-even live
UW: 25.0% down · 7.5% · 30yr · 1.5% tax · 5.0% vac · 8.0% maint · 8.0% mgmt
Financing live
Cash to close
- Down payment
- $24,975
- Closing costs
- $2,997
- Reserves months
- —
- Total cash needed
- —
Loan-product check · same deal, 3 products live
Conventional
25% down · 7.5% · 30yr
- Down + closing
- —
- Monthly P&I
- —
- Monthly cashflow
- —
- DSCR
- —
- Eligible?
- —
Personal DTI + credit; lowest rate.
DSCR
20% down · 8.5% · 30yr
- Down + closing
- —
- Monthly P&I
- —
- Monthly cashflow
- —
- DSCR
- —
- Eligible?
- —
No personal income docs; deal must DSCR.
Hard money
10% down · 12.0% · 12mo
- Down + closing
- —
- Monthly P&I
- —
- Monthly cashflow
- —
- DSCR
- —
- Eligible?
- —
Short-term bridge; refi at stabilization.
Listing history 7 events
-
2026-06-07statusdays on market $99,900 Pending 15 DOM
-
2026-06-04days on market $99,900 Active 14 DOM
-
2026-06-02days on market $99,900 Active 13 DOM
-
2026-06-01days on market $99,900 Active 12 DOM
-
2026-05-31days on market $99,900 Active 11 DOM
-
2026-05-31days on market $99,900 Active 10 DOM
-
2026-05-20$99,900 Active
ⓘ Source: listings_history table (triggers on properties + properties_extension) + one-shot
backfill from property_details.listing_events for pre-trigger history.
Tax reassessment forecast IA · Partial reset (capped growth)
- Current annual tax
- $2,548 · $212/mo
- Projected year-2 tax
- $2,548 · $212/mo
- Expected delta
- $0/yr ($0/mo · 0.0%)
ⓘ Screening estimate from a state-policy table — verify with the county assessor before closing.
Climate risk First Street
- Flood 1/10 Low FEMA zone X (unshaded) · 0% chance over 30 yrs
- Wildfire 1/10 Low
- Heat 2/10 Low 7 d/yr ≥99°F today · 15 d/yr by 30 yrs out
- Wind 2/10 Low
- Air quality 2/10 Low 0 unhealthy d/yr today · 1 by 30 yrs out
Nearby sold comps map
Loading sold comps map…
Walkable amenities ~0.75 mi
Loading nearby amenities…
Taxation est. · year 1
- Rental income
- $13,695
- − Mortgage interest
- −$5,596
- − Property taxes
- −$2,548
- − Insurance
- −$500
- − Repairs & maintenance
- −$1,096
- − Management
- −$1,096
- − Depreciation
- −$2,906
- Taxable loss
- −$46
- Est. tax savings @ 24.0%
- +$11
- After-tax cash flow
- $1,496/yr
For passive investors: Depreciation is non-cash, so a rental often shows a tax loss while cash-flowing — sheltering income. Rental losses are passive: they offset passive income freely, and up to $25,000/yr can offset ordinary (W-2) income if you actively participate and your MAGI is under $100k (phasing out to $0 by $150k); unused losses carry forward. On sale, claimed depreciation is recaptured at up to 25%, and gains may owe capital-gains tax (a 1031 exchange can defer both). Figures are a year-1 estimate at your 24.0% rate — not tax advice; consult a CPA.
Schools (NCES district)
- District
- Edgewood-Colesburg Community School District
- NCES district ID
- 1910500
- Math proficiency
- 68% ▼ -5.00%
- Reading proficiency
- 65% ▲ 8.00%
- Median HH income
- $52,197
- Composite
- 56.7/100
- National rank
- #1128
- State rank
- #178 of 289 in IA
Livability — Edgewood
- Score
- 69/100
- State rank
- #413
- US rank
- #8827
Category grades
Schools grade is shown separately in the Schools card above.
Census & demographics
- Census place
- Edgewood, IA
- Population (ZIP)
- 1,898
Population outlook (Clayton County) Hauer SSP2
- Today (2025)
- 16,656 people
- By 2030
- 15,986 · -4.0%
- By 2040
- 14,554 · -12.6%
- By 2050
- 13,187 · -20.8%
- By 2075
- 11,131 · -33.2%
- By 2100
- 9,733 · -41.6%
Race, ethnicity, and origin ACS 2023
- Neighborhood character
- Predominantly White (98%)
- Race & ethnicity
- White 98% Two or more races 2%
- Common ancestry
- Polish 19% Portuguese 2% Iranian 1%
- Foreign-born
- 1% · Canada
- Languages at home
- 74% English-only · German/W. Germanic 26% Other Indo-European 1%
Political lean MEDSL · Clayton
- 2024 margin
- Solid R (+34.5) · D 32.2% · R 66.7% · Other 1.2%
- 2008→2024 swing
- -51.7pp toward R · 2008: 17.2pp · 2024: -34.5pp
- All cycles
- 2024: R+34.5 2020: R+28.8 2016: R+22.8 2012: D+6.9 2008: D+17.2
Not yet ingested
- Civics
- —
Market trends
- HPI YoY
- ▲ 22.12%
- Current HPI
- 283.92
- Rent YoY
- —
- Metro
- —
- State GDP YoY
- ▲ 2.48%
- F500 in state
- 4
Industry mix (Fortune 500 HQ in IA)
| Industry | F500 HQs | Revenue |
|---|---|---|
| Financial Services | 1 | $16B |
|
||
| Retail / Convenience | 1 | $15B |
|
||
Price history
1 event — show timeline
- 2026-05-20 Listed $99,900 NEIRBR as distributed by MLS GRID
Property tax history
+4.9%/yrLatest (2025): $2,548 · +27.5% YoY. Source: county tax records.
Cash-flow waterfall
monthlySold comps — $/sqft
last 12 mo · ≤1 miLoading sold comps…