 6-Plex
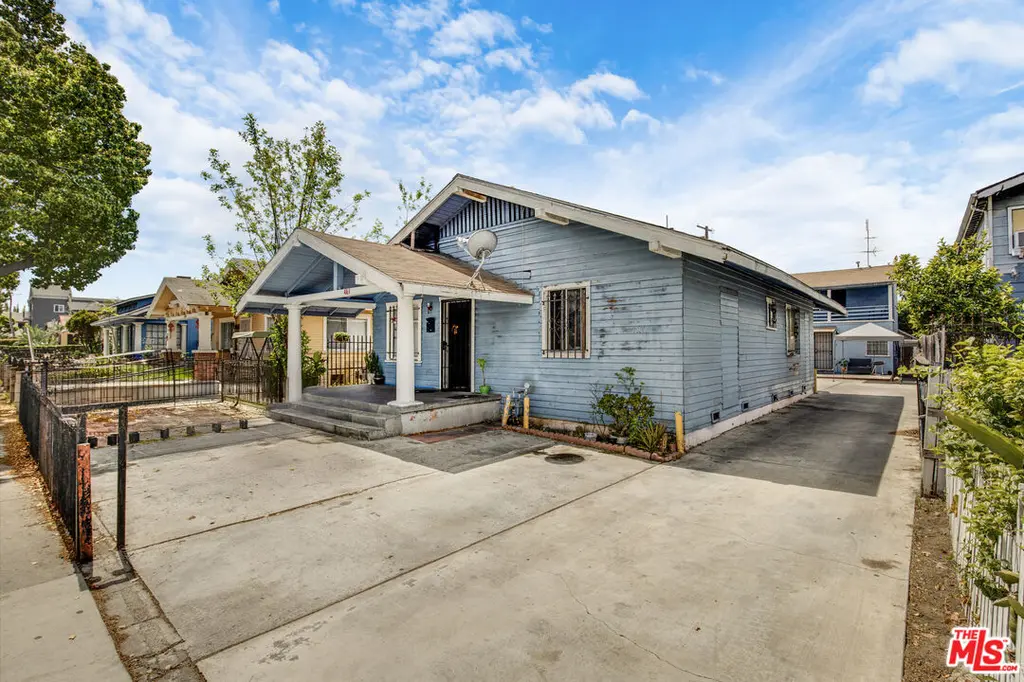
1081 Cherry Ave · Long Beach, CA
Flood risk 1/10 · Minimal
- FEMA flood zone
- X (unshaded)
- Chance of flooding over 30 yrs
- 0.0%
- Est. flood insurance / yr
- $507 – $1,088
Fire risk 1/10 · Minimal
- Est. fire insurance / yr
- $659 – $1,223
Heat risk 4/10 · Minor
- Hot days now (above 88°F)
- 7 days/yr
- Hot days in 30 yrs
- 24 days/yr
Wind risk 1/10 · Minimal
- Chance of severe wind over 30 yrs
- —
Air-quality risk 6/10 · Moderate
- Unhealthy air days now
- 9 days/yr
- Unhealthy air days in 30 yrs
- 10 days/yr
Risk factors via First Street. Map © Google.
Why this score? — see what drove the D grade
The composite is a weighted blend of 9 inputs, each scored 0–100. Each bar is that input's sub-score; the figure is the points it added to the 100-point composite (weight × sub-score).
- Cash flow +16.8/30.0
- ARV discount +7.1/15.0
- DSCR +5.2/10.0
- 1% rule +3.7/10.0
- Schools +3.7/10.0
- Livability +3.4/5.0
- Condition / age +2.5/5.0
- Rent growth +2.4/5.0
- Appreciation +0.0/10.0
$1,050,000
🖨 Deal sheet (PDF) 📄 Offer letter ✓ Due diligence
Multi-family units
County records classify this as Multi-Family (5+ Unit). Listing-text estimate: 6 units. confirmed
5+ unit building — per-unit beds/baths from public records are typically unavailable; the breakdown below (if shown) is an estimate from the listing text.
Listing remarks MLS
1081 Cherry Avenue presents investors with a rare opportunity to acquire a fully occupied, cash-flowing six-unit asset in Long Beach at a compelling 6.42% current cap rate with immediate upside on the table. Offered at $1,100,000, $183,333 per unit and $397 per square foot, this 1923 built property delivers strong in place income of $110,208 annually against a lean 33% expense ratio, producing a current NOI of $70,569 with a clear path to $92,263 at pro forma rents. The property consists of one two-bedroom one-bath unit and five studios across 2,773 square feet of building on a 6,187 square foot lot. All six units are occupied with tenants paying gas and electric, and the building features an on-site laundry facility and garage parking for the two-bedroom unit. Studios are currently averaging $1,272 per month against a market rent of $1,600, representing an 18% rental upside that a new owner can capture through natural turnover with no heavy lifting required. At pro forma rents the GRM compresses to 8.45 and the cap rate expands to 8.39%, both favorable against comparable sales in the submarket which are averaging a 6.09% cap rate and 11.06 GRM. For the value-add investor seeking strong in-place cash flow with meaningful upside ahead, 1081 Cherry Avenue delivers day-one income, a below-market rent profile with room to grow, and the kind of returns that get stronger over time as rents are pushed to market through natural turnover.
Key facts
- Six-unit asset
- Garage parking
- 6,187 sq ft lot
Tags
Neighborhood map
What this means for you Summary
Snapshot
- This is a 1×2bd/1ba + 5×1bd/1ba units multifamily listed at $1.05M.
Deal economics
- At list price, monthly cash flow is $680 ($8k/yr) — positive. Per door: $113/mo.
- The deal already cash-flows at list — no discount required.
- To meet the 1% rule (rent ≥ 1% of price), the offer needs to be $910k (13.3% below list).
- Recommended offer: $910k (13.3% below list) — sets the bar for 1% rule.
- Cap rate 7.1% vs local median 1.9% in Long Beach — top-decile yield for the area; either an underpriced asset or a hidden risk that comps aren't pricing in. Stress-test before assuming the spread holds.
Location & tenants
- Location reads 67/100 on livability (#319 in CA) — a middle-class / working-renter tenant base. Strengths: amenities A+, commute A+, employment B+; Watch: health & safety C-, crime F, cost of living F.
- Long Beach Unified (urban): math 34% / reading 50% proficiency, ranked #216 of 517 in CA (top 42%) — families likely to look elsewhere, expect single-tenant / working-renter base with shorter leases.
- Zoned schools: Lincoln Elementary (math 27%, 817 students, 75% FRL); Franklin Classical Middle (math 22% / reading 32%, grade F, #242 of 498 statewide, top 50%, 1,095 students, 76% FRL); Polytechnic High (math 54% / reading 72%, grade B-, #184 of 1,170 statewide, top 16%, 3,952 students, 54% FRL).
- Market conditions: Rents soft (-0.3%/yr); 83 active listings in the ZIP; 19,697 units permitted in Los Angeles County in 2024 (9,426 in 5+ unit buildings).
- At $9,101/mo this rent would consume 200% of the median local household income ($55k/yr) (locally 4941% of renters already pay >50% of income on rent) — very limited rent-growth headroom before tenants either downsize or default.
Forward outlook
- Local home prices are declining (-3.0%/yr); year-one equity from $7k of loan paydown is wiped out by about $32k of value loss. Plan a longer hold.
- Los Angeles County population projected at +9% by 2050 — modest demand growth; plan on rents tracking national, not racing it.
Negotiation context
- It's been on market 75 days — a 6% lower offer ($987k) is reasonable based on typical stale-listing flexibility.
- Current owner paid $286k; list at $1.05M implies a 267% gain — meaningful room to come down on a strong offer.
Risks & watch-outs
- Watch-outs: built in 1923 — expect roof / HVAC / electrical / plumbing capex.
Questions for the listing agent
- It's been on market 75 days. Have you received any prior offers? Is the seller open to a 13% concession, seller financing, or rate buy-down credit?
- Can we see the unit-by-unit rent roll, current vacancy, and any below-market leases? What's the average tenancy length?
- What capital expenditures (roof, boiler, parking lot, exteriors) have been made in the last 5 years, and what's planned in the next 2?
- Built in 1923 — when were the roof, HVAC, electrical panel, plumbing, and water heater last replaced?
- Why hasn't it sold? Are there any deal-killer items the seller is aware of (foundation, flood, title, zoning, code violations)?
- Is there a deadline driving the sale (1031 exchange, divorce, estate, relocation)? That informs how much negotiation room exists.
- Crime grade is F in this area — have there been break-ins, vandalism, or insurance claims at this property in the last 3 years? What carrier currently insures it and at what premium?
- The area grade is low — what's the realistic commute time and amenity access for the typical tenant pool here? Any planned neighborhood developments (good or bad) we should know about?
- What's the average days-on-market for RENTAL listings here right now (not sales)? A rising rental-DOM trend means longer vacancies and softer asking-rent achievability than the comps imply.
- What's the recent tenant-quality profile in this submarket — average credit score on applications, eviction rate, late-payment / NSF rate, and stable-employment percentage? A property-management company in the area should have these aggregated.
- How much new apartment / multifamily construction is in the pipeline within 1–3 miles? Heavy new supply (>2% of stock underway) typically softens rents 12–24 months out; light construction supports rent growth.
Investment metrics
- 1% rule
- 0.87% ✗
- Cap rate
- 7.07%
- Cash-on-cash
- 2.78%
- DSCR
- 1.12
- GRM
- 9.6
CMA / ARV
- ARV (median comp)
- $1,041,316
- List price
- $1,050,000
- Delta
- 0.83%
- Verdict
- FAIR
- Comps
- 20 within 1.0 mi
Projected returns pro-forma
-3.0% appreciation · 0.0% rent growth · sell at horizon
- IRR
- -15.1%
- Equity multiple
- 0.48×
- Total profit
- $-153,819
- Equity at exit
- $156,558
- IRR
- -11.9%
- Equity multiple
- 0.38×
- Total profit
- $-182,543
- Equity at exit
- $90,785
Cash invested: $294,000 (down + closing). Projections, not guarantees.
Landlord ↔ Tenant lean methodology
- Overall (STATE)
- 18 Strongly Tenant-Friendly
- State California
- 18 Strongly Tenant-Friendly · D+13
- County
- — inherits STATE
- City
- — inherits STATE
ZIP-level market 90813
- Rents YoY
- -0.3%
- Active inventory
- 83
- Price-to-rent
- 52.9×
Monthly cashflow live
- Estimated rent
- $9,101 high interval (Pro) →
- Mortgage (P&I)
- −$5,506
- Tax from tax record
- −$566 /mo · $6,790/yr
- Insurance
- −$438
- HOA
- −$0
- Vacancy / Maint / Mgmt
- −$1,911
- Net cashflow
- $680
Break-even live
Sensitivity live
| Price | -10% $1,275 | -5% $977 | +0% $680 | +5% $383 | +10% $86 |
|---|---|---|---|---|---|
| Rent | -10% $-39 | -5% $321 | +0% $680 | +5% $1,040 | +10% $1,399 |
| Rate | -1.0pp $1,209 | -0.5pp $947 | base $680 | +0.5pp $408 | +1.0pp $131 |
6-unit breakdown (identical units grouped — click to expand)
| Units | Beds | Baths | Est. rent |
|---|---|---|---|
| 1× unit | 2 | 1 | $1,654 |
| 5× units | 1 | 1 | $7,445 |
| #2 | 1 | 1 | $1,489 |
| #3 | 1 | 1 | $1,489 |
| #4 | 1 | 1 | $1,489 |
| #5 | 1 | 1 | $1,489 |
| #6 | 1 | 1 | $1,489 |
| Total (6 units) | $9,101 | ||
UW: 25.0% down · 7.5% · 30yr · 1.5% tax · 5.0% vac · 8.0% maint · 8.0% mgmt
Financing live
Cash to close
- Down payment
- $262,500
- Closing costs
- $31,500
- Reserves months
- —
- Total cash needed
- —
Loan-product check · same deal, 3 products live
Conventional
25% down · 7.5% · 30yr
- Down + closing
- —
- Monthly P&I
- —
- Monthly cashflow
- —
- DSCR
- —
- Eligible?
- —
Personal DTI + credit; lowest rate.
DSCR
20% down · 8.5% · 30yr
- Down + closing
- —
- Monthly P&I
- —
- Monthly cashflow
- —
- DSCR
- —
- Eligible?
- —
No personal income docs; deal must DSCR.
Hard money
10% down · 12.0% · 12mo
- Down + closing
- —
- Monthly P&I
- —
- Monthly cashflow
- —
- DSCR
- —
- Eligible?
- —
Short-term bridge; refi at stabilization.
Listing history 20 events
-
2026-06-21days on market $1,050,000 Active 75 DOM
-
2026-06-18days on market $1,050,000 Active 72 DOM
-
2026-06-17pricestatusdays on market $1,050,000 Active 71 DOM
-
2026-06-16days on market $1,100,000 Backup Offers Accepted 70 DOM
-
2026-06-15days on market $1,100,000 Backup Offers Accepted 69 DOM
-
2026-06-13days on market $1,100,000 Backup Offers Accepted 67 DOM
-
2026-06-13days on market $1,100,000 Backup Offers Accepted 66 DOM
-
2026-06-09days on market $1,100,000 Backup Offers Accepted 63 DOM
-
2026-06-08days on market $1,100,000 Backup Offers Accepted 62 DOM
-
2026-06-08status $1,100,000 Backup Offers Accepted 61 DOM
-
2026-06-07days on market $1,100,000 Active 61 DOM
-
2026-06-04days on market $1,100,000 Active 58 DOM
-
2026-06-03days on market $1,100,000 Active 57 DOM
-
2026-06-02days on market $1,100,000 Active 56 DOM
-
2026-06-01days on market $1,100,000 Active 55 DOM
-
2026-05-31days on market $1,100,000 Active 54 DOM
-
2026-05-19price $1,100,000 1453-char remark
Show marketing remark (1453 chars)
1081 Cherry Avenue presents investors with a rare opportunity to acquire a fully occupied, cash-flowing six-unit asset in Long Beach at a compelling 6.42% current cap rate with immediate upside on the table. Offered at $1,100,000, $183,333 per unit and $397 per square foot, this 1923 built property delivers strong in place income of $110,208 annually against a lean 33% expense ratio, producing a current NOI of $70,569 with a clear path to $92,263 at pro forma rents. The property consists of one two-bedroom one-bath unit and five studios across 2,773 square feet of building on a 6,187 square foot lot. All six units are occupied with tenants paying gas and electric, and the building features an on-site laundry facility and garage parking for the two-bedroom unit. Studios are currently averaging $1,272 per month against a market rent of $1,600, representing an 18% rental upside that a new owner can capture through natural turnover with no heavy lifting required. At pro forma rents the GRM compresses to 8.45 and the cap rate expands to 8.39%, both favorable against comparable sales in the submarket which are averaging a 6.09% cap rate and 11.06 GRM. For the value-add investor seeking strong in-place cash flow with meaningful upside ahead, 1081 Cherry Avenue delivers day-one income, a below-market rent profile with room to grow, and the kind of returns that get stronger over time as rents are pushed to market through natural turnover.
-
2026-04-07$1,150,000 Active 1453-char remark
Show marketing remark (1453 chars)
1081 Cherry Avenue presents investors with a rare opportunity to acquire a fully occupied, cash-flowing six-unit asset in Long Beach at a compelling 6.42% current cap rate with immediate upside on the table. Offered at $1,100,000, $183,333 per unit and $397 per square foot, this 1923 built property delivers strong in place income of $110,208 annually against a lean 33% expense ratio, producing a current NOI of $70,569 with a clear path to $92,263 at pro forma rents. The property consists of one two-bedroom one-bath unit and five studios across 2,773 square feet of building on a 6,187 square foot lot. All six units are occupied with tenants paying gas and electric, and the building features an on-site laundry facility and garage parking for the two-bedroom unit. Studios are currently averaging $1,272 per month against a market rent of $1,600, representing an 18% rental upside that a new owner can capture through natural turnover with no heavy lifting required. At pro forma rents the GRM compresses to 8.45 and the cap rate expands to 8.39%, both favorable against comparable sales in the submarket which are averaging a 6.09% cap rate and 11.06 GRM. For the value-add investor seeking strong in-place cash flow with meaningful upside ahead, 1081 Cherry Avenue delivers day-one income, a below-market rent profile with room to grow, and the kind of returns that get stronger over time as rents are pushed to market through natural turnover.
-
1989-05-02soldstatus $286,040
-
1982-11-23soldstatus $130,000
ⓘ Source: listings_history table (triggers on properties + properties_extension) + one-shot
backfill from property_details.listing_events for pre-trigger history.
Tax reassessment forecast CA · Resets to sale price
- Current annual tax
- $6,790 · $566/mo
- Projected year-2 tax
- $7,980 · $665/mo
- Expected delta
- +$1,190/yr (+$99/mo · 17.5%)
ⓘ Screening estimate from a state-policy table — verify with the county assessor before closing.
Climate risk First Street
- Flood 1/10 Low FEMA zone X (unshaded) · 0% chance over 30 yrs
- Wildfire 1/10 Low
- Heat 4/10 Moderate 7 d/yr ≥88°F today · 24 d/yr by 30 yrs out
- Wind 1/10 Low
- Air quality 6/10 Major 9 unhealthy d/yr today · 10 by 30 yrs out
Nearby sold comps map
Loading sold comps map…
Walkable amenities ~0.75 mi
Loading nearby amenities…
Taxation est. · year 1
- Rental income
- $109,212
- − Mortgage interest
- −$58,816
- − Property taxes
- −$6,790
- − Insurance
- −$5,250
- − Repairs & maintenance
- −$8,737
- − Management
- −$8,737
- − Depreciation
- −$30,545
- Taxable loss
- −$9,664
- Est. tax savings @ 24.0%
- +$2,319
- After-tax cash flow
- $10,481/yr
For passive investors: Depreciation is non-cash, so a rental often shows a tax loss while cash-flowing — sheltering income. Rental losses are passive: they offset passive income freely, and up to $25,000/yr can offset ordinary (W-2) income if you actively participate and your MAGI is under $100k (phasing out to $0 by $150k); unused losses carry forward. On sale, claimed depreciation is recaptured at up to 25%, and gains may owe capital-gains tax (a 1031 exchange can defer both). Figures are a year-1 estimate at your 24.0% rate — not tax advice; consult a CPA.
Schools (NCES district)
- District
- Long Beach Unified
- NCES district ID
- 0622500
- Math proficiency
- 34% ▼ -11.00%
- Reading proficiency
- 50% ▼ -4.00%
- Median HH income
- $56,092
- Composite
- 36.67/100
- National rank
- #4607
- State rank
- #216 of 517 in CA
Livability — Long Beach
- Score
- 67/100
- State rank
- #319
- US rank
- #10758
Category grades
Schools grade is shown separately in the Schools card above.
Census & demographics
- Census place
- Long Beach, CA
- County
- Los Angeles County · 9,444,647 people
- City population
- 466,088
- Metro
- Los Angeles-Long Beach-Anaheim, CA
- Population (ZIP)
- 51,241
- Household income
- $54,526
- Rent vs Own
- Severe rent burden
- 4941.0
Population outlook (Los Angeles County) Hauer SSP2
- Today (2025)
- 10,940,515 people
- By 2030
- 11,256,481 · +2.9%
- By 2040
- 11,729,929 · +7.2%
- By 2050
- 11,948,407 · +9.2%
- By 2075
- 11,818,114 · +8.0%
- By 2100
- 10,842,928 · -0.9%
Race, ethnicity, and origin ACS 2023
- Neighborhood character
- Diverse neighborhood (Simpson 0.55)
- Race & ethnicity
- Hispanic / Latino 64% Two or more races 13% Asian 12% Black 11% White 9% Native American 2%
- Hispanic origin (detail)
- Mexican 53%
- Common ancestry
- Lithuanian 1% Serbian 1%
- Foreign-born
- 36% · Canada, South Korea, Vietnam
- Languages at home
- 33% English-only · Spanish 56% Other Asian/Pacific 6% Tagalog/Filipino 1%
Political lean MEDSL · Los Angeles
- 2024 margin
- Solid D (+32.9) · D 64.8% · R 31.9% · Other 3.3%
- 2008→2024 swing
- -7.4pp toward R · 2008: 40.4pp · 2024: 32.9pp
- All cycles
- 2024: D+32.9 2020: D+44.2 2016: D+48.0 2012: D+40.0 2008: D+40.4
Not yet ingested
- Civics
- —
Market trends
- HPI YoY
- ▼ -468.88%
- Current HPI
- 480.8118
- Rent YoY
- ▼ -0.34%
- Metro
- Los Angeles-Long Beach-Anaheim, CA
- State GDP YoY
- ▲ 3.21%
- F500 in state
- 116
Industry mix (Fortune 500 HQ in CA)
| Industry | F500 HQs | Revenue |
|---|---|---|
| Technology | 27 | $1,492B |
|
||
| Financial Services | 3 | $174B |
|
||
| Retail | 3 | $44B |
|
||
| Insurance | 3 | $26B |
|
||
| Media / Entertainment | 2 | $115B |
|
||
| Pharmaceuticals / Biotech | 2 | $62B |
|
||
Price history
+746.2% since first listed4 events — show timeline
- 2026-05-19 Price Changed $1,100,000 TheMLS
- 2026-04-07 Listed $1,150,000 TheMLS
- 1989-05-02 Sold (Public Records) $286,040 Public Records
- 1982-11-23 Sold (Public Records) $130,000 Public Records
Property tax history
+2.8%/yrLatest (2025): $6,790 · +4.5% YoY. Source: county tax records.
Cash-flow waterfall
monthlySold comps — $/sqft
last 12 mo · ≤1 miLoading sold comps…