664 Forsyth St #6 · Boca Raton, FL
Flood risk 4/10 · Minor
- FEMA flood zone
- X (unshaded)
- Chance of flooding over 30 yrs
- 0.22%
- Est. flood insurance / yr
- $507 – $1,088
Fire risk 1/10 · Minimal
- Est. fire insurance / yr
- $947 – $1,759
Heat risk 10/10 · Severe
- Hot days now (above 106°F)
- 7 days/yr
- Hot days in 30 yrs
- 26 days/yr
Wind risk 10/10 · Severe
- Chance of severe wind over 30 yrs
- 99.0%
Air-quality risk 3/10 · Minor
- Unhealthy air days now
- 2 days/yr
- Unhealthy air days in 30 yrs
- 3 days/yr
Risk factors via First Street. Map © Google.
Why this score? — see what drove the D grade
The composite is a weighted blend of 9 inputs, each scored 0–100. Each bar is that input's sub-score; the figure is the points it added to the 100-point composite (weight × sub-score).
- Cash flow +10.8/30.0
- ARV discount +7.5/15.0
- 1% rule +5.0/10.0
- Schools +4.3/10.0
- Livability +3.9/5.0
- Rent growth +3.4/5.0
- DSCR +3.1/10.0
- Condition / age +2.5/5.0
- Appreciation +0.0/10.0
$495,000
🖨 Deal sheet (PDF) 📄 Offer letter ✓ Due diligence
Listing remarks MLS
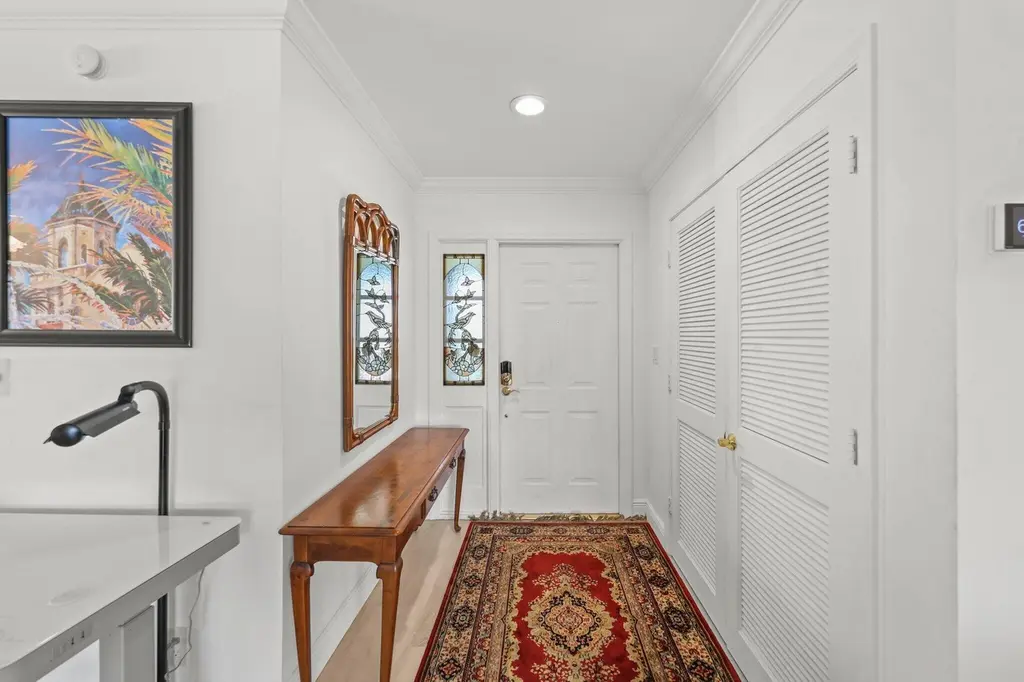
Outstanding bright open floor plan. Oversized screened patio overlooking tropical garden and pool. Unique complex with only 7 units. Great East Boca location near shopping, beaches, I95, and resturants. Hurricane shutters, priv. carport + storage
Key facts
- $900 HOA
- 10 parking spots
- Community pool
Property features AI
Finance
- Other: Association amenities listed as Other
- HOA & community: Association: FORSYTH PARK; Monthly HOA fee of $900; HOA covers insurance, grounds maintenance, common areas, common real estate tax, reserve funds, and pool service; Pets not allowed
Exterior
- Parking: 10 total parking spaces; Detached carport with 1 covered space; 2 open parking spaces; Asphalt parking surfaces
- Utilities: Public water; Public sewer; Cable available; Electricity available; Phone connected; Water connected; Sewer connected
- Home design: Condominium; One level (single-level unit); North-facing
- Construction: Concrete block construction with stucco; Tile roof with wood truss/rafter; Built as a resale property; 2-story building (unit is single-level)
- Exterior features: No waterfront; Community of 7 units
Interior
- Kitchen: Kitchen island; Dishwasher; Electric range; Microwave; Refrigerator; Freezer; Disposal; Tankless water heater
- Bedrooms: 2 bedrooms on the main level
- Flooring: Tile; Engineered wood
- Bathrooms: 2 full bathrooms, both on the main level
- Heating & cooling: Heat pump heating (central individual); Central air conditioning (heat pump)
- Interior features: Entrance foyer; High ceilings; Kitchen island; Vaulted ceilings; Walk-in closets; Split bedroom layout; Roman tub
- Laundry & utility: Laundry area in kitchen
Neighborhood map
What this means for you Summary
Snapshot
- This is a 2-bed/2.0-bath condo listed at $495k.
Deal economics
- At list price, monthly cash flow is $-227 ($-3k/yr) — negative.
- To cash-flow at today's rent, offer at most $455k (8.1% below list).
- To meet the 1% rule (rent ≥ 1% of price), the offer needs to be $493k (0.4% below list).
- Recommended offer: $455k (8.1% below list) — sets the bar for cash-flow.
- Cap rate 5.7% vs local median 2.7% in Boca Raton — top-decile yield for the area; either an underpriced asset or a hidden risk that comps aren't pricing in. Stress-test before assuming the spread holds.
Location & tenants
- Location reads 77/100 on livability (#192 in FL, #3,070 nationally) — a middle-class / working-renter tenant base. Strengths: employment A+, health & safety A+, crime B+; Watch: amenities D, cost of living F.
- Palm Beach (suburban): math 46% / reading 53% proficiency, ranked #34 of 73 in FL (top 47%) — families likely to look elsewhere, expect single-tenant / working-renter base with shorter leases.
- Zoned schools: J. C. Mitchell Elementary School (math 54% / reading 60%, grade C+, #781 of 2,144 statewide, top 38%, 773 students, 50% FRL); Boca Raton Community Middle School (math 59% / reading 61%, grade B, #135 of 571 statewide, top 24%, 1,225 students, 41% FRL); West Boca Raton High School (math 55% / reading 70%, grade B-, #93 of 667 statewide, top 14%, 2,271 students, 28% FRL).
- Market conditions: Rents rising (+3.6%/yr); 338 active listings in the ZIP; 40 comparable units currently listed for rent nearby; rentals at typical pace (median 20d on market — plan ~3-4 weeks tenant-placement turnaround); solid renter incomes; 3,974 units permitted in Palm Beach County in 2024 (1,012 in 5+ unit buildings).
- At $4,931/mo this rent would consume 62% of the median local household income ($96k/yr) (locally 896% of renters already pay >50% of income on rent) — very limited rent-growth headroom before tenants either downsize or default.
Forward outlook
- Local home prices are declining (-3.0%/yr); year-one equity from $3k of loan paydown is wiped out by about $15k of value loss. Plan a longer hold.
- Palm Beach County population projected at +30% by 2050 — long-run rental-demand tailwind backs the buy-and-hold thesis.
Negotiation context
- It's been on market 86 days — a 6% lower offer ($465k) is reasonable based on typical stale-listing flexibility.
- 2 sale attempts since 15y ago; this cycle's ask has dropped $61k (11%) from the opening price — seller is motivated, your offer sets the floor, not the list.
- Current owner paid $162k; list at $495k implies a 205% gain — meaningful room to come down on a strong offer.
Risks & watch-outs
- Climate carrying-cost: severe wind risk, 99% chance of damaging wind over 30y; extreme-heat days projected 7→26/yr by 2055 (HVAC capex compounding) — expect insurance premiums to compound above CPI over the hold.
Questions for the listing agent
- What do current leases actually rent for vs. the listed asking? Can we see a recent rent roll and the last 12 months of T-12 income?
- It's been on market 86 days. Have you received any prior offers? Is the seller open to a 8% concession, seller financing, or rate buy-down credit?
- What does the HOA fee cover, when was the last increase, and are there any pending special assessments or reserve-fund shortfalls?
- Any open or pending special assessments — roof, HVAC, plumbing, elevator, façade? What's the per-unit balance and payoff schedule, and is the seller paying it off at close or rolling it to the buyer?
- Why hasn't it sold? Are there any deal-killer items the seller is aware of (foundation, flood, title, zoning, code violations)?
- Is there a deadline driving the sale (1031 exchange, divorce, estate, relocation)? That informs how much negotiation room exists.
- Schools are A-rated — typically a magnet for longer-tenancy family renters. What's the average tenant stay here, and is there a school-zone premium baked into asking?
- The area grade is low — what's the realistic commute time and amenity access for the typical tenant pool here? Any planned neighborhood developments (good or bad) we should know about?
- What's the average days-on-market for RENTAL listings here right now (not sales)? A rising rental-DOM trend means longer vacancies and softer asking-rent achievability than the comps imply.
- What's the recent tenant-quality profile in this submarket — average credit score on applications, eviction rate, late-payment / NSF rate, and stable-employment percentage? A property-management company in the area should have these aggregated.
- How much new apartment / multifamily construction is in the pipeline within 1–3 miles? Heavy new supply (>2% of stock underway) typically softens rents 12–24 months out; light construction supports rent growth.
Investment metrics
- 1% rule
- 1.00% ✗
- Cap rate
- 5.74%
- Cash-on-cash
- -1.96%
- DSCR
- 0.91
- GRM
- 8.4
CMA / ARV
No comps found within radius.
Projected returns pro-forma
-3.0% appreciation · 3.58% rent growth · sell at horizon
- IRR
- -18.6%
- Equity multiple
- 0.34×
- Total profit
- $-91,252
- Equity at exit
- $73,806
- IRR
- -9.5%
- Equity multiple
- 0.39×
- Total profit
- $-83,985
- Equity at exit
- $42,799
Cash invested: $138,600 (down + closing). Projections, not guarantees.
Landlord ↔ Tenant lean methodology
- Overall (STATE)
- 87 Strongly Landlord-Friendly
- State Florida
- 87 Strongly Landlord-Friendly · R+3
- County
- — inherits STATE
- City
- — inherits STATE
ZIP-level market 33487
- Rents YoY
- 3.6%
- Active inventory
- 338
- Price-to-rent
- 8.4×
Monthly cashflow live
- Estimated rent
- $4,931 high interval (Pro) →
- Mortgage (P&I)
- −$2,596
- Tax from tax record
- −$420 /mo · $5,043/yr
- Insurance
- −$206
- HOA
- −$900
- Vacancy / Maint / Mgmt
- −$1,036
- Net cashflow
- $-227
Break-even live
Sensitivity live
| Price | -10% $53 | -5% $-87 | +0% $-227 | +5% $-367 | +10% $-507 |
|---|---|---|---|---|---|
| Rent | -10% $-616 | -5% $-422 | +0% $-227 | +5% $-32 | +10% $163 |
| Rate | -1.0pp $23 | -0.5pp $-101 | base $-227 | +0.5pp $-355 | +1.0pp $-485 |
UW: 25.0% down · 7.5% · 30yr · 1.5% tax · 5.0% vac · 8.0% maint · 8.0% mgmt
Financing live
Cash to close
- Down payment
- $123,750
- Closing costs
- $14,850
- Reserves months
- —
- Total cash needed
- —
Loan-product check · same deal, 3 products live
Conventional
25% down · 7.5% · 30yr
- Down + closing
- —
- Monthly P&I
- —
- Monthly cashflow
- —
- DSCR
- —
- Eligible?
- —
Personal DTI + credit; lowest rate.
DSCR
20% down · 8.5% · 30yr
- Down + closing
- —
- Monthly P&I
- —
- Monthly cashflow
- —
- DSCR
- —
- Eligible?
- —
No personal income docs; deal must DSCR.
Hard money
10% down · 12.0% · 12mo
- Down + closing
- —
- Monthly P&I
- —
- Monthly cashflow
- —
- DSCR
- —
- Eligible?
- —
Short-term bridge; refi at stabilization.
Rent comps 40 comps
| Address | Beds | Baths | Sqft | Rent | $/sqft | DOM | Units | Dist |
|---|---|---|---|---|---|---|---|---|
| 713 Forsyth St Boca Raton, FL | 3.0 | 2.0 | 1626 | $16,500 | $10.15 | 17d | 1 | 0.10mi |
| 713 Forsyth St Unit 33487 Boca Raton, FL | 3.0 | 2.0 | 1626 | $16,500 | $10.15 | 23d | 1 | 0.10mi |
| 255 Glouchester St Boca Raton, FL | 3.0 | 2.0 | 1470 | $3,950 | $2.69 | 26d | 1 | 0.19mi |
| 660 Coventry St Unit 6 Boca Raton, FL | 3.0 | 2.5 | 1800 | $3,500 | $1.94 | 10d | 1 | 0.21mi |
| 799 Jeffery St Unit 0 Boca Raton, FL | 2.0 | 2.0 | 1420 | $4,800 | $3.38 | 7d | 1 | 0.29mi |
| 800 Jeffery St #409 Boca Raton, FL | 2.0 | 2.0 | 1583 | $3,700 | $2.34 | 4d | 1 | 0.31mi |
| 831 Dover St Boca Raton, FL | 3.0 | 2.5 | 2230 | $29,000 | $13.00 | 1d | 1 | 0.32mi |
| 859 Jeffery St #506 Boca Raton, FL | 2.0 | 2.0 | 1315 | $6,500 | $4.94 | 26d | 1 | 0.32mi |
| 380 Kingsbridge St Boca Raton, FL | 3.0 | 2.0 | 1800 | $2,549 | $1.42 | 26d | 1 | 0.34mi |
| 701 Appleby St Boca Raton, FL | 3.0 | 2.0 | 1552 | $7,800 | $5.03 | 21d | 1 | 0.36mi |
| 701 Appleby St Boca Raton, FL | 3.0 | 2.0 | 1552 | $7,800 | $5.03 | 4d | 1 | 0.36mi |
| 899 Jeffery St #5100 Boca Raton, FL | 2.0 | 2.0 | 1315 | $5,000 | $3.80 | 26d | 1 | 0.37mi |
| 899 Jeffery St #714 Boca Raton, FL | 3.0 | 2.0 | 1682 | $6,500 | $3.86 | 19d | 1 | 0.37mi |
| 1038 Jeffery St Boca Raton, FL | 3.0 | 2.5 | 1398 | $6,800 | $4.86 | 26d | 1 | 0.38mi |
| 740 NE 69th St Boca Raton, FL | 3.0 | 2.0 | 1540 | $9,400 | $6.10 | 26d | 1 | 0.41mi |
| 6951 NE 7th Ave Boca Raton, FL | 3.0 | 2.0 | 2137 | $10,000 | $4.68 | 19d | 1 | 0.42mi |
| 210 NE 69th Cir Boca Raton, FL | 3.0 | 2.5 | 2043 | $4,200 | $2.06 | 26d | 1 | 0.45mi |
| 6991 NE 7th Ave Boca Raton, FL | 3.0 | 2.0 | 1854 | $8,000 | $4.31 | 19d | 1 | 0.46mi |
| 3912 S Ocean Blvd Highland Beach, FL | 1.0–3.0 | 1.5–3.0 | 1427 | $5,450 | $3.82 | 4d | 4 | 0.46mi |
| 6000 NW 2nd Ave #437 Boca Raton, FL | 2.0 | 2.0 | 1300 | $2,500 | $1.92 | 17d | 1 | 0.48mi |
| 6500 NW 2nd Ave Unit 311 Boca Raton, FL | 3.0 | 2.0 | 1316 | $2,850 | $2.17 | 5d | 1 | 0.49mi |
| 6461 NW 2nd Ave Boca Raton, FL | 2.0 | 2.0 | 1300 | $2,148 | $1.65 | 26d | 2 | 0.50mi |
| 6461 NW 2nd Ave Boca Raton, FL | 2.0 | 2.0 | 1175 | $2,238 | $1.90 | 1d | 2 | 0.50mi |
| 6500 NW 2nd Ave #512 Boca Raton, FL | 2.0 | 2.0 | 1316 | $2,800 | $2.13 | 26d | 1 | 0.50mi |
| 6161 NW 2nd Ave Boca Raton, FL | 2.0 | 2.0 | 1200 | $2,200 | $1.83 | 1d | 1 | 0.50mi |
| 6161 NW 2nd Ave Unit 520 Boca Raton, FL | 2.0 | 2.0 | 1200 | $2,195 | $1.83 | 26d | 1 | 0.50mi |
| 5961 NW 2nd Ave Apt 108 Boca Raton, FL | 2.0 | 2.0 | 1050 | $2,400 | $2.29 | 10d | 1 | 0.52mi |
| 7060 NW Turtle Walk Boca Raton, FL | 3.0 | 3.0 | 2031 | $4,900 | $2.41 | 7d | 1 | 0.58mi |
| 817 NE 71st St Boca Raton, FL | 3.0 | 2.0 | 1300 | $10,000 | $7.69 | 6d | 1 | 0.58mi |
| 1124 Highland Beach Dr #2 Highland Beach, FL | 2.0 | 2.0 | 1408 | $5,750 | $4.08 | 26d | 1 | 0.59mi |
| 6850 NW 2nd Ave #18 Boca Raton, FL | 2.0 | 2.0 | 1420 | $3,300 | $2.32 | 23d | 1 | 0.60mi |
| 3740 S Ocean Blvd Unit 108B Highland Beach, FL | 2.0 | 2.5 | 1837 | $9,500 | $5.17 | 21d | 1 | 0.60mi |
| 149 NW 70th St Unit 101C Boca Raton, FL | 2.0 | 2.5 | 1300 | $2,750 | $2.12 | 26d | 1 | 0.63mi |
| 836 NE 72nd St Boca Raton, FL | 3.0 | 3.0 | 1815 | $12,500 | $6.89 | 10d | 1 | 0.63mi |
| 5700 NW 2nd Ave Boca Raton, FL | 2.0–3.0 | 2.0 | 1125 | $2,200 | $1.96 | 1d | 4 | 0.64mi |
| 5700 NW 2nd Ave Boca Raton, FL | 2.0 | 2.0 | 1125 | $2,162 | $1.92 | 23d | 4 | 0.64mi |
| 3700 S Ocean Blvd #308 Highland Beach, FL | 2.0 | 2.5 | 2231 | $8,000 | $3.59 | 26d | 1 | 0.64mi |
| 3700 S Ocean Blvd #202 Highland Beach, FL | 2.0 | 2.5 | 2231 | $11,500 | $5.15 | 26d | 1 | 0.64mi |
| 3602 S Ocean Blvd #104 Highland Beach, FL | 3.0 | 3.0 | 1495 | $8,950 | $5.99 | 7d | 1 | 0.65mi |
| 5500 NW 2nd Ave #514 Boca Raton, FL | 3.0 | 2.0 | 1200 | $2,900 | $2.42 | 17d | 1 | 0.67mi |
HOA detail condo
- Monthly dues
- $900 · $10,800/yr
- Likely covers
- pool
- Assessments
- None detected in remarks — confirm with the listing agent.
Listing history 8 events
-
2026-06-21days on market $495,000 Active 86 DOM
-
2026-06-18days on market $495,000 Active 83 DOM
-
2026-06-17days on market $495,000 Active 82 DOM
-
2026-06-16days on market $495,000 Active 81 DOM
-
2026-06-15days on market $495,000 Active 80 DOM
-
2026-06-13days on market $495,000 Active 78 DOM
-
2026-06-10remarks 677-char remark
-
2026-06-10$495,000 Active 74 DOM
ⓘ Source: listings_history table (triggers on properties + properties_extension) + one-shot
backfill from property_details.listing_events for pre-trigger history.
Tax reassessment forecast FL · Resets to sale price
- Current annual tax
- $5,043 · $420/mo
- Projected year-2 tax
- $5,043 · $420/mo
- Expected delta
- $0/yr ($0/mo · 0.0%)
ⓘ Screening estimate from a state-policy table — verify with the county assessor before closing.
Climate risk First Street
- Flood 4/10 Moderate FEMA zone X (unshaded) · 22% chance over 30 yrs
- Wildfire 1/10 Low
- Heat 10/10 Extreme 7 d/yr ≥106°F today · 26 d/yr by 30 yrs out
- Wind 10/10 Extreme 99% chance of damaging wind over 30 yrs
- Air quality 3/10 Moderate 2 unhealthy d/yr today · 3 by 30 yrs out
Nearby sold comps map
Loading sold comps map…
Walkable amenities ~0.75 mi
Loading nearby amenities…
Taxation est. · year 1
- Rental income
- $59,174
- − Mortgage interest
- −$27,728
- − Property taxes
- −$5,043
- − Insurance
- −$2,475
- − Repairs & maintenance
- −$4,734
- − Management
- −$4,734
- − HOA
- −$10,800
- − Depreciation
- −$14,400
- Taxable loss
- −$10,740
- Est. tax savings @ 24.0%
- +$2,578
- After-tax cash flow
- $-143/yr
For passive investors: Depreciation is non-cash, so a rental often shows a tax loss while cash-flowing — sheltering income. Rental losses are passive: they offset passive income freely, and up to $25,000/yr can offset ordinary (W-2) income if you actively participate and your MAGI is under $100k (phasing out to $0 by $150k); unused losses carry forward. On sale, claimed depreciation is recaptured at up to 25%, and gains may owe capital-gains tax (a 1031 exchange can defer both). Figures are a year-1 estimate at your 24.0% rate — not tax advice; consult a CPA.
Schools (NCES district)
- District
- Palm Beach
- NCES district ID
- 1201500
- Math proficiency
- 46% ▼ -16.00%
- Reading proficiency
- 53% ▼ -4.00%
- Median HH income
- $53,943
- Composite
- 42.72/100
- National rank
- #3160
- State rank
- #34 of 73 in FL
Livability — Boca Raton
- Score
- 77/100
- State rank
- #192
- US rank
- #3070
Category grades
Schools grade is shown separately in the Schools card above.
Census & demographics
- Census place
- Boca Raton, FL
- County
- Palm Beach County · 1,438,312 people
- City population
- 250,102
- Metro
- Miami-Fort Lauderdale-Pompano Beach, FL
- Population (ZIP)
- 20,717
- Household income
- $96,066
- Rent vs Own
- Severe rent burden
- 896.0
Population outlook (Palm Beach County) Hauer SSP2
- Today (2025)
- 1,637,487 people
- By 2030
- 1,743,255 · +6.5%
- By 2040
- 1,948,712 · +19.0%
- By 2050
- 2,132,979 · +30.3%
- By 2075
- 2,530,027 · +54.5%
- By 2100
- 2,706,979 · +65.3%
Race, ethnicity, and origin ACS 2023
- Neighborhood character
- Predominantly White (75%)
- Race & ethnicity
- White 75% Hispanic / Latino 13% Two or more races 11% Black 4% Asian 2%
- Hispanic origin (detail)
- Mexican 2% Puerto Rican 1% Cuban 1%
- Common ancestry
- Romanian 7% Scotch-Irish 5% Lithuanian 2%
- Foreign-born
- 21% · Canada, Jamaica, China
- Languages at home
- 77% English-only · Spanish 10% Other Indo-European 4% Russian/Polish/Slavic 3%
Political lean MEDSL · Palm Beach
- 2024 margin
- Toss-up / Even · D 50.0% · R 49.2%
- 2008→2024 swing
- -22.1pp toward R · 2008: 22.9pp · 2024: 0.8pp
- All cycles
- 2024: D+0.8 2020: D+12.8 2016: D+15.3 2012: D+17.0 2008: D+22.9
Not yet ingested
- Civics
- —
Market trends
- HPI YoY
- ▼ -331.59%
- Current HPI
- 352.5852
- Rent YoY
- ▲ 3.58%
- Metro
- Miami-Fort Lauderdale-Pompano Beach, FL
- State GDP YoY
- ▲ 3.28%
- F500 in state
- 36
Industry mix (Fortune 500 HQ in FL)
| Industry | F500 HQs | Revenue |
|---|---|---|
| Industrial Technology | 2 | $29B |
|
||
| Insurance | 2 | $17B |
|
||
| Retail | 1 | $60B |
|
||
| Technology Distribution | 1 | $58B |
|
||
| Homebuilding | 1 | $35B |
|
||
| Technology Manufacturing | 1 | $35B |
|
||
Price history
+366.1% since first listed10 events — show timeline
- 2026-06-04 Price Changed $495,000 Beaches MLS
- 2026-06-04 Price Changed $499,000 Beaches MLS
- 2026-05-04 Price Changed $539,000 Beaches MLS
- 2026-03-27 Listed $556,000 Beaches MLS
- 2011-04-27 Sold (Public Records) $162,500 Public Records
- 2011-04-21 Sold (MLS) $162,500 Beaches MLS
- 2011-04-04 Listing Removed — Beaches MLS
- 2011-01-21 Listed $169,900 Beaches MLS
- 1987-12-01 Sold (Public Records) $119,200 Public Records
- 1984-08-01 Sold (Public Records) $106,200 Public Records
Property tax history
+8.2%/yrLatest (2025): $5,043 · -5.6% YoY. Source: county tax records.
Cash-flow waterfall
monthlySold comps — $/sqft
last 12 mo · ≤1 miLoading sold comps…