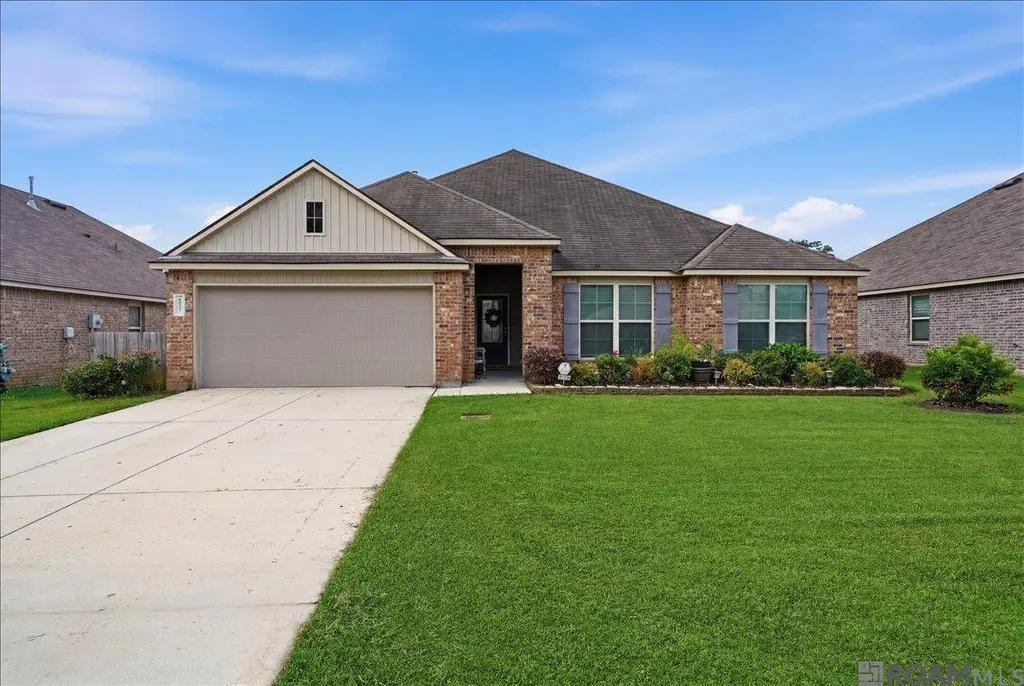
19298 Providence Ridge Blvd · Hammond, LA
Flood risk No data
- FEMA flood zone
- —
- Chance of flooding over 30 yrs
- —
- Est. flood insurance / yr
- —
Fire risk No data
- Est. fire insurance / yr
- —
Heat risk No data
- Hot days now (above threshold)
- —
- Hot days in 30 yrs
- —
Wind risk No data
- Chance of severe wind over 30 yrs
- —
Air-quality risk No data
- Unhealthy air days now
- —
- Unhealthy air days in 30 yrs
- —
Risk factors via First Street. Map © Google.
Why this score? — see what drove the D- grade
The composite is a weighted blend of 9 inputs, each scored 0–100. Each bar is that input's sub-score; the figure is the points it added to the 100-point composite (weight × sub-score).
- Cash flow +14.2/30.0
- ARV discount +7.7/15.0
- DSCR +4.3/10.0
- Livability +3.5/5.0
- 1% rule +3.0/10.0
- Rent growth +2.6/5.0
- Condition / age +2.5/5.0
- Schools +2.0/10.0
- Appreciation +0.0/10.0
$319,000
🖨 Deal sheet (PDF) 📄 Offer letter ✓ Due diligence
Listing remarks MLS
Welcome home to this beautifully maintained 4-bedroom, 3-bath residence in the highly desirable Providence Ridge community! Offering 2,482 square feet of thoughtfully designed living space, this spacious split-floor plan combines comfort, functionality, and modern conveniences. Step inside to discover an open-concept layout with an effortless flow. The inviting living room features luxury vinyl plank flooring, a wall of windows that fills the space with natural light, and seamless access to the kitchen and breakfast area. The chef-inspired kitchen is sure to impress with its large granite island, granite countertops, subway tile backsplash, gas range, stainless steel appliances, pantry, and recessed lighting. Whether preparing family meals or hosting guests, this kitchen is designed to be the heart of the home. The generously sized bedrooms provide plenty of space for family and guests, while the private primary suite offers a relaxing retreat complete with an en suite bath featuring a granite vanity and a garden soaking tub/shower combination. This home is packed with valuable upgrades, including a smart home system, security system, whole-home generator, and two hot water heaters--ensuring comfort, convenience, & peace of mind year-round. Energy-efficient features help keep utility costs manageable, and the home has never flooded. Outside, you'll find a large fenced backyard with three gates, providing ample space for outdoor activities, pets, and entertaining. Enjoy relaxing evenings on the covered porch or take advantage of the neighborhood amenities, including a large park, playground, and sidewalks just steps away. With its exceptional floor plan, modern upgrades, and desirable location, this home truly has it all. Schedule your private showing. Photos are edited by a professional photo editor for marketing purposes. Some photos may have Ai Generated Furniture in the homes for visualization purposes.
Key facts
- Large granite island
- Granite countertops
- Gas range
Tags
Property features AI
Finance
- Other: Located in Providence Ridge subdivision
- HOA & community: Homeowners association with management; Annual association fee of $450 (approximately $37.50/month); Community playground
Exterior
- Parking: Garage with 2 parking spaces
- Security: Smoke detectors
- Utilities: Public water; Public sewer; Cable connected
- Home design: Residential detached single-family home
- Construction: Vinyl siding, frame and brick construction; Slab foundation; Composition roof; Built on a level lot
- Exterior features: Porch; Exterior lighting; Rain gutters; Fenced yard (full privacy wood fence); Level lot
Interior
- Kitchen: Gas cooktop; Range; Oven; Dishwasher; Disposal; Microwave; Stainless steel appliances
- Flooring: Tile; Carpet; Ceramic tile; Vinyl
- Bathrooms: Three full bathrooms
- Heating & cooling: Central heating; Central air; Ceiling fans
- Interior features: High ceilings
- Laundry & utility: Washer hookup inside; Electric dryer hookup
Neighborhood map
What this means for you Summary
Snapshot
- This is a 4-bed/3.0-bath single-family listed at $319k.
Deal economics
- At list price, monthly cash flow is $51 ($618/yr) — positive.
- The deal already cash-flows at list — no discount required.
- To meet the 1% rule (rent ≥ 1% of price), the offer needs to be $254k (20.4% below list).
- Recommended offer: $254k (20.4% below list) — sets the bar for 1% rule.
- Cap rate 6.5% vs local median 5.0% in Hammond — meaningfully above typical; check what's discounted (condition, days-on-market, listing class) to confirm the premium yield is real.
Location & tenants
- Location reads 69/100 on livability (#77 in LA) — a middle-class / working-renter tenant base. Strengths: cost of living A+, health & safety A+; Watch: amenities C-, commute D+, schools D.
- Tangipahoa Parish (rural): math 18% / reading 29% proficiency, ranked #63 of 98 in LA (top 64%) — low school quality limits family demand, transient renter base, plan for 1-2y turnover; 73% free/reduced lunch — lower-income household profile, screen leases tightly.
- Market conditions: Rents flat; 329 active listings in the ZIP; 2 comparable units currently listed for rent nearby; 1,085 units permitted in Tangipahoa Parish in 2024 (378 in 5+ unit buildings).
- At $2,539/mo this rent would consume 60% of the median local household income ($51k/yr) (locally 1201% of renters already pay >50% of income on rent) — very limited rent-growth headroom before tenants either downsize or default.
Forward outlook
- Local home prices are declining (-3.0%/yr); year-one equity from $2k of loan paydown is wiped out by about $10k of value loss. Plan a longer hold.
- Tangipahoa County population projected at +22% by 2050 — long-run rental-demand tailwind backs the buy-and-hold thesis.
Negotiation context
- It's been on market 17 days — a 2% lower offer ($314k) is reasonable based on typical stale-listing flexibility.
- 4 sale attempts since 7y ago with the ask held roughly flat each time — persistent listings suggest the price (not the market) is what's stuck; bring a comps-based counter.
Questions for the listing agent
- What does the HOA fee cover, when was the last increase, and are there any pending special assessments or reserve-fund shortfalls?
- Is there a deadline driving the sale (1031 exchange, divorce, estate, relocation)? That informs how much negotiation room exists.
- Schools are D-rated, which usually means shorter tenancies and higher turnover. Who's the typical renter profile here, and what's been the actual vacancy rate?
- Crime grade is F in this area — have there been break-ins, vandalism, or insurance claims at this property in the last 3 years? What carrier currently insures it and at what premium?
- The area grade is low — what's the realistic commute time and amenity access for the typical tenant pool here? Any planned neighborhood developments (good or bad) we should know about?
- What's the average days-on-market for RENTAL listings here right now (not sales)? A rising rental-DOM trend means longer vacancies and softer asking-rent achievability than the comps imply.
- What's the recent tenant-quality profile in this submarket — average credit score on applications, eviction rate, late-payment / NSF rate, and stable-employment percentage? A property-management company in the area should have these aggregated.
- How much new for-sale + rental construction is in the pipeline within 1–3 miles? Heavy new supply typically softens prices + rents 12–24 months out; constrained supply supports both.
Investment metrics
- 1% rule
- 0.80% ✗
- Cap rate
- 6.49%
- Cash-on-cash
- 0.69%
- DSCR
- 1.03
- GRM
- 10.5
CMA / ARV
- ARV (on-the-fly)
- $320,126
- Comps found
- 2
Show comp detail 2 sales within ~0.75 mi
| Address | Dist | Beds/Ba | Sqft | Sold | Price | $/sf | Match |
|---|---|---|---|---|---|---|---|
| 19257 Providence Ridge Blvd | 0.08mi | 4/2.0 | 2,093 (-12%) | 9mo | $279,900 | $134 | 64 |
| 19405 Providence Ridge Blvd | 0.08mi | 4/2.5 | 2,669 (+12%) | 14mo | $285,000 | $107 | 63 |
Match score weights: distance 35% · size 25% · config 20% · recency 20%. Top-matched comps best support the ARV.
Projected returns pro-forma
-3.0% appreciation · 0.33% rent growth · sell at horizon
- IRR
- -17.9%
- Equity multiple
- 0.38×
- Total profit
- $-55,172
- Equity at exit
- $47,564
- IRR
- -15.6%
- Equity multiple
- 0.21×
- Total profit
- $-70,136
- Equity at exit
- $27,581
Cash invested: $89,320 (down + closing). Projections, not guarantees.
Landlord ↔ Tenant lean methodology
- Overall (STATE)
- 90 Strongly Landlord-Friendly
- State Louisiana
- 90 Strongly Landlord-Friendly · R+12
- County
- — inherits STATE
- City
- — inherits STATE
ZIP-level market 70403
- Home prices YoY
- -34.1%
- Rents YoY
- 0.3%
- Active inventory
- 329
- Price-to-rent
- 10.5×
Monthly cashflow live
- Estimated rent
- $2,539 medium interval (Pro) →
- Mortgage (P&I)
- −$1,673
- Tax from tax record
- −$111 /mo · $1,329/yr
- Insurance
- −$133
- HOA
- −$38
- Vacancy / Maint / Mgmt
- −$533
- Net cashflow
- $51
Break-even live
Sensitivity live
| Price | -10% $232 | -5% $142 | +0% $51 | +5% $-39 | +10% $-129 |
|---|---|---|---|---|---|
| Rent | -10% $-149 | -5% $-49 | +0% $51 | +5% $152 | +10% $252 |
| Rate | -1.0pp $212 | -0.5pp $133 | base $51 | +0.5pp $-31 | +1.0pp $-115 |
UW: 25.0% down · 7.5% · 30yr · 1.5% tax · 5.0% vac · 8.0% maint · 8.0% mgmt
Financing live
Cash to close
- Down payment
- $79,750
- Closing costs
- $9,570
- Reserves months
- —
- Total cash needed
- —
Loan-product check · same deal, 3 products live
Conventional
25% down · 7.5% · 30yr
- Down + closing
- —
- Monthly P&I
- —
- Monthly cashflow
- —
- DSCR
- —
- Eligible?
- —
Personal DTI + credit; lowest rate.
DSCR
20% down · 8.5% · 30yr
- Down + closing
- —
- Monthly P&I
- —
- Monthly cashflow
- —
- DSCR
- —
- Eligible?
- —
No personal income docs; deal must DSCR.
Hard money
10% down · 12.0% · 12mo
- Down + closing
- —
- Monthly P&I
- —
- Monthly cashflow
- —
- DSCR
- —
- Eligible?
- —
Short-term bridge; refi at stabilization.
Rent comps 2 comps
| Address | Beds | Baths | Sqft | Rent | $/sqft | DOM | Units | Dist |
|---|---|---|---|---|---|---|---|---|
| 43293 Quiet Lake Dr Hammond, LA | 4.0 | 2.0 | 1850 | $3,840 | $2.08 | 44d | 1 | 0.98mi |
| 20175 Kingland Dr Hammond, LA | 3.0 | 2.5 | 2300 | $2,300 | $1.00 | 44d | 1 | 1.42mi |
HOA detail
- Monthly dues
- $38 · $456/yr
- Likely covers
- watergassecurity
Listing history 14 events
-
2026-06-19days on market $319,000 Active 17 DOM
-
2026-06-18days on market $319,000 Active 16 DOM
-
2026-06-17days on market $319,000 Active 15 DOM
-
2026-06-16days on market $319,000 Active 14 DOM
-
2026-06-15days on market $319,000 Active 13 DOM
-
2026-06-14days on market $319,000 Active 11 DOM
-
2026-06-13days on market $319,000 Active 10 DOM
-
2026-06-10days on market $319,000 Active 8 DOM
-
2026-06-09days on market $319,000 Active 7 DOM
-
2026-06-08days on market $319,000 Active 6 DOM
-
2026-06-07days on market $319,000 Active 5 DOM
-
2026-06-05days on market $319,000 Active 2 DOM
-
2026-06-03remarks 699-char remark
-
2026-06-03$319,000 Active 1 DOM
ⓘ Source: listings_history table (triggers on properties + properties_extension) + one-shot
backfill from property_details.listing_events for pre-trigger history.
Tax reassessment forecast LA · Resets to sale price
- Current annual tax
- $1,329 · $111/mo
- Projected year-2 tax
- $1,754 · $146/mo
- Expected delta
- +$425/yr (+$35/mo · 32.0%)
ⓘ Screening estimate from a state-policy table — verify with the county assessor before closing.
Nearby sold comps map
Loading sold comps map…
Walkable amenities ~0.75 mi
Loading nearby amenities…
Taxation est. · year 1
- Rental income
- $30,472
- − Mortgage interest
- −$17,869
- − Property taxes
- −$1,329
- − Insurance
- −$1,595
- − Repairs & maintenance
- −$2,438
- − Management
- −$2,438
- − HOA
- −$456
- − Depreciation
- −$9,280
- Taxable loss
- −$4,933
- Est. tax savings @ 24.0%
- +$1,184
- After-tax cash flow
- $1,802/yr
For passive investors: Depreciation is non-cash, so a rental often shows a tax loss while cash-flowing — sheltering income. Rental losses are passive: they offset passive income freely, and up to $25,000/yr can offset ordinary (W-2) income if you actively participate and your MAGI is under $100k (phasing out to $0 by $150k); unused losses carry forward. On sale, claimed depreciation is recaptured at up to 25%, and gains may owe capital-gains tax (a 1031 exchange can defer both). Figures are a year-1 estimate at your 24.0% rate — not tax advice; consult a CPA.
Schools (NCES district)
- District
- Tangipahoa Parish
- NCES district ID
- 2201680
- Math proficiency
- 18% ▼ -32.00%
- Reading proficiency
- 29% ▼ -31.00%
- Median HH income
- $41,283
- Composite
- 19.94/100
- National rank
- #8676
- State rank
- #63 of 98 in LA
Livability — Hammond
- Score
- 69/100
- State rank
- #77
- US rank
- #8868
Category grades
Schools grade is shown separately in the Schools card above.
Census & demographics
- Census place
- Hammond, LA
- County
- Tangipahoa Parish · 85,958 people
- City population
- 51,394
- Metro
- Hammond, LA
- Population (ZIP)
- 30,173
- Household income
- $50,976
- Rent vs Own
- Severe rent burden
- 1201.0
Population outlook (Tangipahoa County) Hauer SSP2
- Today (2025)
- 144,204 people
- By 2030
- 151,413 · +5.0%
- By 2040
- 164,374 · +14.0%
- By 2050
- 175,427 · +21.7%
- By 2075
- 195,165 · +35.3%
- By 2100
- 201,641 · +39.8%
Race, ethnicity, and origin ACS 2023
- Neighborhood character
- Diverse neighborhood (Simpson 0.56)
- Race & ethnicity
- White 55% Black 37% Hispanic / Latino 6% Two or more races 6%
- Hispanic origin (detail)
- Mexican 3%
- Common ancestry
- Lithuanian 9% Serbian 1% Slovak 1%
- Foreign-born
- 3% · Canada
- Languages at home
- 95% English-only · Spanish 4% Arabic 1%
Political lean MEDSL · Tangipahoa
- 2024 margin
- Solid R (+37.4) · D 30.6% · R 68.0% · Other 1.3%
- 2008→2024 swing
- -6.5pp toward R · 2008: -30.9pp · 2024: -37.4pp
- All cycles
- 2024: R+37.4 2020: R+32.8 2016: R+32.6 2012: R+27.7 2008: R+30.9
Not yet ingested
- Civics
- —
Market trends
- HPI YoY
- ▼ -66.04%
- Current HPI
- 127.4535
- Rent YoY
- ▲ 0.33%
- Metro
- Hammond, LA
- State GDP YoY
- ▲ 3.29%
- F500 in state
- 10
Industry mix (Fortune 500 HQ in LA)
| Industry | F500 HQs | Revenue |
|---|---|---|
| Telecommunications | 2 | $23B |
|
||
| Utilities | 1 | $12B |
|
||
| Wholesale / Distribution | 1 | $5B |
|
||
| Advertising | 1 | $2B |
|
||
Price history
+37.0% since first listed12 events — show timeline
- 2026-06-02 Listed $319,000 GBRMLS
- 2026-06-02 Listed $319,000 AcadianaMLS
- 2019-12-11 Sold (MLS) — GSREIN
- 2019-09-03 Pending — GSREIN
- 2019-07-18 Price Changed $232,900 GSREIN
- 2019-06-25 Price Changed $233,900 GSREIN
- 2019-05-21 Price Changed $231,900 GSREIN
- 2019-05-13 Price Changed $230,900 GSREIN
- 2019-05-02 Price Changed $229,900 GSREIN
- 2019-02-26 Price Changed $228,900 GSREIN
- 2019-02-18 Listed $227,900 GSREIN
- 2019-02-18 Listed $232,900 AcadianaMLS
Property tax history
+31.3%/yrLatest (2025): $1,329 · +0.6% YoY. Source: county tax records.
Cash-flow waterfall
monthlySold comps — $/sqft
last 12 mo · ≤1 miLoading sold comps…