 Fourplex
17 Chestnut St · Yonkers, NY
Flood risk 1/10 · Minimal
- FEMA flood zone
- X (unshaded)
- Chance of flooding over 30 yrs
- 0.0%
- Est. flood insurance / yr
- $473 – $860
Fire risk 1/10 · Minimal
- Est. fire insurance / yr
- $691 – $1,283
Heat risk 6/10 · Moderate
- Hot days now (above 99°F)
- 7 days/yr
- Hot days in 30 yrs
- 15 days/yr
Wind risk 6/10 · Moderate
- Chance of severe wind over 30 yrs
- 27.0%
Air-quality risk 3/10 · Minor
- Unhealthy air days now
- 3 days/yr
- Unhealthy air days in 30 yrs
- 4 days/yr
Risk factors via First Street. Map © Google.
Why this score? — see what drove the D grade
The composite is a weighted blend of 9 inputs, each scored 0–100. Each bar is that input's sub-score; the figure is the points it added to the 100-point composite (weight × sub-score).
- Cash flow +20.6/30.0
- DSCR +6.5/10.0
- 1% rule +4.1/10.0
- Schools +4.1/10.0
- Rent growth +3.6/5.0
- Livability +3.4/5.0
- Condition / age +2.5/5.0
- ARV discount +0.0/15.0
- Appreciation +0.0/10.0
$1,249,000
🖨 Deal sheet 📄 Offer letter ✓ Due diligence
Multi-family units
County records classify this as Multi-Family (5+ Unit). Listing-text estimate: 4 units. estimate disagrees with records
5+ unit building — per-unit beds/baths from public records are typically unavailable; the breakdown below (if shown) is an estimate from the listing text.
Listing remarks MLS
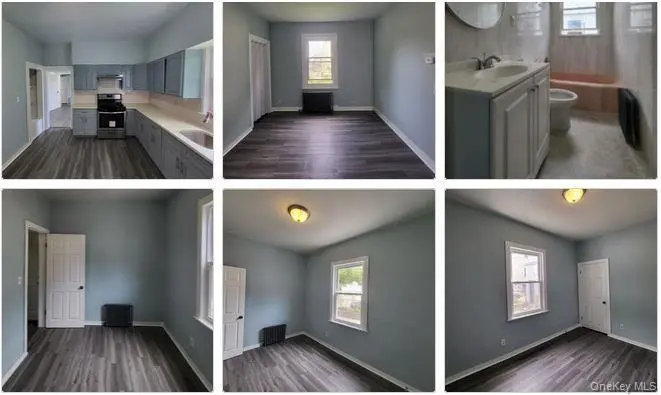
Great Opportunity for an investor or handyman special. 6 car garage and plenty driveway parking space. Units are 1, 3,3 and 3 bedrooms, Living/dining room, kitchen, bathroom. Property is in need of TLC. Store built on the lot is great for an office or another business. Both buildings are part of the property. If financed submit mortgage rehab loan pre-approval, POF for down payment. Cash buyer full bid amount POF. No bid will be answered until property is over 5 days on the market. It won't last! Send your offer in. Additional Information: HeatingFuel:Oil Below Ground,ParkingFeatures:4+ Car Detached,
Key facts
- Fully renovated
- Unique layout
- Strong rental income
Tags
Property features AI
Exterior
- Parking: Detached parking; Driveway parking; On-site garage parking; Parking lot; 6 total parking spaces; 6 garage spaces
- Utilities: Electricity connected (Con-Edison); Natural gas connected; Public sewer; Water connected; Phone connected; Public trash collection
- Home design: Quadruplex; Building has 6,078 total building area (public records)
- Construction: Vinyl siding construction
- Exterior features: Vinyl siding; Not waterfront; Additional parcel(s) included
Interior
- Bedrooms: Includes a bedroom on the first floor
- Bathrooms: Full bathrooms on the first floor
- Heating & cooling: Radiant heating; Wall/window air conditioning units
- Interior features: First-floor bedroom; First-floor full bathroom; Finished full basement
Neighborhood map
What this means for you Summary
Snapshot
- This is a 4 × 2-bed/?-bath units multifamily listed at $1.25M.
Deal economics
- At list price, monthly cash flow is $2k ($20k/yr) — positive. Per door: $415/mo.
- The deal already cash-flows at list — no discount required.
- To meet the 1% rule (rent ≥ 1% of price), the offer needs to be $1.13M (9.4% below list).
- Recommended offer: $1.13M (9.4% below list) — sets the bar for 1% rule.
- Cap rate 7.9% vs local median 5.3% in Yonkers — top-decile yield for the area; either an underpriced asset or a hidden risk that comps aren't pricing in. Stress-test before assuming the spread holds.
Location & tenants
- Location reads 68/100 on livability (#528 in NY) — a middle-class / working-renter tenant base. Strengths: employment A, commute B; Watch: amenities F, cost of living F.
- Yonkers City School District (suburban): math 41% / reading 54% proficiency, ranked #413 of 590 in NY (top 70%) — families likely to look elsewhere, expect single-tenant / working-renter base with shorter leases; 64% free/reduced lunch — lower-income household profile, screen leases tightly.
- Zoned schools: Yonkers Early Childhood Academy (327 students, 72% FRL); Yonkers Middle School (math 17% / reading 37%, grade F, #587 of 729 statewide, top 81%, 601 students, 88% FRL); Yonkers High School (math 92% / reading 88%, grade A+, #238 of 1,100 statewide, top 23%, 1,060 students, 76% FRL) — zoned schools average 79% FRL vs 64% district-wide (15 pts higher); higher-poverty schools than district average — tighter screening recommended.
- Market conditions: Rents rising fast (+4.4%/yr); 183 active listings in the ZIP; 1 comparable units currently listed for rent nearby; 954 units permitted in Westchester County in 2024 (649 in 5+ unit buildings).
- At $11,318/mo this rent would consume 210% of the median local household income ($65k/yr) (locally 6045% of renters already pay >50% of income on rent) — very limited rent-growth headroom before tenants either downsize or default.
Forward outlook
- Local home prices are declining (-3.0%/yr); year-one equity from $9k of loan paydown is wiped out by about $37k of value loss. Plan a longer hold.
- Westchester County population projected at +10% by 2050 — modest demand growth; plan on rents tracking national, not racing it.
Negotiation context
- It's been on market 30 days — a 2% lower offer ($1.23M) is reasonable based on typical stale-listing flexibility.
- 4 sale attempts since 10y ago with the ask held roughly flat each time — persistent listings suggest the price (not the market) is what's stuck; bring a comps-based counter.
- Current owner paid $390k; list at $1.25M implies a 220% gain — meaningful room to come down on a strong offer.
Risks & watch-outs
- Watch-outs: built in 1925 — expect roof / HVAC / electrical / plumbing capex.
- Climate carrying-cost: major wind risk, 27% chance of damaging wind over 30y; extreme-heat days projected 7→15/yr by 2055 (HVAC capex compounding) — expect insurance premiums to compound above CPI over the hold.
Questions for the listing agent
- Can we see the unit-by-unit rent roll, current vacancy, and any below-market leases? What's the average tenancy length?
- What capital expenditures (roof, boiler, parking lot, exteriors) have been made in the last 5 years, and what's planned in the next 2?
- Built in 1925 — when were the roof, HVAC, electrical panel, plumbing, and water heater last replaced?
- Is there a deadline driving the sale (1031 exchange, divorce, estate, relocation)? That informs how much negotiation room exists.
- The area grade is low — what's the realistic commute time and amenity access for the typical tenant pool here? Any planned neighborhood developments (good or bad) we should know about?
- What's the average days-on-market for RENTAL listings here right now (not sales)? A rising rental-DOM trend means longer vacancies and softer asking-rent achievability than the comps imply.
- What's the recent tenant-quality profile in this submarket — average credit score on applications, eviction rate, late-payment / NSF rate, and stable-employment percentage? A property-management company in the area should have these aggregated.
- How much new apartment / multifamily construction is in the pipeline within 1–3 miles? Heavy new supply (>2% of stock underway) typically softens rents 12–24 months out; light construction supports rent growth.
Investment metrics
- 1% rule
- 0.91% ✗
- Cap rate
- 7.89%
- Cash-on-cash
- 5.69%
- DSCR
- 1.25
- GRM
- 9.2
CMA / ARV
- ARV (on-the-fly)
- $912,000
- Comps found
- 8
Show comp detail 8 sales within ~0.75 mi
| Address | Dist | Beds/Ba | Sqft | Sold | Price | $/sf | Match |
|---|---|---|---|---|---|---|---|
| 32 Yonkers Ave | 0.05mi | 8/4.0 | 4,300 (-6%) | 4mo | $860,000 | $200 | 84 |
| 109 Linden St | 0.26mi | 10/4.0 | 4,255 (-7%) | 2mo | $850,000 | $200 | 75 |
| 128 Oliver Ave | 0.32mi | 11/4.0 | 4,506 (-1%) | 13mo | $950,000 | $211 | 72 |
| 198 Palisade Ave | 0.33mi | 7/3.0 | 4,243 (-7%) | 14mo | $925,000 | $218 | 61 |
| 114 Oak St | 0.29mi | 10/3.0 | 5,116 (+12%) | 10mo | $890,000 | $174 | 58 |
| 39 Cedar St | 0.43mi | 8/8.0 | 4,947 (+8%) | 10mo | $1,378,000 | $279 | 58 |
| 7 Cliff St | 0.35mi | 10/4.0 | 5,164 (+13%) | 10mo | $900,000 | $174 | 54 |
| 161 Park Hill Ave | 0.72mi | 7/3.0 | 5,027 (+10%) | 18mo | $935,000 | $186 | 34 |
Match score weights: distance 35% · size 25% · config 20% · recency 20%. Top-matched comps best support the ARV.
Projected returns pro-forma
-3.0% appreciation · 4.39% rent growth · sell at horizon
- IRR
- -6.2%
- Equity multiple
- 0.77×
- Total profit
- $-81,403
- Equity at exit
- $186,230
- IRR
- 4.8%
- Equity multiple
- 1.37×
- Total profit
- $130,163
- Equity at exit
- $107,991
Cash invested: $349,720 (down + closing). Projections, not guarantees.
Landlord ↔ Tenant lean methodology
- Overall (CITY)
- 5 Strongly Tenant-Friendly
- State New York
- 15 Strongly Tenant-Friendly · D+10
- County
- — inherits STATE
- City Yonkers
- 5 Strongly Tenant-Friendly · D+20
ZIP-level market 10701
- Rents YoY
- 4.4%
- Active inventory
- 183
- Price-to-rent
- 36.8×
Monthly cashflow live
- Estimated rent
- $11,318 high interval (Pro) →
- Mortgage (P&I)
- −$6,550
- Tax from tax record
- −$213 /mo · $2,555/yr
- Insurance
- −$520
- HOA
- −$0
- Vacancy / Maint / Mgmt
- −$2,377
- Net cashflow
- $1,658
Break-even live
4-unit breakdown (identical units grouped — click to expand)
| Units | Beds | Baths | Est. rent |
|---|---|---|---|
| 4× units | 2 | — | $11,316 |
| #1 | 2 | — | $2,829 |
| #2 | 2 | — | $2,829 |
| #3 | 2 | — | $2,829 |
| #4 | 2 | — | $2,829 |
| Total (4 units) | $11,318 | ||
UW: 25.0% down · 7.5% · 30yr · 1.5% tax · 5.0% vac · 8.0% maint · 8.0% mgmt
Financing live
Cash to close
- Down payment
- $312,250
- Closing costs
- $37,470
- Reserves months
- —
- Total cash needed
- —
Loan-product check · same deal, 3 products live
Conventional
25% down · 7.5% · 30yr
- Down + closing
- —
- Monthly P&I
- —
- Monthly cashflow
- —
- DSCR
- —
- Eligible?
- —
Personal DTI + credit; lowest rate.
DSCR
20% down · 8.5% · 30yr
- Down + closing
- —
- Monthly P&I
- —
- Monthly cashflow
- —
- DSCR
- —
- Eligible?
- —
No personal income docs; deal must DSCR.
Hard money
10% down · 12.0% · 12mo
- Down + closing
- —
- Monthly P&I
- —
- Monthly cashflow
- —
- DSCR
- —
- Eligible?
- —
Short-term bridge; refi at stabilization.
Rent comps 1 comps
| Address | Beds | Baths | Sqft | Rent | $/sqft | DOM | Units | Dist |
|---|---|---|---|---|---|---|---|---|
| 69 Yonkers Ave Yonkers, NY | 2.0 | 1.0 | 5712 | $2,750 | $0.48 | 43d | 1 | 0.20mi |
Listing history 25 events
-
2026-06-18days on market $1,249,000 Active 30 DOM
-
2026-06-17days on market $1,249,000 Active 29 DOM
-
2026-06-16days on market $1,249,000 Active 28 DOM
-
2026-06-15days on market $1,249,000 Active 27 DOM
-
2026-06-13days on market $1,249,000 Active 25 DOM
-
2026-06-09days on market $1,249,000 Active 21 DOM
-
2026-06-08days on market $1,249,000 Active 20 DOM
-
2026-06-07days on market $1,249,000 Active 19 DOM
-
2026-06-04days on market $1,249,000 Active 16 DOM
-
2026-06-03days on market $1,249,000 Active 15 DOM
-
2026-06-02days on market $1,249,000 Active 14 DOM
-
2026-06-01days on market $1,249,000 Active 13 DOM
-
2026-05-31days on market $1,249,000 Active 12 DOM
-
2026-05-01$1,249,000 Active
-
2026-01-01historical
-
2025-08-04price $1,249,000
-
2025-05-22$1,290,000 Active
-
2023-09-12historical $3,500
-
2023-08-24$3,500
-
2017-06-20soldstatus $390,000 Sold 611-char remark
Show marketing remark (611 chars)
Great Opportunity for an investor or handyman special. 6 car garage and plenty driveway parking space. Units are 1, 3,3 and 3 bedrooms, Living/dining room, kitchen, bathroom. Property is in need of TLC. Store built on the lot is great for an office or another business. Both buildings are part of the property. If financed submit mortgage rehab loan pre-approval, POF for down payment. Cash buyer full bid amount POF. No bid will be answered until property is over 5 days on the market. It won't last! Send your offer in. Additional Information: HeatingFuel:Oil Below Ground,ParkingFeatures:4+ Car Detached,
-
2017-01-15historical Pending 611-char remark
Show marketing remark (611 chars)
Great Opportunity for an investor or handyman special. 6 car garage and plenty driveway parking space. Units are 1, 3,3 and 3 bedrooms, Living/dining room, kitchen, bathroom. Property is in need of TLC. Store built on the lot is great for an office or another business. Both buildings are part of the property. If financed submit mortgage rehab loan pre-approval, POF for down payment. Cash buyer full bid amount POF. No bid will be answered until property is over 5 days on the market. It won't last! Send your offer in. Additional Information: HeatingFuel:Oil Below Ground,ParkingFeatures:4+ Car Detached,
-
2016-12-08$399,900 Active 611-char remark
Show marketing remark (611 chars)
Great Opportunity for an investor or handyman special. 6 car garage and plenty driveway parking space. Units are 1, 3,3 and 3 bedrooms, Living/dining room, kitchen, bathroom. Property is in need of TLC. Store built on the lot is great for an office or another business. Both buildings are part of the property. If financed submit mortgage rehab loan pre-approval, POF for down payment. Cash buyer full bid amount POF. No bid will be answered until property is over 5 days on the market. It won't last! Send your offer in. Additional Information: HeatingFuel:Oil Below Ground,ParkingFeatures:4+ Car Detached,
-
2003-04-08soldstatus $373,000
-
1999-03-23soldstatus $135,000
-
1994-11-16soldstatus $240,000
ⓘ Source: listings_history table (triggers on properties + properties_extension) + one-shot
backfill from property_details.listing_events for pre-trigger history.
Tax reassessment forecast NY · Partial reset (capped growth)
- Current annual tax
- $2,555 · $213/mo
- Projected year-2 tax
- $11,832 · $986/mo
- Expected delta
- +$9,277/yr (+$773/mo · 363.1%)
ⓘ Screening estimate from a state-policy table — verify with the county assessor before closing.
Climate risk First Street
- Flood 1/10 Low FEMA zone X (unshaded) · 0% chance over 30 yrs
- Wildfire 1/10 Low
- Heat 6/10 Major 7 d/yr ≥99°F today · 15 d/yr by 30 yrs out
- Wind 6/10 Major 27% chance of damaging wind over 30 yrs
- Air quality 3/10 Moderate 3 unhealthy d/yr today · 4 by 30 yrs out
Nearby sold comps map
Loading sold comps map…
Walkable amenities ~0.75 mi
Loading nearby amenities…
Taxation est. · year 1
- Rental income
- $135,816
- − Mortgage interest
- −$69,963
- − Property taxes
- −$2,555
- − Insurance
- −$6,245
- − Repairs & maintenance
- −$10,865
- − Management
- −$10,865
- − Depreciation
- −$36,335
- Taxable loss
- −$1,012
- Est. tax savings @ 24.0%
- +$243
- After-tax cash flow
- $20,139/yr
For passive investors: Depreciation is non-cash, so a rental often shows a tax loss while cash-flowing — sheltering income. Rental losses are passive: they offset passive income freely, and up to $25,000/yr can offset ordinary (W-2) income if you actively participate and your MAGI is under $100k (phasing out to $0 by $150k); unused losses carry forward. On sale, claimed depreciation is recaptured at up to 25%, and gains may owe capital-gains tax (a 1031 exchange can defer both). Figures are a year-1 estimate at your 24.0% rate — not tax advice; consult a CPA.
Schools (NCES district)
- District
- Yonkers City School District
- NCES district ID
- 3631920
- Math proficiency
- 41% ▼ -1.00%
- Reading proficiency
- 54% ▲ 14.00%
- Median HH income
- $58,042
- Composite
- 41.43/100
- National rank
- #3471
- State rank
- #413 of 590 in NY
Livability — Yonkers
- Score
- 68/100
- State rank
- #528
- US rank
- #9394
Category grades
Schools grade is shown separately in the Schools card above.
Census & demographics
- Census place
- Yonkers, NY
- County
- Westchester County · 709,332 people
- City population
- 212,407
- Metro
- New York-Newark-Jersey City, NY-NJ-PA
- Population (ZIP)
- 70,676
- Household income
- $64,776
- Rent vs Own
- Severe rent burden
- 6045.0
Population outlook (Westchester County) Hauer SSP2
- Today (2025)
- 1,028,035 people
- By 2030
- 1,051,636 · +2.3%
- By 2040
- 1,098,520 · +6.9%
- By 2050
- 1,136,044 · +10.5%
- By 2075
- 1,196,925 · +16.4%
- By 2100
- 1,175,147 · +14.3%
Race, ethnicity, and origin ACS 2023
- Neighborhood character
- Diverse neighborhood (Simpson 0.65)
- Race & ethnicity
- Hispanic / Latino 52% White 21% Black 21% Two or more races 18% Asian 3% Native American 1%
- Hispanic origin (detail)
- Mexican 11% Puerto Rican 9% Dominican 19%
- Common ancestry
- Romanian 1% Russian 1% Subsaharan African 1%
- Foreign-born
- 35% · Canada, Jamaica, South Korea
- Languages at home
- 45% English-only · Spanish 42% Other Indo-European 3% Arabic 2%
Political lean MEDSL · Westchester
- 2024 margin
- Strong D (+26.3) · D 63.1% · R 36.9%
- 2008→2024 swing
- -1.3pp toward R · 2008: 27.6pp · 2024: 26.3pp
- All cycles
- 2024: D+26.3 2020: D+36.3 2016: D+32.8 2012: D+22.2 2008: D+27.6
Not yet ingested
- Civics
- —
Market trends
- HPI YoY
- ▼ -373.14%
- Current HPI
- 332.0999
- Rent YoY
- ▲ 4.39%
- Metro
- New York-Newark-Jersey City, NY-NJ-PA
- State GDP YoY
- ▲ 2.60%
- F500 in state
- 92
Industry mix (Fortune 500 HQ in NY)
| Industry | F500 HQs | Revenue |
|---|---|---|
| Financial Services | 10 | $950B |
|
||
| Consumer Goods | 9 | $162B |
|
||
| Insurance | 4 | $225B |
|
||
| Telecommunications | 2 | $144B |
|
||
| Pharmaceuticals | 2 | $112B |
|
||
| Media / Entertainment | 2 | $69B |
|
||
Price history
+420.4% since first listed12 events — show timeline
- 2026-05-01 Listed $1,249,000 OneKey® MLS as Distributed by MLS Grid
- 2026-01-01 Listing Removed — OneKey® MLS as Distributed by MLS Grid
- 2025-08-04 Price Changed $1,249,000 OneKey® MLS as Distributed by MLS Grid
- 2025-05-22 Listed $1,290,000 OneKey® MLS as Distributed by MLS Grid
- 2023-09-12 Rental Removed $3,500 ONEKEY
- 2023-08-24 Listed for Rent $3,500 ONEKEY
- 2017-06-20 Sold (MLS) $390,000 OneKey® MLS as Distributed by MLS Grid
- 2017-01-15 Contingent — OneKey® MLS as Distributed by MLS Grid
- 2016-12-08 Listed $399,900 OneKey® MLS as Distributed by MLS Grid
- 2003-04-08 Sold (Public Records) $373,000 Public Records
- 1999-03-23 Sold (Public Records) $135,000 Public Records
- 1994-11-16 Sold (Public Records) $240,000 Public Records
Property tax history
-23.6%/yrLatest (2025): $2,555 · +0.6% YoY. Source: county tax records.
Cash-flow waterfall
monthlySold comps — $/sqft
last 12 mo · ≤1 miLoading sold comps…