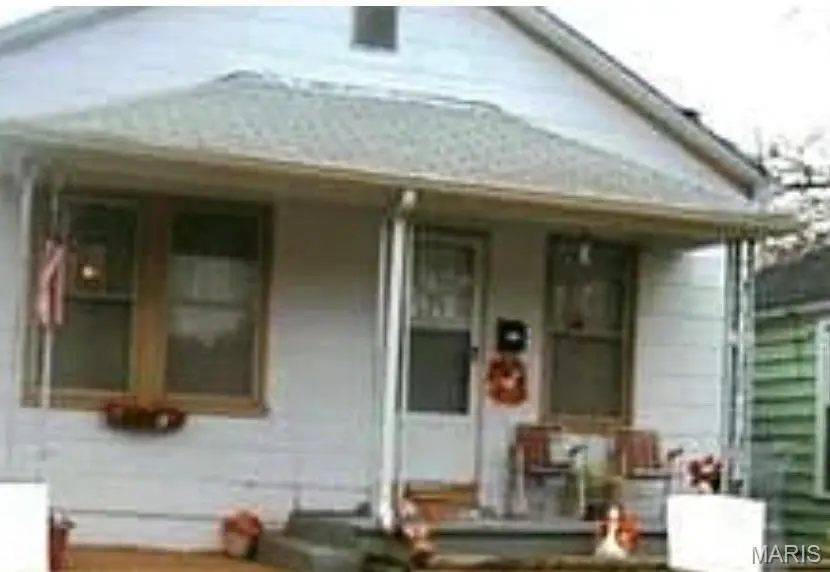
1005 Switzer Ave · St. Louis, MO
Flood risk 4/10 · Minor
- FEMA flood zone
- X (shaded)
- Chance of flooding over 30 yrs
- 0.23%
- Est. flood insurance / yr
- $473 – $860
Fire risk 1/10 · Minimal
- Est. fire insurance / yr
- $1,054 – $1,958
Heat risk 5/10 · Moderate
- Hot days now (above 107°F)
- 7 days/yr
- Hot days in 30 yrs
- 21 days/yr
Wind risk 2/10 · Minimal
- Chance of severe wind over 30 yrs
- 1.0%
Air-quality risk 4/10 · Minor
- Unhealthy air days now
- 5 days/yr
- Unhealthy air days in 30 yrs
- 6 days/yr
Risk factors via First Street. Map © Google.
Why this score? — see what drove the B grade
The composite is a weighted blend of 9 inputs, each scored 0–100. Each bar is that input's sub-score; the figure is the points it added to the 100-point composite (weight × sub-score).
- Cash flow +30.0/30.0
- ARV discount +12.8/15.0
- 1% rule +10.0/10.0
- DSCR +10.0/10.0
- Rent growth +2.5/5.0
- Livability +2.5/5.0
- Condition / age +2.5/5.0
- Schools +1.2/10.0
- Appreciation +0.0/10.0
$45,000
🖨 Deal sheet 📄 Offer letter ✓ Due diligence
Listing remarks
1-bedroom, 1-bath home in the heart of Baden with tons of potential for the right buyer or investor. This handyman special features a spacious layout, original character, and a large yard ready for your personal touch. Perfect opportunity to renovate, flip, or create a rental property. CHome is being sold as-is and will require repairs and updates, but with some vision and work, this property could truly shine. Great investment opportunity at an affordable price!
Key facts
- Original character
- Large yard
- Spacious layout
Tags
Property features AI
Exterior
- Utilities: Public water; Public sewer; Electric service by Ameren
- Home design: Single-family residence; Residential property; One story
- Construction: Aluminum siding
- Exterior features: Back yard
Interior
- Bedrooms: 1 bedroom on the main level
- Bathrooms: 1 full bathroom on the main level
- Heating & cooling: Natural gas heating; Cooling: Other
- Interior features: One-level living
Neighborhood map
What this means for you Summary
Snapshot
- This is a 1-bed/1.0-bath single-family listed at $45k.
Deal economics
- At list price, monthly cash flow is $366 ($4k/yr) — positive.
- The deal already cash-flows at list — no discount required.
- Meets the 1% rule at list price ($807 rent vs $45k).
- Recommended offer: $44k (3.0% below list) — sets the bar for market timing.
- Cap rate 16.1% vs local median 5.0% in St. Louis — top-decile yield for the area; either an underpriced asset or a hidden risk that comps aren't pricing in. Stress-test before assuming the spread holds.
Location & tenants
- Location reads: area grade B — affects rentability + tenant quality, not the cash-flow math above.
- St. Louis City (urban): math 10% / reading 18% proficiency, ranked #312 of 324 in MO (top 96%) — low school quality limits family demand, transient renter base, plan for 1-2y turnover; 80% free/reduced lunch — lower-income household profile, screen leases tightly.
- Zoned schools: Earl Nance Sr. Elem. (math 2% / reading 2%, grade F, #1,099 of 1,115 statewide, top 100%, 321 students, 99% FRL); Beaumont Cte High School (math 5% / reading 5%, grade F, #517 of 521 statewide, top 100%, 236 students, 99% FRL) — zoned schools average 99% FRL vs 80% district-wide (18 pts higher); higher-poverty schools than district average — tighter screening recommended.
- Market conditions: 57 active listings in the ZIP; 13 comparable units currently listed for rent nearby; rentals lingering (median 44d on market — plan ~5-8 weeks vacancy on turnover, expect pricing pressure); 54% of comp listings sitting > 30 days — soft ceiling on asking rent; lower-income renter base — watch delinquency; 294 units permitted in St. Louis city in 2024 (227 in 5+ unit buildings).
Forward outlook
- Local home prices are declining (-3.0%/yr); year-one equity from $311 of loan paydown is wiped out by about $1k of value loss. Plan a longer hold.
- St. Louis County population projected to shrink 6% by 2050 — rents likely to lag national; underwrite the cash flow, not the appreciation.
- At projected returns (-3.0% appreciation + 3.0% rent growth), your $13k cash investment doubles in ~4 years — after that, you're playing with house money.
Negotiation context
- It's been on market 35 days — a 3% lower offer ($44k) is reasonable based on typical stale-listing flexibility.
- 2 sale attempts with the ask held roughly flat each time — persistent listings suggest the price (not the market) is what's stuck; bring a comps-based counter.
Risks & watch-outs
- Watch-outs: built in 1922 — expect roof / HVAC / electrical / plumbing capex.
- Climate carrying-cost: extreme-heat days projected 7→21/yr by 2055 (HVAC capex compounding) — expect insurance premiums to compound above CPI over the hold.
Questions for the listing agent
- It's been on market 35 days. Have you received any prior offers? Is the seller open to a 3% concession, seller financing, or rate buy-down credit?
- Built in 1922 — when were the roof, HVAC, electrical panel, plumbing, and water heater last replaced?
- Is there a deadline driving the sale (1031 exchange, divorce, estate, relocation)? That informs how much negotiation room exists.
- What's the average days-on-market for RENTAL listings here right now (not sales)? A rising rental-DOM trend means longer vacancies and softer asking-rent achievability than the comps imply.
- What's the recent tenant-quality profile in this submarket — average credit score on applications, eviction rate, late-payment / NSF rate, and stable-employment percentage? A property-management company in the area should have these aggregated.
- How much new for-sale + rental construction is in the pipeline within 1–3 miles? Heavy new supply typically softens prices + rents 12–24 months out; constrained supply supports both.
Investment metrics
- 1% rule
- 1.79% ✓
- Cap rate
- 16.06%
- Cash-on-cash
- 34.89%
- DSCR
- 2.55
- GRM
- 4.6
CMA / ARV
- ARV (median comp)
- $51,060
- List price
- $45,000
- Delta
- -11.87%
- Verdict
- UNDERPRICED
- Comps
- 20 within 1.0 mi
Show comp detail 1 sale within ~0.75 mi
| Address | Dist | Beds/Ba | Sqft | Sold | Price | $/sf | Match |
|---|---|---|---|---|---|---|---|
| 5957 Vivian Ave | 0.69mi | 2/1.0 (+1) | 768 (+7%) | 14mo | $94,000 | $122 | 40 |
Match score weights: distance 35% · size 25% · config 20% · recency 20%. Top-matched comps best support the ARV.
Projected returns pro-forma
-3.0% appreciation · 3.0% rent growth · sell at horizon
- IRR
- 30.4%
- Equity multiple
- 2.27×
- Total profit
- $16,026
- Equity at exit
- $6,710
- IRR
- 37.6%
- Equity multiple
- 4.49×
- Total profit
- $43,947
- Equity at exit
- $3,891
Cash invested: $12,600 (down + closing). Projections, not guarantees.
Landlord ↔ Tenant lean methodology
- Overall (STATE)
- 81 Strongly Landlord-Friendly
- State Missouri
- 81 Strongly Landlord-Friendly · R+10
- County
- — inherits STATE
- City
- — inherits STATE
ZIP-level market 63147
- Home prices YoY
- -31.4%
- Active inventory
- 57
- Price-to-rent
- 4.6×
Monthly cashflow live
- Estimated rent
- $807 high interval (Pro) →
- Mortgage (P&I)
- −$236
- Tax from tax record
- −$17 /mo · $200/yr
- Insurance
- −$19
- HOA
- −$0
- Vacancy / Maint / Mgmt
- −$170
- Net cashflow
- $366
Break-even live
UW: 25.0% down · 7.5% · 30yr · 1.5% tax · 5.0% vac · 8.0% maint · 8.0% mgmt
Financing live
Cash to close
- Down payment
- $11,250
- Closing costs
- $1,350
- Reserves months
- —
- Total cash needed
- —
Loan-product check · same deal, 3 products live
Conventional
25% down · 7.5% · 30yr
- Down + closing
- —
- Monthly P&I
- —
- Monthly cashflow
- —
- DSCR
- —
- Eligible?
- —
Personal DTI + credit; lowest rate.
DSCR
20% down · 8.5% · 30yr
- Down + closing
- —
- Monthly P&I
- —
- Monthly cashflow
- —
- DSCR
- —
- Eligible?
- —
No personal income docs; deal must DSCR.
Hard money
10% down · 12.0% · 12mo
- Down + closing
- —
- Monthly P&I
- —
- Monthly cashflow
- —
- DSCR
- —
- Eligible?
- —
Short-term bridge; refi at stabilization.
Rent comps 13 comps
| Address | Beds | Baths | Sqft | Rent | $/sqft | DOM | Units | Dist |
|---|---|---|---|---|---|---|---|---|
| 8612 Halls Ferry Rd Saint Louis, MO | 1.0–2.0 | 1.0 | 625 | $715 | $1.14 | 4d | 2 | 0.52mi |
| 1131 Canaan Ave Saint Louis, MO | 1.0 | 1.0 | 624 | $900 | $1.44 | 16d | 1 | 0.85mi |
| 819 Gustav Ave Apt A St. Louis, MO | 1.0 | 1.0 | 550 | $740 | $1.35 | 23d | 1 | 1.09mi |
| 819 Gustav Ave Unit 832 B St. Louis, MO | 1.0 | 1.0 | 550 | $740 | $1.35 | 43d | 1 | 1.09mi |
| 819 Gustav Ave Apt C St. Louis, MO | 1.0 | 1.0 | 550 | $800 | $1.45 | 43d | 1 | 1.09mi |
| 605 Fremont Ave Saint Louis, MO | 2.0 | 1.0 | 750 | $995 | $1.33 | 43d | 1 | 1.09mi |
| 4908 W Florissant Ave Unit B St. Louis, MO | — | 1.0 | 750 | $675 | $0.90 | 43d | 1 | 1.35mi |
| 4908 W Florissant Ave Apt A St. Louis, MO | 1.0 | 1.0 | 750 | $695 | $0.93 | 43d | 1 | 1.35mi |
| 960 Raford Ct St. Louis, MO | 2.0 | 1.0 | 750 | $950 | $1.27 | 23d | 1 | 1.42mi |
| 849 River Trail Ct #102 St. Louis, MO | 1.0 | 1.0 | 700 | $825 | $1.18 | 23d | 1 | 1.45mi |
| 849 River Trail Ct Apt 201 St. Louis, MO | 1.0 | 1.0 | 700 | $825 | $1.18 | 43d | 1 | 1.45mi |
| 4732 W Florissant Ave Unit 2nd St. Louis, MO | 1.0 | 1.0 | 600 | $650 | $1.08 | 43d | 1 | 1.47mi |
| 5635 Hodiamont Ave Saint Louis, MO | 2.0 | 1.0 | 580 | $899 | $1.55 | 20d | 1 | 1.49mi |
Listing history 17 events
-
2026-06-18days on market $45,000 Active 35 DOM
-
2026-06-17statusdays on market $45,000 Active 34 DOM
-
2026-06-16days on market $45,000 Active Under Contract 33 DOM
-
2026-06-15days on market $45,000 Active Under Contract 32 DOM
-
2026-06-13days on market $45,000 Active Under Contract 30 DOM
-
2026-06-09days on market $45,000 Active Under Contract 26 DOM
-
2026-06-08days on market $45,000 Active Under Contract 25 DOM
-
2026-06-08status $45,000 Active Under Contract 24 DOM
-
2026-06-07days on market $45,000 Active 24 DOM
-
2026-06-05days on market $45,000 Active 21 DOM
-
2026-06-03days on market $45,000 Active 20 DOM
-
2026-06-02days on market $45,000 Active 19 DOM
-
2026-06-01days on market $45,000 Active 18 DOM
-
2026-05-31days on market $45,000 Active 17 DOM
-
2026-05-14$45,000 Active 467-char remark
-
2018-12-31soldstatus $304,000
-
2006-05-15soldstatus $21,000
ⓘ Source: listings_history table (triggers on properties + properties_extension) + one-shot
backfill from property_details.listing_events for pre-trigger history.
Tax reassessment forecast MO · Resets to sale price
- Current annual tax
- $200 · $17/mo
- Projected year-2 tax
- $436 · $36/mo
- Expected delta
- +$237/yr (+$20/mo · 118.7%)
ⓘ Screening estimate from a state-policy table — verify with the county assessor before closing.
Climate risk First Street
- Flood 4/10 Moderate FEMA zone X (shaded) · 23% chance over 30 yrs
- Wildfire 1/10 Low
- Heat 5/10 Major 7 d/yr ≥107°F today · 21 d/yr by 30 yrs out
- Wind 2/10 Low 100% chance of damaging wind over 30 yrs
- Air quality 4/10 Moderate 5 unhealthy d/yr today · 6 by 30 yrs out
Nearby sold comps map
Loading sold comps map…
Walkable amenities ~0.75 mi
Loading nearby amenities…
Taxation est. · year 1
- Rental income
- $9,686
- − Mortgage interest
- −$2,521
- − Property taxes
- −$200
- − Insurance
- −$225
- − Repairs & maintenance
- −$775
- − Management
- −$775
- − Depreciation
- −$1,309
- Taxable income
- $3,882
- Est. tax owed @ 24.0%
- −$932
- After-tax cash flow
- $3,464/yr
For passive investors: Depreciation is non-cash, so a rental often shows a tax loss while cash-flowing — sheltering income. Rental losses are passive: they offset passive income freely, and up to $25,000/yr can offset ordinary (W-2) income if you actively participate and your MAGI is under $100k (phasing out to $0 by $150k); unused losses carry forward. On sale, claimed depreciation is recaptured at up to 25%, and gains may owe capital-gains tax (a 1031 exchange can defer both). Figures are a year-1 estimate at your 24.0% rate — not tax advice; consult a CPA.
Schools (NCES district)
- District
- St. Louis City
- NCES district ID
- 2929280
- Math proficiency
- 10% ▼ -6.00%
- Reading proficiency
- 18% ▼ -3.00%
- Median HH income
- $35,685
- Composite
- 11.54/100
- National rank
- #9699
- State rank
- #312 of 324 in MO
Livability — St. Louis
No livability data for this city. (Only ~50 U.S. cities are tracked.)
Census & demographics
- Census place
- St. Louis, MO
- County
- Saint Louis City · 254,015 people
- City population
- 283,259
- Metro
- St. Louis, MO-IL
- Population (ZIP)
- 8,173
- Household income
- $41,182
- Rent vs Own
- Severe rent burden
- 418.0
Population outlook (St. Louis County) Hauer SSP2
- Today (2025)
- 315,737 people
- By 2030
- 313,865 · -0.6%
- By 2040
- 305,439 · -3.3%
- By 2050
- 296,529 · -6.1%
- By 2075
- 271,028 · -14.2%
- By 2100
- 255,359 · -19.1%
Race, ethnicity, and origin ACS 2023
- Neighborhood character
- Predominantly Black (92%)
- Race & ethnicity
- Black 92% White 5% Two or more races 2%
- Foreign-born
- 0%
- Languages at home
- 99% English-only · Spanish 1%
Political lean MEDSL · St. Louis
- 2024 margin
- Solid D (+64.7) · D 81.4% · R 16.7% · Other 2.0%
- 2008→2024 swing
- -3.5pp toward R · 2008: 68.2pp · 2024: 64.7pp
- All cycles
- 2024: D+64.7 2020: D+66.2 2016: D+63.7 2012: D+66.6 2008: D+68.2
Not yet ingested
- Civics
- —
Market trends
- HPI YoY
- ▼ -38.51%
- Current HPI
- 84.224
- Rent YoY
- —
- Metro
- St. Louis, MO-IL
- State GDP YoY
- ▲ 1.84%
- F500 in state
- 20
Industry mix (Fortune 500 HQ in MO)
| Industry | F500 HQs | Revenue |
|---|---|---|
| Healthcare | 1 | $163B |
|
||
| Insurance | 1 | $21B |
|
||
| Industrial Technology | 1 | $17B |
|
||
| Retail | 1 | $16B |
|
||
| Industrial Distribution | 1 | $10B |
|
||
| Utilities | 1 | $9B |
|
||
Price history
+114.3% since first listed5 events — show timeline
- 2026-06-16 Relisted — MARIS as Distributed by MLS Grid
- 2026-06-07 Contingent — MARIS as Distributed by MLS Grid
- 2026-05-14 Listed $45,000 MARIS as Distributed by MLS Grid
- 2018-12-31 Sold (Public Records) $304,000 Public Records
- 2006-05-15 Sold (Public Records) $21,000 Public Records
Property tax history
-1.2%/yrLatest (2024): $200 · +4.4% YoY. Source: county tax records.
Cash-flow waterfall
monthlySold comps — $/sqft
last 12 mo · ≤1 miLoading sold comps…