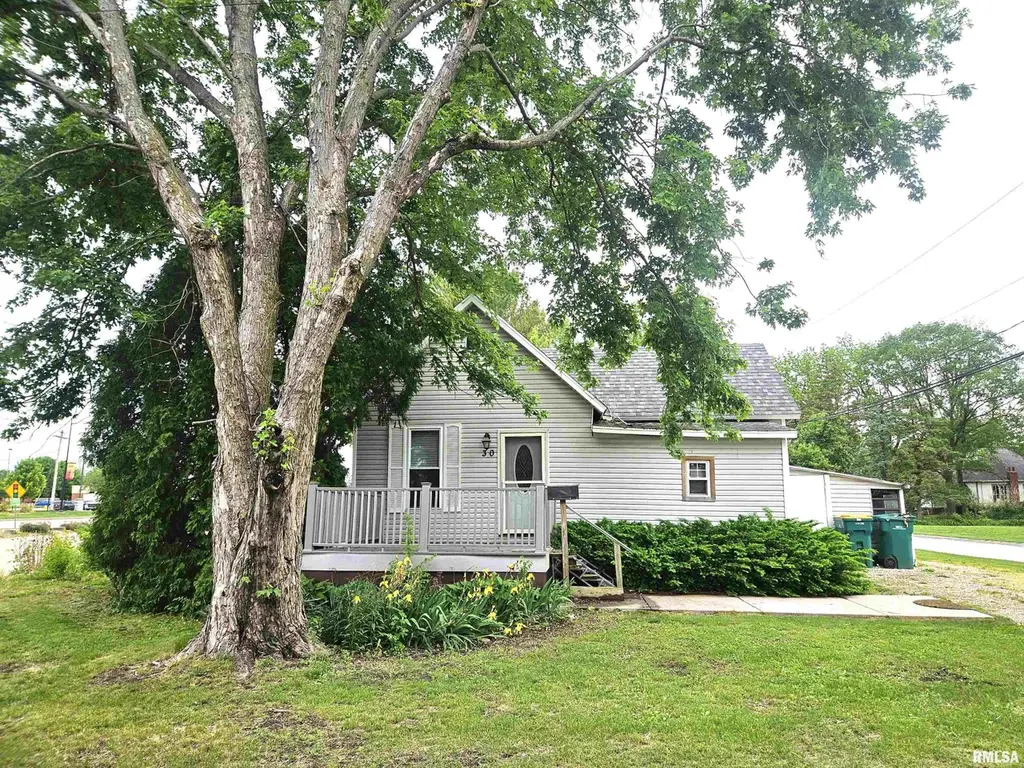
30 N Elm St · Galesburg, IL
Flood risk 1/10 · Minimal
- FEMA flood zone
- X (unshaded)
- Chance of flooding over 30 yrs
- 0.0%
- Est. flood insurance / yr
- $507 – $1,088
Fire risk 1/10 · Minimal
- Est. fire insurance / yr
- $804 – $1,492
Heat risk 3/10 · Minor
- Hot days now (above 104°F)
- 7 days/yr
- Hot days in 30 yrs
- 17 days/yr
Wind risk 2/10 · Minimal
- Chance of severe wind over 30 yrs
- 1.0%
Air-quality risk 3/10 · Minor
- Unhealthy air days now
- 2 days/yr
- Unhealthy air days in 30 yrs
- 3 days/yr
Risk factors via First Street. Map © Google.
Why this score? — see what drove the B grade
The composite is a weighted blend of 9 inputs, each scored 0–100. Each bar is that input's sub-score; the figure is the points it added to the 100-point composite (weight × sub-score).
- Cash flow +30.0/30.0
- ARV discount +15.0/15.0
- 1% rule +10.0/10.0
- DSCR +10.0/10.0
- Livability +3.5/5.0
- Rent growth +2.5/5.0
- Condition / age +2.5/5.0
- Schools +1.4/10.0
- Appreciation +0.0/10.0
$39,000
🖨 Deal sheet 📄 Offer letter ✓ Due diligence
Listing remarks
INVESTOR OR HANDYMAN ALERT!! This one bedroom, one bath home is waiting for its makeover and it's ready to shine! On a nice sized corner lot just off E. Main, this fixer-upper comes with a four year old furnace and a roof that is less than ten years old to get you started. Newer LVP flooring greets you in the living room, with new carpet in the nice sized bedroom and bonus room, which is the perfect size for a den or office. The galley kitchen is complete with a newer refrigerator and it's just a few steps from the oversized laundry area. Vinyl siding, a composite decking front porch, back patio, and park like back yard add to the package, but WAIT, there's more! A 10 X 14 one bed, one bath
Key facts
- New carpet
- Galley kitchen
- Newer lvp flooring
Tags
Property features AI
Exterior
- Parking: On-street parking; Gravel parking
- Utilities: Public water; Public sewer
- Home design: Single-family residence; Built in 1882
- Construction: Shingle roof; Full unfinished basement
- Exterior features: Corner lot; Level lot; Dead-end street; Paved road
Interior
- Kitchen: Dishwasher; Microwave; Refrigerator
- Bedrooms: 1 bedroom (main level)
- Flooring: Carpet; Luxury vinyl plank; Laminate; Other
- Bathrooms: 1 full bathroom
- Heating & cooling: Forced air heating; Gas water heater; No cooling
- Interior features: Cable available; Ceiling fans; High-speed internet
- Laundry & utility: Washer; Dryer; Laundry room (main level)
Neighborhood map
What this means for you Summary
Snapshot
- This is a 1-bed/1.0-bath single-family listed at $39k.
Deal economics
- At list price, monthly cash flow is $652 ($8k/yr) — positive.
- The deal already cash-flows at list — no discount required.
- Meets the 1% rule at list price ($1k rent vs $39k).
- Cap rate 26.4% vs local median 6.4% in Galesburg — top-decile yield for the area; either an underpriced asset or a hidden risk that comps aren't pricing in. Stress-test before assuming the spread holds.
Location & tenants
- Location reads 70/100 on livability (#367 in IL) — a middle-class / working-renter tenant base. Strengths: cost of living A+, housing A+, health & safety A+; Watch: crime F, commute F, employment D-.
- Galesburg CUSD 205 (town): math 13% / reading 22% proficiency, ranked #488 of 620 in IL (top 79%) — low school quality limits family demand, transient renter base, plan for 1-2y turnover.
- Zoned schools: Galesburg Senior High School (math 19% / reading 24%, grade F, #345 of 693 statewide, top 50%, 1,762 students, 0% FRL) — zoned schools average 0% FRL vs 60% district-wide (60 pts lower); this property's tenant base skews higher-income than the district average.
- Market conditions: 191 active listings in the ZIP.
Forward outlook
- Local home prices are declining (-3.0%/yr); year-one equity from $270 of loan paydown is wiped out by about $1k of value loss. Plan a longer hold.
- Knox County population projected at -19% by 2050 — secular population decline; favor cash flow + early exit over multi-decade hold.
- At projected returns (-3.0% appreciation + 3.0% rent growth), your $11k cash investment doubles in ~2 years — after that, you're playing with house money.
Negotiation context
- Only 2 days on market — expect competitive offers; lowballing is unlikely to land.
Risks & watch-outs
- Watch-outs: built in 1882 — expect roof / HVAC / electrical / plumbing capex.
Questions for the listing agent
- Built in 1882 — when were the roof, HVAC, electrical panel, plumbing, and water heater last replaced?
- Is there a deadline driving the sale (1031 exchange, divorce, estate, relocation)? That informs how much negotiation room exists.
- Schools are F-rated, which usually means shorter tenancies and higher turnover. Who's the typical renter profile here, and what's been the actual vacancy rate?
- Crime grade is F in this area — have there been break-ins, vandalism, or insurance claims at this property in the last 3 years? What carrier currently insures it and at what premium?
- What's the average days-on-market for RENTAL listings here right now (not sales)? A rising rental-DOM trend means longer vacancies and softer asking-rent achievability than the comps imply.
- What's the recent tenant-quality profile in this submarket — average credit score on applications, eviction rate, late-payment / NSF rate, and stable-employment percentage? A property-management company in the area should have these aggregated.
- How much new for-sale + rental construction is in the pipeline within 1–3 miles? Heavy new supply typically softens prices + rents 12–24 months out; constrained supply supports both.
Investment metrics
- 1% rule
- 2.92% ✓
- Cap rate
- 26.37%
- Cash-on-cash
- 71.70%
- DSCR
- 4.19
- GRM
- 2.9
CMA / ARV
- ARV (on-the-fly)
- $58,624
- Comps found
- 12
Show comp detail 12 sales within ~0.75 mi
| Address | Dist | Beds/Ba | Sqft | Sold | Price | $/sf | Match |
|---|---|---|---|---|---|---|---|
| 1961 Washington St | 0.22mi | 2/1.0 (+1) | 952 (+4%) | 9mo | $54,900 | $58 | 70 |
| 100 Lake St | 0.25mi | 2/1.0 (+1) | 860 (-6%) | 8mo | $84,000 | $98 | 67 |
| 95 Phillips St | 0.63mi | 2/1.0 (+1) | 964 (+5%) | 8mo | $55,000 | $57 | 50 |
| 1397 Haynor St | 0.66mi | 2/1.0 (+1) | 980 (+7%) | 3mo | $71,000 | $72 | 50 |
| 179 Arnold St | 0.55mi | 2/1.0 (+1) | 928 (+1%) | 21mo | $124,500 | $134 | 49 |
| 411 Arnold St | 0.64mi | 2/1.0 (+1) | 964 (+5%) | 11mo | $60,000 | $62 | 47 |
| 85 Phillips St | 0.63mi | 2/1.0 (+1) | 848 (-7%) | 9mo | $54,000 | $64 | 45 |
| 1837 Baird Ave | 0.74mi | 2/1.0 (+1) | 978 (+7%) | 9mo | $97,000 | $99 | 42 |
| 1526 Grand Ave | 0.67mi | 2/1.0 (+1) | 792 (-14%) | 9mo | $44,400 | $56 | 33 |
| 120 Arnold St | 0.57mi | 2/1.0 (+1) | 1,014 (+11%) | 21mo | $58,000 | $57 | 33 |
| 1337 E North St | 0.72mi | 2/1.0 (+1) | 834 (-9%) | 17mo | $24,000 | $29 | 32 |
| 409 Burgland Ave | 0.75mi | 2/1.0 (+1) | 816 (-11%) | 14mo | $62,000 | $76 | 31 |
Match score weights: distance 35% · size 25% · config 20% · recency 20%. Top-matched comps best support the ARV.
Projected returns pro-forma
-3.0% appreciation · 3.0% rent growth · sell at horizon
- IRR
- 71.3%
- Equity multiple
- 4.23×
- Total profit
- $35,238
- Equity at exit
- $5,815
- IRR
- 75.3%
- Equity multiple
- 8.71×
- Total profit
- $84,205
- Equity at exit
- $3,372
Cash invested: $10,920 (down + closing). Projections, not guarantees.
Landlord ↔ Tenant lean methodology
- Overall (STATE)
- 43 Moderately Tenant-Leaning
- State Illinois
- 43 Moderately Tenant-Leaning · D+7
- County
- — inherits STATE
- City
- — inherits STATE
ZIP-level market 61401
- Active inventory
- 191
- Price-to-rent
- 2.9×
Monthly cashflow live
- Estimated rent
- $1,138 medium interval (Pro) →
- Mortgage (P&I)
- −$205
- Tax from tax record
- −$26 /mo · $306/yr
- Insurance
- −$16
- HOA
- −$0
- Vacancy / Maint / Mgmt
- −$239
- Net cashflow
- $652
Break-even live
UW: 25.0% down · 7.5% · 30yr · 1.5% tax · 5.0% vac · 8.0% maint · 8.0% mgmt
Financing live
Cash to close
- Down payment
- $9,750
- Closing costs
- $1,170
- Reserves months
- —
- Total cash needed
- —
Loan-product check · same deal, 3 products live
Conventional
25% down · 7.5% · 30yr
- Down + closing
- —
- Monthly P&I
- —
- Monthly cashflow
- —
- DSCR
- —
- Eligible?
- —
Personal DTI + credit; lowest rate.
DSCR
20% down · 8.5% · 30yr
- Down + closing
- —
- Monthly P&I
- —
- Monthly cashflow
- —
- DSCR
- —
- Eligible?
- —
No personal income docs; deal must DSCR.
Hard money
10% down · 12.0% · 12mo
- Down + closing
- —
- Monthly P&I
- —
- Monthly cashflow
- —
- DSCR
- —
- Eligible?
- —
Short-term bridge; refi at stabilization.
Listing history 2 events
-
2026-05-21status Pending
-
2026-05-19$39,000 Active
ⓘ Source: listings_history table (triggers on properties + properties_extension) + one-shot
backfill from property_details.listing_events for pre-trigger history.
Tax reassessment forecast IL · Partial reset (capped growth)
- Current annual tax
- $306 · $26/mo
- Projected year-2 tax
- $596 · $50/mo
- Expected delta
- +$290/yr (+$24/mo · 94.6%)
ⓘ Screening estimate from a state-policy table — verify with the county assessor before closing.
Climate risk First Street
- Flood 1/10 Low FEMA zone X (unshaded) · 0% chance over 30 yrs
- Wildfire 1/10 Low
- Heat 3/10 Moderate 7 d/yr ≥104°F today · 17 d/yr by 30 yrs out
- Wind 2/10 Low 100% chance of damaging wind over 30 yrs
- Air quality 3/10 Moderate 2 unhealthy d/yr today · 3 by 30 yrs out
Nearby sold comps map
Loading sold comps map…
Walkable amenities ~0.75 mi
Loading nearby amenities…
Taxation est. · year 1
- Rental income
- $13,652
- − Mortgage interest
- −$2,185
- − Property taxes
- −$306
- − Insurance
- −$195
- − Repairs & maintenance
- −$1,092
- − Management
- −$1,092
- − Depreciation
- −$1,135
- Taxable income
- $7,647
- Est. tax owed @ 24.0%
- −$1,835
- After-tax cash flow
- $5,994/yr
For passive investors: Depreciation is non-cash, so a rental often shows a tax loss while cash-flowing — sheltering income. Rental losses are passive: they offset passive income freely, and up to $25,000/yr can offset ordinary (W-2) income if you actively participate and your MAGI is under $100k (phasing out to $0 by $150k); unused losses carry forward. On sale, claimed depreciation is recaptured at up to 25%, and gains may owe capital-gains tax (a 1031 exchange can defer both). Figures are a year-1 estimate at your 24.0% rate — not tax advice; consult a CPA.
Schools (NCES district)
- District
- Galesburg CUSD 205
- NCES district ID
- 1716080
- Math proficiency
- 13% ▼ -8.00%
- Reading proficiency
- 22% ▼ -11.00%
- Median HH income
- $35,901
- Composite
- 14.46/100
- National rank
- #9427
- State rank
- #488 of 620 in IL
Livability — Galesburg
- Score
- 70/100
- State rank
- #367
- US rank
- #7601
Category grades
Schools grade is shown separately in the Schools card above.
Census & demographics
- Census place
- Galesburg, IL
- City population
- 32,318
- Population (ZIP)
- 30,684
Population outlook (Knox County) Hauer SSP2
- Today (2025)
- 48,224 people
- By 2030
- 46,333 · -3.9%
- By 2040
- 42,424 · -12.0%
- By 2050
- 38,929 · -19.3%
- By 2075
- 31,523 · -34.6%
- By 2100
- 24,092 · -50.0%
Race, ethnicity, and origin ACS 2023
- Neighborhood character
- Predominantly White (77%)
- Race & ethnicity
- White 77% Black 8% Hispanic / Latino 8% Two or more races 8% Asian 1%
- Hispanic origin (detail)
- Mexican 6%
- Common ancestry
- Italian 2% Serbian 1% Slovak 1%
- Foreign-born
- 4% · Canada, Vietnam
- Languages at home
- 92% English-only · Spanish 5% French/Haitian/Cajun 1% Other Indo-European 1%
Political lean MEDSL · Knox
- 2024 margin
- Lean R (+9.4) · D 44.4% · R 53.7% · Other 1.9%
- 2008→2024 swing
- -29.3pp toward R · 2008: 19.9pp · 2024: -9.4pp
- All cycles
- 2024: R+9.4 2020: R+5.6 2016: R+3.3 2012: D+17.1 2008: D+19.9
Not yet ingested
- Civics
- —
Market trends
- HPI YoY
- ▼ -95.48%
- Current HPI
- 157.276
- Rent YoY
- —
- Metro
- —
- State GDP YoY
- ▲ 1.59%
- F500 in state
- 60
Industry mix (Fortune 500 HQ in IL)
| Industry | F500 HQs | Revenue |
|---|---|---|
| Insurance | 4 | $201B |
|
||
| Consumer Goods | 4 | $87B |
|
||
| Industrial Machinery | 3 | $64B |
|
||
| Healthcare | 2 | $55B |
|
||
| Retail / Pharmacy | 1 | $148B |
|
||
| Agriculture / Food | 1 | $86B |
|
||
Price history
2 events — show timeline
- 2026-05-21 Pending — RMLSA as Distributed by MLS Grid
- 2026-05-19 Listed $39,000 RMLSA as Distributed by MLS Grid
Property tax history
-7.4%/yrLatest (2024): $306 · +5.2% YoY. Source: county tax records.
Cash-flow waterfall
monthlySold comps — $/sqft
last 12 mo · ≤1 miLoading sold comps…