 Duplex
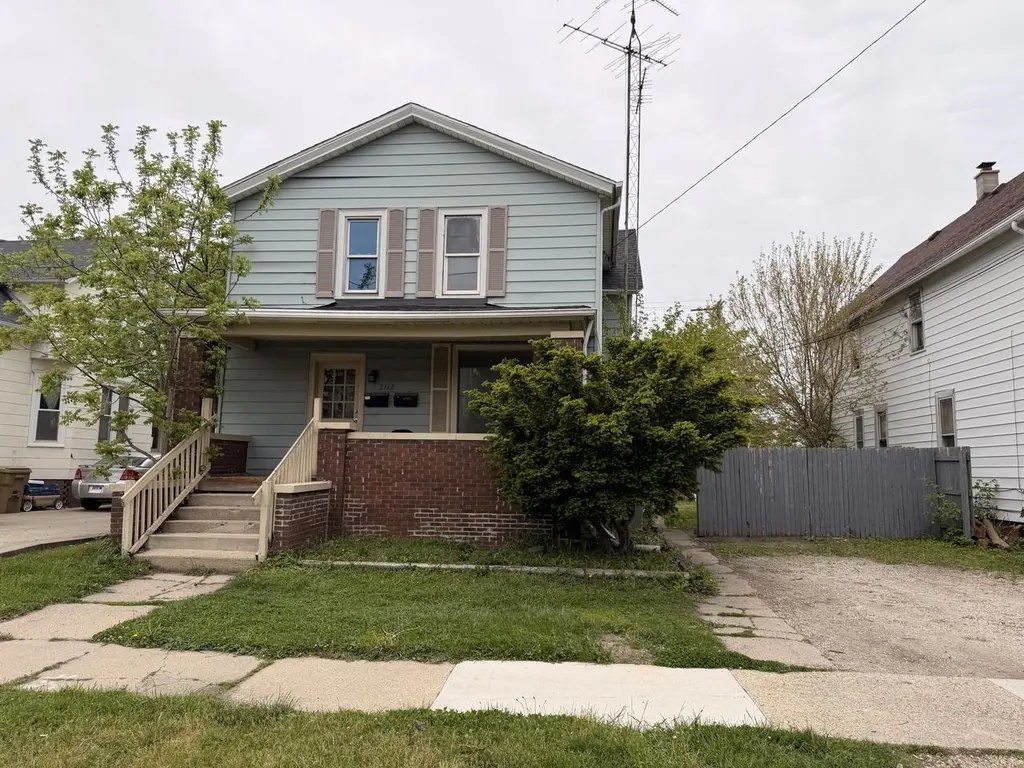
2112 53rd St · Kenosha, WI
Flood risk 5/10 · Moderate
- FEMA flood zone
- X (unshaded)
- Chance of flooding over 30 yrs
- 0.47%
- Est. flood insurance / yr
- $473 – $860
Fire risk 1/10 · Minimal
- Est. fire insurance / yr
- $636 – $1,182
Heat risk 2/10 · Minimal
- Hot days now (above 96°F)
- 7 days/yr
- Hot days in 30 yrs
- 14 days/yr
Wind risk 2/10 · Minimal
- Chance of severe wind over 30 yrs
- —
Air-quality risk 3/10 · Minor
- Unhealthy air days now
- 2 days/yr
- Unhealthy air days in 30 yrs
- 3 days/yr
Risk factors via First Street. Map © Google.
Why this score? — see what drove the C+ grade
The composite is a weighted blend of 9 inputs, each scored 0–100. Each bar is that input's sub-score; the figure is the points it added to the 100-point composite (weight × sub-score).
- Cash flow +26.4/30.0
- DSCR +9.0/10.0
- ARV discount +7.2/15.0
- 1% rule +6.5/10.0
- Livability +4.2/5.0
- Rent growth +4.0/5.0
- Schools +2.5/10.0
- Condition / age +2.5/5.0
- Appreciation +0.0/10.0
$235,000
🖨 Deal sheet 📄 Offer letter ✓ Due diligence
Multi-family units
County records classify this as Multi-Family (2-4 Unit). Listing-text estimate: 2 units. confirmed
Listing remarks MLS
Income Maker! Large 2 family w/ 2 bedroom each unit, detached garage, paved alley entrance, plenty of off street parking in the front and rear, large fenced yard. being sold as is. * * rooms sizes estimated * *
Key facts
- Fresh paint
- Completely remodeled
- New appliances
Tags
Property features AI
Finance
- Other: Tenant personal property excluded
Exterior
- Parking: Detached 1-car garage; Additional 0.5 garage parking space (total 1.5 garage spaces); 1 on-site parking space
- Utilities: Municipal water; Municipal sewer
- Home design: 2-story duplex (multi-family property); Two-unit building
- Construction: Information source: Assessor/Public Record
- Exterior features: Vinyl exterior; Lot size approximately 0.13 acres; Acreage less than 1/2 acre; Zoned RG2
Interior
- Kitchen: Unit 2 kitchen on main level; Includes 2 ranges/ovens and 2 refrigerators (inclusions listed)
- Bedrooms: Unit 1: 2 bedrooms; Unit 2: 2 bedrooms (master on main level, second bedroom on main level)
- Bathrooms: Unit 1: 1 full bathroom; Unit 2: 1 full bathroom
- Interior features: Full basement
- Laundry & utility: 2 electric meters; 2 gas meters
Neighborhood map
What this means for you Summary
Snapshot
- This is a 2 × 2-bed/1-bath units multifamily listed at $235k.
Deal economics
- At list price, monthly cash flow is $611 ($7k/yr) — positive. Per door: $305/mo.
- The deal already cash-flows at list — no discount required.
- Meets the 1% rule at list price ($3k rent vs $235k).
- Recommended offer: $231k (1.5% below list) — sets the bar for market timing.
- Cap rate 9.4% vs local median 4.0% in Kenosha — top-decile yield for the area; either an underpriced asset or a hidden risk that comps aren't pricing in. Stress-test before assuming the spread holds.
Location & tenants
- Location reads 84/100 on livability (#31 in WI, #680 nationally) — a professional / high-income tenant draw. Strengths: commute A+, cost of living A+, housing A+; Watch: employment C-, schools D+.
- Kenosha School District (suburban): math 26% / reading 31% proficiency, ranked #287 of 342 in WI (top 84%) — low school quality limits family demand, transient renter base, plan for 1-2y turnover.
- Market conditions: Rents rising fast (+6.0%/yr); 43 active listings in the ZIP; 4 comparable units currently listed for rent nearby; rentals lingering (median 44d on market — plan ~5-8 weeks vacancy on turnover, expect pricing pressure); 50% of comp listings sitting > 30 days — soft ceiling on asking rent; 259 units permitted in Kenosha County in 2024 (8 in 5+ unit buildings).
- At $2,692/mo this rent would consume 56% of the median local household income ($58k/yr) (locally 1576% of renters already pay >50% of income on rent) — very limited rent-growth headroom before tenants either downsize or default.
Forward outlook
- Local home prices are declining (-3.0%/yr); year-one equity from $2k of loan paydown is wiped out by about $7k of value loss. Plan a longer hold.
- At projected returns (-3.0% appreciation + 6.0% rent growth), your $66k cash investment doubles in ~8 years — after that, you're playing with house money.
Negotiation context
- It's been on market 21 days — a 2% lower offer ($231k) is reasonable based on typical stale-listing flexibility.
- 4 sale attempts since 11y ago with the ask held roughly flat each time — persistent listings suggest the price (not the market) is what's stuck; bring a comps-based counter.
- Current owner paid $71k; list at $235k implies a 230% gain — meaningful room to come down on a strong offer.
Risks & watch-outs
- Watch-outs: built in 1905 — expect roof / HVAC / electrical / plumbing capex.
- Climate carrying-cost: moderate flood risk — expect insurance premiums to compound above CPI over the hold.
Questions for the listing agent
- Can we see the unit-by-unit rent roll, current vacancy, and any below-market leases? What's the average tenancy length?
- What capital expenditures (roof, boiler, parking lot, exteriors) have been made in the last 5 years, and what's planned in the next 2?
- Built in 1905 — when were the roof, HVAC, electrical panel, plumbing, and water heater last replaced?
- Is there a deadline driving the sale (1031 exchange, divorce, estate, relocation)? That informs how much negotiation room exists.
- Schools are D-rated, which usually means shorter tenancies and higher turnover. Who's the typical renter profile here, and what's been the actual vacancy rate?
- What's the average days-on-market for RENTAL listings here right now (not sales)? A rising rental-DOM trend means longer vacancies and softer asking-rent achievability than the comps imply.
- What's the recent tenant-quality profile in this submarket — average credit score on applications, eviction rate, late-payment / NSF rate, and stable-employment percentage? A property-management company in the area should have these aggregated.
- How much new apartment / multifamily construction is in the pipeline within 1–3 miles? Heavy new supply (>2% of stock underway) typically softens rents 12–24 months out; light construction supports rent growth.
Investment metrics
- 1% rule
- 1.15% ✓
- Cap rate
- 9.41%
- Cash-on-cash
- 11.14%
- DSCR
- 1.50
- GRM
- 7.3
CMA / ARV
- ARV (on-the-fly)
- $233,220
- Comps found
- 12
Show comp detail 12 sales within ~0.75 mi
| Address | Dist | Beds/Ba | Sqft | Sold | Price | $/sf | Match |
|---|---|---|---|---|---|---|---|
| 2005 56th St | 0.28mi | 3/2.0 (-1) | 1,809 (+1%) | 10mo | $215,000 | $119 | 72 |
| 5432 25th Ave | 0.27mi | 3/2.0 (-1) | 1,844 (+3%) | 10mo | $240,000 | $130 | 69 |
| 5428 25th Ave | 0.27mi | 4/2.0 | 1,668 (-7%) | 9mo | $150,000 | $90 | 68 |
| 4615 10th Ave | 0.73mi | 4/2.0 | 1,806 (+1%) | 0mo | $257,500 | $143 | 65 |
| 1205 58th St | 0.61mi | 4/2.0 | 1,856 (+4%) | 3mo | $212,000 | $114 | 63 |
| 1828 45th St | 0.56mi | 4/2.0 | 1,728 (-4%) | 7mo | $250,000 | $145 | 62 |
| 4826 20th Ave | 0.33mi | 4/2.0 | 1,610 (-10%) | 8mo | $205,000 | $127 | 61 |
| 5007 25th Ave | 0.31mi | 4/2.0 | 1,539 (-14%) | 2mo | $217,500 | $141 | 60 |
| 5003 26th Ave #5005 | 0.35mi | 4/4.0 | 1,696 (-6%) | 8mo | $338,000 | $199 | 59 |
| 6018 20th Ave | 0.50mi | 4/2.0 | 1,920 (+7%) | 9mo | $225,000 | $117 | 58 |
| 5619 14th Ave | 0.47mi | 4/2.0 | 1,968 (+10%) | 7mo | $270,000 | $137 | 56 |
| 4413 19th Ave | 0.59mi | 3/2.0 (-1) | 1,628 (-9%) | 0mo | $178,000 | $109 | 52 |
Match score weights: distance 35% · size 25% · config 20% · recency 20%. Top-matched comps best support the ARV.
Projected returns pro-forma
-3.0% appreciation · 5.98% rent growth · sell at horizon
- IRR
- 3.5%
- Equity multiple
- 1.14×
- Total profit
- $9,116
- Equity at exit
- $35,039
- IRR
- 15.5%
- Equity multiple
- 2.43×
- Total profit
- $94,199
- Equity at exit
- $20,319
Cash invested: $65,800 (down + closing). Projections, not guarantees.
Landlord ↔ Tenant lean methodology
- Overall (STATE)
- 73 Landlord-Friendly
- State Wisconsin
- 73 Landlord-Friendly · R+2
- County
- — inherits STATE
- City
- — inherits STATE
ZIP-level market 53140
- Rents YoY
- 6.0%
- Active inventory
- 43
- Price-to-rent
- 14.5×
Monthly cashflow live
- Estimated rent
- $2,692 high interval (Pro) →
- Mortgage (P&I)
- −$1,232
- Tax from tax record
- −$185 /mo · $2,226/yr
- Insurance
- −$98
- HOA
- −$0
- Vacancy / Maint / Mgmt
- −$565
- Net cashflow
- $611
Break-even live
2-unit breakdown (identical units grouped — click to expand)
| Units | Beds | Baths | Est. rent |
|---|---|---|---|
| 2× units | 2 | 1 | $2,692 |
| #1 | 2 | 1 | $1,346 |
| #2 | 2 | 1 | $1,346 |
| Total (2 units) | $2,692 | ||
UW: 25.0% down · 7.5% · 30yr · 1.5% tax · 5.0% vac · 8.0% maint · 8.0% mgmt
Financing live
Cash to close
- Down payment
- $58,750
- Closing costs
- $7,050
- Reserves months
- —
- Total cash needed
- —
Loan-product check · same deal, 3 products live
Conventional
25% down · 7.5% · 30yr
- Down + closing
- —
- Monthly P&I
- —
- Monthly cashflow
- —
- DSCR
- —
- Eligible?
- —
Personal DTI + credit; lowest rate.
DSCR
20% down · 8.5% · 30yr
- Down + closing
- —
- Monthly P&I
- —
- Monthly cashflow
- —
- DSCR
- —
- Eligible?
- —
No personal income docs; deal must DSCR.
Hard money
10% down · 12.0% · 12mo
- Down + closing
- —
- Monthly P&I
- —
- Monthly cashflow
- —
- DSCR
- —
- Eligible?
- —
Short-term bridge; refi at stabilization.
Rent comps 4 comps
| Address | Beds | Baths | Sqft | Rent | $/sqft | DOM | Units | Dist |
|---|---|---|---|---|---|---|---|---|
| 5432 23rd Ave Kenosha, WI | 4.0 | 2.0 | 1400 | $1,695 | $1.21 | 3d | 1 | 0.17mi |
| 1510 57th St Unit 2 Kenosha, WI | 4.0 | 2.0 | 1700 | $1,800 | $1.06 | 43d | 1 | 0.42mi |
| 3905 29th Ave Kenosha, WI | 3.0 | 2.0 | 1550 | $1,600 | $1.03 | 18d | 1 | 1.12mi |
| 2114 36th St Kenosha, WI | 3.0 | 2.0 | 1889 | $3,200 | $1.69 | 43d | 1 | 1.21mi |
Listing history 28 events
-
2026-06-18days on market $235,000 Active 21 DOM
-
2026-06-17days on market $235,000 Active 20 DOM
-
2026-06-16days on market $235,000 Active 19 DOM
-
2026-06-15days on market $235,000 Active 18 DOM
-
2026-06-13days on market $235,000 Active 16 DOM
-
2026-06-09days on market $235,000 Active 12 DOM
-
2026-06-08days on market $235,000 Active 11 DOM
-
2026-06-07days on market $235,000 Active 10 DOM
-
2026-06-04days on market $235,000 Active 7 DOM
-
2026-06-03days on market $235,000 Active 6 DOM
-
2026-06-02days on market $235,000 Active 5 DOM
-
2026-06-01days on market $235,000 Active 4 DOM
-
2026-05-31days on market $235,000 Active 3 DOM
-
2026-05-28$235,000 Active
-
2024-04-23historical $900
-
2024-04-16$900
-
2018-06-22soldstatus $71,200 Sold 213-char remark
Show marketing remark (213 chars)
Income Maker! Large 2 family w/ 2 bedroom each unit, detached garage, paved alley entrance, plenty of off street parking in the front and rear, large fenced yard. being sold as is. * * rooms sizes estimated * *
-
2018-05-25historical Contingent 213-char remark
Show marketing remark (213 chars)
Income Maker! Large 2 family w/ 2 bedroom each unit, detached garage, paved alley entrance, plenty of off street parking in the front and rear, large fenced yard. being sold as is. * * rooms sizes estimated * *
-
2018-05-23price $79,000 213-char remark
Show marketing remark (213 chars)
Income Maker! Large 2 family w/ 2 bedroom each unit, detached garage, paved alley entrance, plenty of off street parking in the front and rear, large fenced yard. being sold as is. * * rooms sizes estimated * *
-
2018-05-18price $80,000 213-char remark
Show marketing remark (213 chars)
Income Maker! Large 2 family w/ 2 bedroom each unit, detached garage, paved alley entrance, plenty of off street parking in the front and rear, large fenced yard. being sold as is. * * rooms sizes estimated * *
-
2018-05-07price $84,900 213-char remark
Show marketing remark (213 chars)
Income Maker! Large 2 family w/ 2 bedroom each unit, detached garage, paved alley entrance, plenty of off street parking in the front and rear, large fenced yard. being sold as is. * * rooms sizes estimated * *
-
2018-04-23$89,900 Active 213-char remark
Show marketing remark (213 chars)
Income Maker! Large 2 family w/ 2 bedroom each unit, detached garage, paved alley entrance, plenty of off street parking in the front and rear, large fenced yard. being sold as is. * * rooms sizes estimated * *
-
2015-03-10historical 233-char remark
Show marketing remark (233 chars)
Large 2 family 2 bedroom each unit, detached garage, paved alley entrance, plenty of off street parking in the front and rear, private fenced fenced yard. Currently under renovation, being sold as is. * * rooms sizes estimated * *
-
2015-02-17price $44,900 233-char remark
Show marketing remark (233 chars)
Large 2 family 2 bedroom each unit, detached garage, paved alley entrance, plenty of off street parking in the front and rear, private fenced fenced yard. Currently under renovation, being sold as is. * * rooms sizes estimated * *
-
2015-01-26$49,900 Active 233-char remark
Show marketing remark (233 chars)
Large 2 family 2 bedroom each unit, detached garage, paved alley entrance, plenty of off street parking in the front and rear, private fenced fenced yard. Currently under renovation, being sold as is. * * rooms sizes estimated * *
-
2014-10-30soldstatus $17,500
-
2014-09-03soldstatus $12,000
-
1980-03-01soldstatus $30,000
ⓘ Source: listings_history table (triggers on properties + properties_extension) + one-shot
backfill from property_details.listing_events for pre-trigger history.
Tax reassessment forecast WI · Partial reset (capped growth)
- Current annual tax
- $2,226 · $185/mo
- Projected year-2 tax
- $3,287 · $274/mo
- Expected delta
- +$1,061/yr (+$88/mo · 47.7%)
ⓘ Screening estimate from a state-policy table — verify with the county assessor before closing.
Climate risk First Street
- Flood 5/10 Major FEMA zone X (unshaded) · 47% chance over 30 yrs
- Wildfire 1/10 Low
- Heat 2/10 Low 7 d/yr ≥96°F today · 14 d/yr by 30 yrs out
- Wind 2/10 Low
- Air quality 3/10 Moderate 2 unhealthy d/yr today · 3 by 30 yrs out
Nearby sold comps map
Loading sold comps map…
Walkable amenities ~0.75 mi
Loading nearby amenities…
Taxation est. · year 1
- Rental income
- $32,304
- − Mortgage interest
- −$13,164
- − Property taxes
- −$2,226
- − Insurance
- −$1,175
- − Repairs & maintenance
- −$2,584
- − Management
- −$2,584
- − Depreciation
- −$6,836
- Taxable income
- $3,735
- Est. tax owed @ 24.0%
- −$896
- After-tax cash flow
- $6,435/yr
For passive investors: Depreciation is non-cash, so a rental often shows a tax loss while cash-flowing — sheltering income. Rental losses are passive: they offset passive income freely, and up to $25,000/yr can offset ordinary (W-2) income if you actively participate and your MAGI is under $100k (phasing out to $0 by $150k); unused losses carry forward. On sale, claimed depreciation is recaptured at up to 25%, and gains may owe capital-gains tax (a 1031 exchange can defer both). Figures are a year-1 estimate at your 24.0% rate — not tax advice; consult a CPA.
Schools (NCES district)
- District
- Kenosha School District
- NCES district ID
- 5507320
- Math proficiency
- 26% ▼ -9.00%
- Reading proficiency
- 31% ▼ -6.00%
- Median HH income
- $52,407
- Composite
- 25.17/100
- National rank
- #7516
- State rank
- #287 of 342 in WI
Livability — Kenosha
- Score
- 84/100
- State rank
- #31
- US rank
- #680
Category grades
Schools grade is shown separately in the Schools card above.
Census & demographics
- Census place
- Kenosha, WI
- County
- Kenosha County · 130,343 people
- City population
- 85,271
- Metro
- Chicago-Naperville-Elgin, IL-IN-WI
- Population (ZIP)
- 30,238
- Household income
- $58,006
- Rent vs Own
- Severe rent burden
- 1576.0
Population outlook (Kenosha County) Hauer SSP2
- Today (2025)
- 174,032 people
- By 2030
- 174,923 · +0.5%
- By 2040
- 173,895 · -0.1%
- By 2050
- 170,102 · -2.3%
- By 2075
- 162,952 · -6.4%
- By 2100
- 154,781 · -11.1%
Race, ethnicity, and origin ACS 2023
- Neighborhood character
- Predominantly White (66%)
- Race & ethnicity
- White 66% Hispanic / Latino 19% Two or more races 14% Black 9% Asian 2%
- Hispanic origin (detail)
- Mexican 14% Puerto Rican 2%
- Common ancestry
- Romanian 7% Lithuanian 3% Portuguese 3%
- Foreign-born
- 10% · Canada
- Languages at home
- 83% English-only · Spanish 12% Other Indo-European 3% Other Asian/Pacific 1%
Political lean MEDSL · Kenosha
- 2024 margin
- Lean R (+6.2) · D 46.2% · R 52.5% · Other 1.3%
- 2008→2024 swing
- -24.3pp toward R · 2008: 18.1pp · 2024: -6.2pp
- All cycles
- 2024: R+6.2 2020: R+3.1 2016: R+0.3 2012: D+12.3 2008: D+18.1
Not yet ingested
- Civics
- —
Market trends
- HPI YoY
- ▼ -187.92%
- Current HPI
- 235.0929
- Rent YoY
- ▲ 5.98%
- Metro
- Chicago-Naperville-Elgin, IL-IN-WI
- State GDP YoY
- ▲ 2.10%
- F500 in state
- 20
Industry mix (Fortune 500 HQ in WI)
| Industry | F500 HQs | Revenue |
|---|---|---|
| Industrial Machinery | 4 | $23B |
|
||
| Industrial Technology | 2 | $36B |
|
||
| Insurance | 1 | $36B |
|
||
| Professional Services | 1 | $19B |
|
||
| Utilities | 1 | $9B |
|
||
| Consumer Goods | 1 | $3B |
|
||
Price history
+683.3% since first listed15 events — show timeline
- 2026-05-28 Listed $235,000 METROMLS
- 2024-04-23 Rental Removed $900 APPFOLIO
- 2024-04-16 Listed for Rent $900 APPFOLIO
- 2018-06-22 Sold (MLS) $71,200 METROMLS
- 2018-05-25 Contingent — METROMLS
- 2018-05-23 Price Changed $79,000 METROMLS
- 2018-05-18 Price Changed $80,000 METROMLS
- 2018-05-07 Price Changed $84,900 METROMLS
- 2018-04-23 Listed $89,900 METROMLS
- 2015-03-10 Listing Removed — METROMLS
- 2015-02-17 Price Changed $44,900 METROMLS
- 2015-01-26 Listed $49,900 METROMLS
- 2014-10-30 Sold (Public Records) $17,500 Public Records
- 2014-09-03 Sold (Public Records) $12,000 Public Records
- 1980-03-01 Sold (Public Records) $30,000 Public Records
Property tax history
+1.9%/yrLatest (2025): $2,226 · +5.6% YoY. Source: county tax records.
Cash-flow waterfall
monthlySold comps — $/sqft
last 12 mo · ≤1 miLoading sold comps…