18227 Pin Oak St · Alvin, TX
Flood risk 1/10 · Minimal
- FEMA flood zone
- AO
- Chance of flooding over 30 yrs
- 0.0%
- Est. flood insurance / yr
- $848 – $2,087
Fire risk 6/10 · Moderate
- Est. fire insurance / yr
- $1,222 – $2,270
Heat risk 9/10 · Severe
- Hot days now (above 110°F)
- 7 days/yr
- Hot days in 30 yrs
- 23 days/yr
Wind risk 9/10 · Severe
- Chance of severe wind over 30 yrs
- 99.0%
Air-quality risk 2/10 · Minimal
- Unhealthy air days now
- 1 days/yr
- Unhealthy air days in 30 yrs
- 1 days/yr
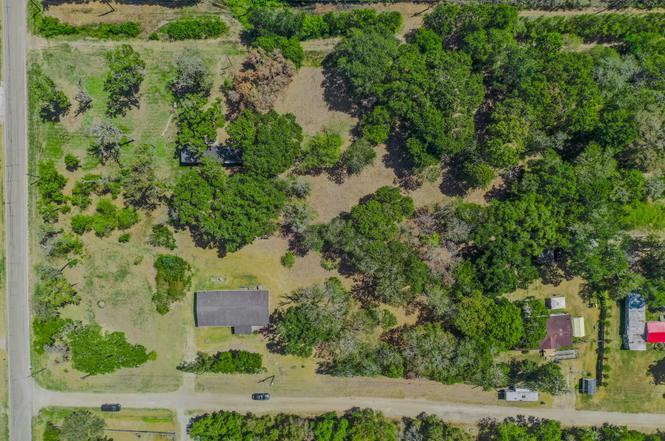
Risk factors via First Street. Map © Google.
Why this score? — see what drove the B- grade
The composite is a weighted blend of 9 inputs, each scored 0–100. Each bar is that input's sub-score; the figure is the points it added to the 100-point composite (weight × sub-score).
- Cash flow +28.6/30.0
- DSCR +10.0/10.0
- ARV discount +7.5/15.0
- 1% rule +7.4/10.0
- Schools +3.5/10.0
- Livability +3.2/5.0
- Rent growth +2.6/5.0
- Condition / age +2.5/5.0
- Appreciation +0.0/10.0
$150,000
🖨 Deal sheet (PDF) 📄 Offer letter ✓ Due diligence
Listing remarks
Country living with secluded feel yet still close to town! Set on 1/3 acre this cute 4 bedroom home has a great floor plan featuring spacious family room open to updated kitchen with double oven and large island work center with storage cabinets & breakfast area-both have pretty wood plank vinyl flooring. .. Split bedroom plan the primary bedroom & bath offer wood plank vinyl flooring, double sink vanity, huge walk in closet, oversized garden tub & separate shower. All secondary bedrooms are a nice size as well! Cute front porch overlooks your nicely cleared yet wooded property. This home is adjacent to four beautiful lots (1.28 addtl acres) also for sale at MLS#91093936!
Key facts
- Updated kitchen
- Split bedroom plan
- Double oven
Tags
Property features AI
Finance
- Other: Cleared, wooded lot with side yard; Asphalt road access; Lot about 0.32 acre
Exterior
- Parking: Additional parking
- Security: Smoke detector(s)
- Utilities: Well water; Septic tank
- Home design: Residential property; Built in 2014; Pillar/post/pier foundation
- Construction: Composition roof; Construction materials: Unknown
- Exterior features: Deck; Patio
Interior
- Kitchen: Double oven; Dishwasher; Electric cooktop; Electric oven
- Bedrooms: Primary bedroom on first floor (16 x 13); Bedroom on first floor (11 x 10); Bedroom on first floor (11 x 10); Bedroom on first floor (10 x 10)
- Flooring: Carpet; Plank; Vinyl
- Bathrooms: 2 full bathrooms
- Heating & cooling: Central heating (electric); Central air (electric)
- Interior features: Double vanity; High ceilings; Kitchen island; Kitchen/family room combo; Soaking tub; Separate shower; Vanity; Walk-in pantry; Ceiling fan(s)
- Laundry & utility: Washer hookup; Electric dryer hookup
Neighborhood map
What this means for you Summary
Snapshot
- This is a 4-bed/2.0-bath manufactured listed at $150k.
Deal economics
- At list price, monthly cash flow is $370 ($4k/yr) — positive.
- The deal already cash-flows at list — no discount required.
- Meets the 1% rule at list price ($2k rent vs $150k).
- Recommended offer: $141k (6.0% below list) — sets the bar for market timing.
- Cap rate 10.2% vs local median 2.7% in Alvin — top-decile yield for the area; either an underpriced asset or a hidden risk that comps aren't pricing in. Stress-test before assuming the spread holds.
Location & tenants
- Location reads 65/100 on livability (#704 in TX) — a middle-class / working-renter tenant base. Strengths: cost of living A+, housing A+; Watch: amenities F, commute F, health & safety F.
- Angleton ISD (suburban): math 36% / reading 44% proficiency, ranked #375 of 826 in TX (top 45%) — families likely to look elsewhere, expect single-tenant / working-renter base with shorter leases.
- Zoned schools: Frontier El (math 66% / reading 58%, grade B, #321 of 4,322 statewide, top 8%, 445 students, 53% FRL); Angleton J H School (math 26% / reading 41%, grade F, #911 of 1,662 statewide, top 56%, 1,561 students, 68% FRL); Angleton H S (math 22% / reading 45%, grade F, #1,011 of 1,632 statewide, top 63%, 2,066 students, 67% FRL).
- Market conditions: Rents flat; 1151 active listings in the ZIP; high-income renter base; 3,960 units permitted in Brazoria County in 2024 (593 in 5+ unit buildings).
Forward outlook
- Local home prices are declining (-3.0%/yr); year-one equity from $1k of loan paydown is wiped out by about $4k of value loss. Plan a longer hold.
- Brazoria County population projected at +44% by 2050 — long-run rental-demand tailwind backs the buy-and-hold thesis.
Negotiation context
- It's been on market 78 days — a 6% lower offer ($141k) is reasonable based on typical stale-listing flexibility.
- 3 sale attempts since 3y ago with the ask held roughly flat each time — persistent listings suggest the price (not the market) is what's stuck; bring a comps-based counter.
Risks & watch-outs
- Watch-outs: flood insurance adds $122/mo.
- Climate carrying-cost: in FEMA flood zone AO (mandatory federal flood insurance); severe wind risk, 99% chance of damaging wind over 30y; major wildfire risk; extreme-heat days projected 7→23/yr by 2055 (HVAC capex compounding) — expect insurance premiums to compound above CPI over the hold.
Questions for the listing agent
- It's been on market 78 days. Have you received any prior offers? Is the seller open to a 6% concession, seller financing, or rate buy-down credit?
- What's the actual annual flood-insurance premium (NFIP or private), and is the property in a SFHA with mandatory coverage?
- Why hasn't it sold? Are there any deal-killer items the seller is aware of (foundation, flood, title, zoning, code violations)?
- Is there a deadline driving the sale (1031 exchange, divorce, estate, relocation)? That informs how much negotiation room exists.
- Schools are D-rated, which usually means shorter tenancies and higher turnover. Who's the typical renter profile here, and what's been the actual vacancy rate?
- What's the average days-on-market for RENTAL listings here right now (not sales)? A rising rental-DOM trend means longer vacancies and softer asking-rent achievability than the comps imply.
- What's the recent tenant-quality profile in this submarket — average credit score on applications, eviction rate, late-payment / NSF rate, and stable-employment percentage? A property-management company in the area should have these aggregated.
- How much new for-sale + rental construction is in the pipeline within 1–3 miles? Heavy new supply typically softens prices + rents 12–24 months out; constrained supply supports both.
Investment metrics
- 1% rule
- 1.24% ✓
- Cap rate
- 10.23%
- Cash-on-cash
- 14.07%
- DSCR
- 1.63
- GRM
- 6.7
CMA / ARV
No comps found within radius.
Projected returns pro-forma
-3.0% appreciation · 0.44% rent growth · sell at horizon
- IRR
- -3.5%
- Equity multiple
- 0.87×
- Total profit
- $-5,338
- Equity at exit
- $22,365
- IRR
- 2.9%
- Equity multiple
- 1.18×
- Total profit
- $7,757
- Equity at exit
- $12,969
Cash invested: $42,000 (down + closing). Projections, not guarantees.
Landlord ↔ Tenant lean methodology
- Overall (STATE)
- 87 Strongly Landlord-Friendly
- State Texas
- 87 Strongly Landlord-Friendly · R+5
- County
- — inherits STATE
- City
- — inherits STATE
ZIP-level market 77583
- Rents YoY
- 0.4%
- Active inventory
- 1151
- Price-to-rent
- 6.7×
Monthly cashflow live
- Estimated rent
- $1,862 medium interval (Pro) →
- Mortgage (P&I)
- −$787
- Tax from tax record
- −$129 /mo · $1,549/yr
- Insurance
- −$62
- Flood insurance flood zone
- −$122 /mo · $1,468/yr
- HOA
- −$0
- Lot rent leased land?
- −$0
- Vacancy / Maint / Mgmt
- −$391
- Net cashflow
- $370
Break-even live
Sensitivity live
| Price | -10% $455 | -5% $413 | +0% $370 | +5% $328 | +10% $285 |
|---|---|---|---|---|---|
| Rent | -10% $223 | -5% $297 | +0% $370 | +5% $444 | +10% $517 |
| Rate | -1.0pp $446 | -0.5pp $408 | base $370 | +0.5pp $331 | +1.0pp $292 |
UW: 25.0% down · 7.5% · 30yr · 1.5% tax · 5.0% vac · 8.0% maint · 8.0% mgmt
Financing live
Cash to close
- Down payment
- $37,500
- Closing costs
- $4,500
- Reserves months
- —
- Total cash needed
- —
Loan-product check · same deal, 3 products live
Conventional
25% down · 7.5% · 30yr
- Down + closing
- —
- Monthly P&I
- —
- Monthly cashflow
- —
- DSCR
- —
- Eligible?
- —
Personal DTI + credit; lowest rate.
DSCR
20% down · 8.5% · 30yr
- Down + closing
- —
- Monthly P&I
- —
- Monthly cashflow
- —
- DSCR
- —
- Eligible?
- —
No personal income docs; deal must DSCR.
Hard money
10% down · 12.0% · 12mo
- Down + closing
- —
- Monthly P&I
- —
- Monthly cashflow
- —
- DSCR
- —
- Eligible?
- —
Short-term bridge; refi at stabilization.
Listing history 25 events
-
2026-06-22days on market $150,000 Pending 78 DOM
-
2026-06-21days on market $150,000 Pending 77 DOM
-
2026-06-18days on market $150,000 Pending 74 DOM
-
2026-06-17status $150,000 Pending 73 DOM
-
2026-06-16days on market $150,000 Active 73 DOM
-
2026-06-15days on market $150,000 Active 72 DOM
-
2026-06-13days on market $150,000 Active 70 DOM
-
2026-06-09days on market $150,000 Active 66 DOM
-
2026-06-08days on market $150,000 Active 65 DOM
-
2026-06-07days on market $150,000 Active 64 DOM
-
2026-06-04days on market $150,000 Active 61 DOM
-
2026-06-03days on market $150,000 Active 60 DOM
-
2026-06-02days on market $150,000 Active 59 DOM
-
2026-06-01days on market $150,000 Active 58 DOM
-
2026-05-31days on market $150,000 Active 57 DOM
-
2026-05-28status Active
-
2026-04-05status Pending
-
2026-03-27status Pending
-
2026-03-27historical
-
2026-02-10$150,000 Active
-
2024-02-29historical
-
2023-09-26price $200,000
-
2023-09-13$210,000 Active
-
2014-01-24soldstatus
-
2006-08-31soldstatus
ⓘ Source: listings_history table (triggers on properties + properties_extension) + one-shot
backfill from property_details.listing_events for pre-trigger history.
Tax reassessment forecast TX · Resets to sale price
- Current annual tax
- $1,549 · $129/mo
- Projected year-2 tax
- $2,745 · $229/mo
- Expected delta
- +$1,196/yr (+$100/mo · 77.2%)
ⓘ Screening estimate from a state-policy table — verify with the county assessor before closing.
Climate risk First Street
- Flood 1/10 Low FEMA zone AO · 0% chance over 30 yrs
- Wildfire 6/10 Major
- Heat 9/10 Extreme 7 d/yr ≥110°F today · 23 d/yr by 30 yrs out
- Wind 9/10 Extreme 99% chance of damaging wind over 30 yrs
- Air quality 2/10 Low 1 unhealthy d/yr today · 1 by 30 yrs out
Nearby sold comps map
Loading sold comps map…
Walkable amenities ~0.75 mi
Loading nearby amenities…
Taxation est. · year 1
- Rental income
- $22,340
- − Mortgage interest
- −$8,402
- − Property taxes
- −$1,549
- − Insurance
- −$2,218
- − Repairs & maintenance
- −$1,787
- − Management
- −$1,787
- − Depreciation
- −$4,364
- Taxable income
- $2,233
- Est. tax owed @ 24.0%
- −$536
- After-tax cash flow
- $3,906/yr
For passive investors: Depreciation is non-cash, so a rental often shows a tax loss while cash-flowing — sheltering income. Rental losses are passive: they offset passive income freely, and up to $25,000/yr can offset ordinary (W-2) income if you actively participate and your MAGI is under $100k (phasing out to $0 by $150k); unused losses carry forward. On sale, claimed depreciation is recaptured at up to 25%, and gains may owe capital-gains tax (a 1031 exchange can defer both). Figures are a year-1 estimate at your 24.0% rate — not tax advice; consult a CPA.
Schools (NCES district)
- District
- Angleton ISD
- NCES district ID
- 4808310
- Math proficiency
- 36% ▼ -8.00%
- Reading proficiency
- 44% ▲ 1.00%
- Median HH income
- $55,670
- Composite
- 35.01/100
- National rank
- #5046
- State rank
- #375 of 826 in TX
Livability — Alvin
- Score
- 65/100
- State rank
- #704
- US rank
- #13148
Category grades
Schools grade is shown separately in the Schools card above.
Census & demographics
- County
- Brazoria County · 374,982 people
- City population
- 51,892
- Metro
- Houston-The Woodlands-Sugar Land, TX
- Population (ZIP)
- 52,747
- Household income
- $119,287
- Rent vs Own
- Severe rent burden
- 251.0
Population outlook (Brazoria County) Hauer SSP2
- Today (2025)
- 420,414 people
- By 2030
- 457,585 · +8.8%
- By 2040
- 532,232 · +26.6%
- By 2050
- 605,399 · +44.0%
- By 2075
- 779,358 · +85.4%
- By 2100
- 883,759 · +110.2%
Race, ethnicity, and origin ACS 2023
- Neighborhood character
- Highly diverse neighborhood (Simpson 0.70)
- Race & ethnicity
- Hispanic / Latino 38% Black 34% White 20% Two or more races 18% Asian 5%
- Hispanic origin (detail)
- Mexican 31% Puerto Rican 2%
- Common ancestry
- Lithuanian 1% Slovak 1% Romanian 1%
- Foreign-born
- 16% · Canada, Vietnam, China
- Languages at home
- 64% English-only · Spanish 28% Other Asian/Pacific 2% Vietnamese 1%
Political lean MEDSL · Brazoria
- 2024 margin
- R (+19.7) · D 39.5% · R 59.2% · Other 1.3%
- 2008→2024 swing
- +9.9pp toward D · 2008: -29.6pp · 2024: -19.7pp
- All cycles
- 2024: R+19.7 2020: R+18.2 2016: R+24.6 2012: R+34.2 2008: R+29.6
Not yet ingested
- Civics
- —
Market trends
- HPI YoY
- ▼ -120.19%
- Current HPI
- 198.6559
- Rent YoY
- ▲ 0.44%
- Metro
- Houston-The Woodlands-Sugar Land, TX
- State GDP YoY
- ▲ 3.95%
- F500 in state
- 110
Industry mix (Fortune 500 HQ in TX)
| Industry | F500 HQs | Revenue |
|---|---|---|
| Energy | 16 | $1,198B |
|
||
| Technology | 5 | $198B |
|
||
| Engineering / Construction | 4 | $72B |
|
||
| Energy Services | 3 | $60B |
|
||
| Utilities | 3 | $41B |
|
||
| Healthcare | 2 | $330B |
|
||
Price history
-28.6% since first listed10 events — show timeline
- 2026-05-28 Relisted — HARMLS
- 2026-04-05 Pending — HARMLS
- 2026-03-27 Pending — HARMLS
- 2026-03-27 Listing Removed — HARMLS
- 2026-02-10 Listed $150,000 HARMLS
- 2024-02-29 Listing Removed — HARMLS
- 2023-09-26 Price Changed $200,000 HARMLS
- 2023-09-13 Listed $210,000 HARMLS
- 2014-01-24 Sold (Public Records) — Public Records
- 2006-08-31 Sold (Public Records) — Public Records
Property tax history
+0.3%/yrLatest (2025): $1,549 · +8.8% YoY. Source: county tax records.
Cash-flow waterfall
monthlySold comps — $/sqft
last 12 mo · ≤1 miLoading sold comps…