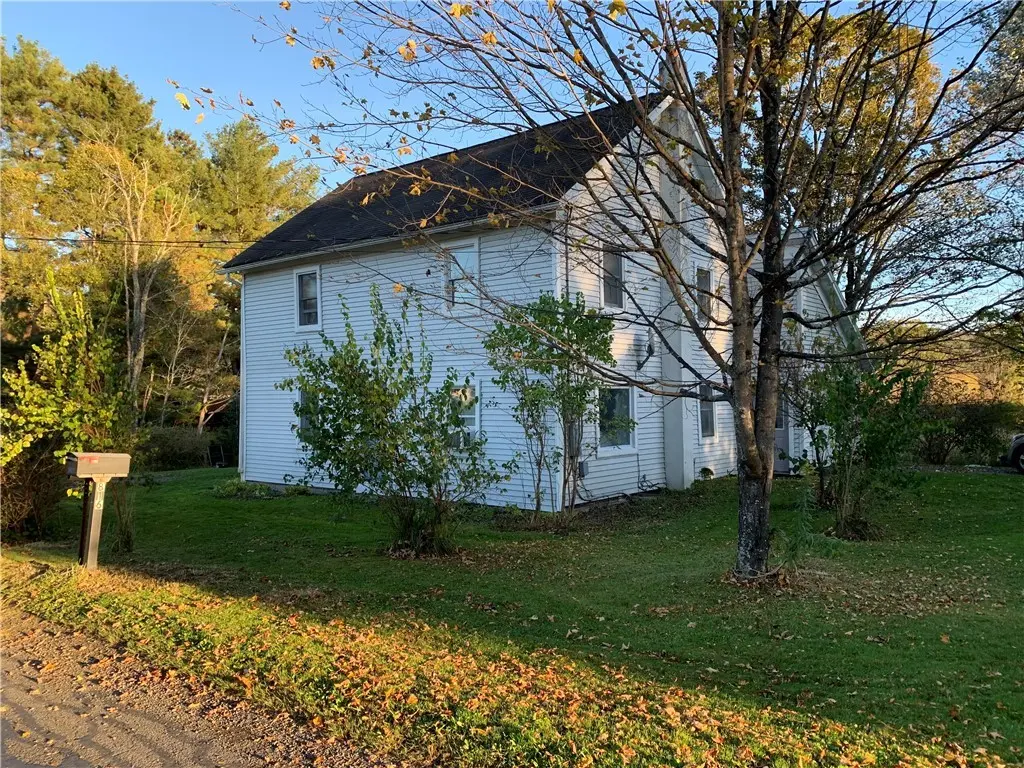
816 County Highway 11 · Laurens, NY
Flood risk 1/10 · Minimal
- FEMA flood zone
- X (unshaded)
- Chance of flooding over 30 yrs
- 0.0%
- Est. flood insurance / yr
- $473 – $860
Fire risk 1/10 · Minimal
- Est. fire insurance / yr
- $691 – $1,283
Heat risk 2/10 · Minimal
- Hot days now (above 91°F)
- 7 days/yr
- Hot days in 30 yrs
- 17 days/yr
Wind risk 2/10 · Minimal
- Chance of severe wind over 30 yrs
- 1.0%
Air-quality risk 1/10 · Minimal
- Unhealthy air days now
- 0 days/yr
- Unhealthy air days in 30 yrs
- 0 days/yr
Risk factors via First Street. Map © Google.
Why this score? — see what drove the C+ grade
The composite is a weighted blend of 9 inputs, each scored 0–100. Each bar is that input's sub-score; the figure is the points it added to the 100-point composite (weight × sub-score).
- Cash flow +19.5/30.0
- Appreciation +10.0/10.0
- ARV discount +7.5/15.0
- DSCR +6.2/10.0
- 1% rule +6.0/10.0
- Schools +4.6/10.0
- Livability +3.0/5.0
- Rent growth +2.5/5.0
- Condition / age +2.5/5.0
$150,000
🖨 Deal sheet 📄 Offer letter ✓ Due diligence
Listing remarks
Located within the vicinity of multiple baseball parks, a 3-bedroom home on half an acre located at the edge of the Village of Laurens. Updates and renovations were done over the years including a 200-amp service and newer furnace. There are two driveways, one on each side of the house. The basement can be entered through Bilko doors on the outside of the home or from inside the home. A spacious attached garage has an automatic garage opener and there is an extra room before entering the home. There is plenty of storage space throughout including a large storage area the length of the house on the second floor. Laundry room and pantry on the first floor. There is also a walk-in closet on th
Key facts
- Two driveways
- Newer furnace
- Attached garage
Tags
Property features AI
Finance
- Other: Resale property; Irregular residential lot about 0.56 acres (dimensions 291 x 159) with city street frontage
Exterior
- Parking: Attached garage; 1 garage space
- Utilities: Electricity connected; Public water connected; Septic tank
- Home design: 2 stories; Existing construction
- Construction: Frame construction with vinyl siding; Shingle roof; Block foundation; Has full dirt-floor basement
- Exterior features: Dirt driveway; Propane tank (leased); See remarks
Interior
- Kitchen: Electric oven and range; Gas oven and range; Microwave; Refrigerator
- Bedrooms: 7 total rooms (includes living, laundry, storage and other spaces)
- Flooring: Carpet; Vinyl; Varied flooring
- Bathrooms: 1 full bathroom; 1 half bathroom; One main-level bathroom
- Heating & cooling: Forced air heating; Oil heating
- Interior features: Ceiling fans; Separate/formal dining room; Separate/formal living room; Pantry; Storage; See remarks
- Laundry & utility: Main-level laundry; Propane water heater
Neighborhood map
What this means for you Summary
Snapshot
- This is a 3-bed/1.5-bath single-family listed at $150k.
Deal economics
- At list price, monthly cash flow is $171 ($2k/yr) — positive.
- The deal already cash-flows at list — no discount required.
- Meets the 1% rule at list price ($2k rent vs $150k).
Location & tenants
- Location reads 60/100 on livability (#1,003 in NY) — a middle-class / working-renter tenant base. Strengths: cost of living A+, housing A+; Watch: health & safety C-, crime F, amenities F.
- Laurens Central School District (rural): math 55% / reading 50% proficiency, ranked #423 of 755 in NY (top 56%) — acceptable for families but not a draw, mixed tenant base, ~2y average lease.
- Market conditions: 118 active listings in the ZIP; 133 units permitted in Otsego County in 2024 (10 in 5+ unit buildings).
- This rent runs 30% of the median local income ($66k/yr) — at the standard rent-burdened threshold; future hikes will face affordability resistance.
Forward outlook
- In year one you build about $16k of equity ($1k loan paydown + $15k appreciation (10.0% local appreciation)).
- Otsego County population projected at -21% by 2050 — secular population decline; favor cash flow + early exit over multi-decade hold.
- At projected returns (10.0% appreciation + 3.0% rent growth), your $42k cash investment doubles in ~3 years — after that, you're playing with house money.
- By year 3, paydown + projected appreciation supports a ~$41k cash-out refi (75% LTV) — recoverable capital for the next deal without selling this one.
Negotiation context
- Only 9 days on market — expect competitive offers; lowballing is unlikely to land.
- Current owner paid $91k; list at $150k implies a 65% gain — meaningful room to come down on a strong offer.
Risks & watch-outs
- Watch-outs: built in 1780 — expect roof / HVAC / electrical / plumbing capex.
Questions for the listing agent
- Built in 1780 — when were the roof, HVAC, electrical panel, plumbing, and water heater last replaced?
- Is there a deadline driving the sale (1031 exchange, divorce, estate, relocation)? That informs how much negotiation room exists.
- Crime grade is F in this area — have there been break-ins, vandalism, or insurance claims at this property in the last 3 years? What carrier currently insures it and at what premium?
- What's the average days-on-market for RENTAL listings here right now (not sales)? A rising rental-DOM trend means longer vacancies and softer asking-rent achievability than the comps imply.
- What's the recent tenant-quality profile in this submarket — average credit score on applications, eviction rate, late-payment / NSF rate, and stable-employment percentage? A property-management company in the area should have these aggregated.
- How much new for-sale + rental construction is in the pipeline within 1–3 miles? Heavy new supply typically softens prices + rents 12–24 months out; constrained supply supports both.
Investment metrics
- 1% rule
- 1.10% ✓
- Cap rate
- 7.66%
- Cash-on-cash
- 4.88%
- DSCR
- 1.22
- GRM
- 7.5
CMA / ARV
- ARV (on-the-fly)
- $305,280
- Comps found
- 2
Show comp detail 2 sales within ~0.75 mi
| Address | Dist | Beds/Ba | Sqft | Sold | Price | $/sf | Match |
|---|---|---|---|---|---|---|---|
| 705 County Highway 11 | 0.51mi | 3/2.0 | 1,344 (-7%) | 4mo | $285,000 | $212 | 59 |
| 1561 State Highway 205 | 0.72mi | 3/2.0 | 1,432 (-1%) | 12mo | $245,000 | $171 | 54 |
Match score weights: distance 35% · size 25% · config 20% · recency 20%. Top-matched comps best support the ARV.
Projected returns pro-forma
10.0% appreciation · 3.0% rent growth · sell at horizon
- IRR
- 27.8%
- Equity multiple
- 3.21×
- Total profit
- $92,652
- Equity at exit
- $135,132
- IRR
- 24.3%
- Equity multiple
- 7.30×
- Total profit
- $264,470
- Equity at exit
- $291,417
Cash invested: $42,000 (down + closing). Projections, not guarantees.
Landlord ↔ Tenant lean methodology
- Overall (STATE)
- 15 Strongly Tenant-Friendly
- State New York
- 15 Strongly Tenant-Friendly · D+10
- County
- — inherits STATE
- City
- — inherits STATE
ZIP-level market 13820
- Home prices YoY
- 22.7%
- Active inventory
- 118
- Price-to-rent
- 7.5×
Monthly cashflow live
- Estimated rent
- $1,657 medium interval (Pro) →
- Mortgage (P&I)
- −$787
- Tax from tax record
- −$289 /mo · $3,469/yr
- Insurance
- −$62
- HOA
- −$0
- Vacancy / Maint / Mgmt
- −$348
- Net cashflow
- $171
Break-even live
UW: 25.0% down · 7.5% · 30yr · 1.5% tax · 5.0% vac · 8.0% maint · 8.0% mgmt
Financing live
Cash to close
- Down payment
- $37,500
- Closing costs
- $4,500
- Reserves months
- —
- Total cash needed
- —
Loan-product check · same deal, 3 products live
Conventional
25% down · 7.5% · 30yr
- Down + closing
- —
- Monthly P&I
- —
- Monthly cashflow
- —
- DSCR
- —
- Eligible?
- —
Personal DTI + credit; lowest rate.
DSCR
20% down · 8.5% · 30yr
- Down + closing
- —
- Monthly P&I
- —
- Monthly cashflow
- —
- DSCR
- —
- Eligible?
- —
No personal income docs; deal must DSCR.
Hard money
10% down · 12.0% · 12mo
- Down + closing
- —
- Monthly P&I
- —
- Monthly cashflow
- —
- DSCR
- —
- Eligible?
- —
Short-term bridge; refi at stabilization.
Listing history 8 events
-
2026-06-19days on market $150,000 Active 9 DOM
-
2026-06-18days on market $150,000 Active 8 DOM
-
2026-06-17days on market $150,000 Active 7 DOM
-
2026-06-16days on market $150,000 Active 6 DOM
-
2026-06-15days on market $150,000 Active 5 DOM
-
2026-06-14days on market $150,000 Active 3 DOM
-
2026-06-12remarks 699-char remark
-
2026-06-12$150,000 Active 2 DOM
ⓘ Source: listings_history table (triggers on properties + properties_extension) + one-shot
backfill from property_details.listing_events for pre-trigger history.
Tax reassessment forecast NY · Partial reset (capped growth)
- Current annual tax
- $3,469 · $289/mo
- Projected year-2 tax
- $3,469 · $289/mo
- Expected delta
- $0/yr ($0/mo · 0.0%)
ⓘ Screening estimate from a state-policy table — verify with the county assessor before closing.
Climate risk First Street
- Flood 1/10 Low FEMA zone X (unshaded) · 0% chance over 30 yrs
- Wildfire 1/10 Low
- Heat 2/10 Low 7 d/yr ≥91°F today · 17 d/yr by 30 yrs out
- Wind 2/10 Low 100% chance of damaging wind over 30 yrs
- Air quality 1/10 Low 0 unhealthy d/yr today · 0 by 30 yrs out
Nearby sold comps map
Loading sold comps map…
Walkable amenities ~0.75 mi
Loading nearby amenities…
Taxation est. · year 1
- Rental income
- $19,882
- − Mortgage interest
- −$8,402
- − Property taxes
- −$3,469
- − Insurance
- −$750
- − Repairs & maintenance
- −$1,591
- − Management
- −$1,591
- − Depreciation
- −$4,364
- Taxable loss
- −$284
- Est. tax savings @ 24.0%
- +$68
- After-tax cash flow
- $2,116/yr
For passive investors: Depreciation is non-cash, so a rental often shows a tax loss while cash-flowing — sheltering income. Rental losses are passive: they offset passive income freely, and up to $25,000/yr can offset ordinary (W-2) income if you actively participate and your MAGI is under $100k (phasing out to $0 by $150k); unused losses carry forward. On sale, claimed depreciation is recaptured at up to 25%, and gains may owe capital-gains tax (a 1031 exchange can defer both). Figures are a year-1 estimate at your 24.0% rate — not tax advice; consult a CPA.
Schools (NCES district)
- District
- Laurens Central School District
- NCES district ID
- 3616800
- Math proficiency
- 55% ▲ 5.00%
- Reading proficiency
- 50% ▬ 0.00%
- Median HH income
- $46,144
- Composite
- 46.42/100
- National rank
- #5346
- State rank
- #423 of 755 in NY
Livability — Laurens
- Score
- 60/100
- State rank
- #1003
- US rank
- #19540
Category grades
Schools grade is shown separately in the Schools card above.
Census & demographics
- County
- Otsego County · 23,056 people
- Metro
- Oneonta, NY
- Population (ZIP)
- 23,056
- Household income
- $65,953
- Rent vs Own
- Severe rent burden
- 662.0
Population outlook (Otsego County) Hauer SSP2
- Today (2025)
- 57,987 people
- By 2030
- 55,403 · -4.5%
- By 2040
- 50,336 · -13.2%
- By 2050
- 45,715 · -21.2%
- By 2075
- 38,769 · -33.1%
- By 2100
- 33,468 · -42.3%
Race, ethnicity, and origin ACS 2023
- Neighborhood character
- Predominantly White (84%)
- Race & ethnicity
- White 84% Hispanic / Latino 6% Black 5% Two or more races 5% Asian 2%
- Hispanic origin (detail)
- Puerto Rican 2%
- Common ancestry
- Romanian 4% Slovak 2% Lithuanian 2%
- Foreign-born
- 5% · Canada, China
- Languages at home
- 94% English-only · Spanish 3% Russian/Polish/Slavic 1% Other Indo-European 1%
Political lean MEDSL · Otsego
- 2024 margin
- Lean R (+7.9) · D 46.1% · R 53.9%
- 2008→2024 swing
- -13.8pp toward R · 2008: 5.9pp · 2024: -7.9pp
- All cycles
- 2024: R+7.9 2020: R+5.0 2016: R+13.0 2012: D+2.0 2008: D+5.9
Not yet ingested
- Civics
- —
Market trends
- HPI YoY
- ▲ 67.86%
- Current HPI
- 366.3391
- Rent YoY
- —
- Metro
- Oneonta, NY
- State GDP YoY
- ▲ 2.60%
- F500 in state
- 92
Industry mix (Fortune 500 HQ in NY)
| Industry | F500 HQs | Revenue |
|---|---|---|
| Financial Services | 10 | $950B |
|
||
| Consumer Goods | 9 | $162B |
|
||
| Insurance | 4 | $225B |
|
||
| Telecommunications | 2 | $144B |
|
||
| Pharmaceuticals | 2 | $112B |
|
||
| Media / Entertainment | 2 | $69B |
|
||
Price history
+64.8% since first listed2 events — show timeline
- 2026-06-10 Listed $150,000 UNYREIS
- 2007-05-04 Sold (Public Records) $91,000 Public Records
Property tax history
+5.4%/yrLatest (2025): $3,469 · +18.2% YoY. Source: county tax records.
Cash-flow waterfall
monthlySold comps — $/sqft
last 12 mo · ≤1 miLoading sold comps…