21 Oak Way · Pittsfield, MA
Flood risk 4/10 · Minor
- FEMA flood zone
- X
- Chance of flooding over 30 yrs
- 0.22%
- Est. flood insurance / yr
- $507 – $1,088
Fire risk 3/10 · Minor
- Est. fire insurance / yr
- $691 – $1,283
Heat risk 2/10 · Minimal
- Hot days now (above 91°F)
- 7 days/yr
- Hot days in 30 yrs
- 17 days/yr
Wind risk 4/10 · Minor
- Chance of severe wind over 30 yrs
- 9.0%
Air-quality risk 2/10 · Minimal
- Unhealthy air days now
- 1 days/yr
- Unhealthy air days in 30 yrs
- 1 days/yr
Risk factors via First Street. Map © Google.
Why this score? — see what drove the C+ grade
The composite is a weighted blend of 9 inputs, each scored 0–100. Each bar is that input's sub-score; the figure is the points it added to the 100-point composite (weight × sub-score).
- Cash flow +19.6/30.0
- Appreciation +9.5/10.0
- ARV discount +7.4/15.0
- DSCR +6.2/10.0
- 1% rule +5.2/10.0
- Schools +4.2/10.0
- Livability +3.8/5.0
- Rent growth +2.5/5.0
- Condition / age +2.5/5.0
$119,900
🖨 Deal sheet 📄 Offer letter ✓ Due diligence
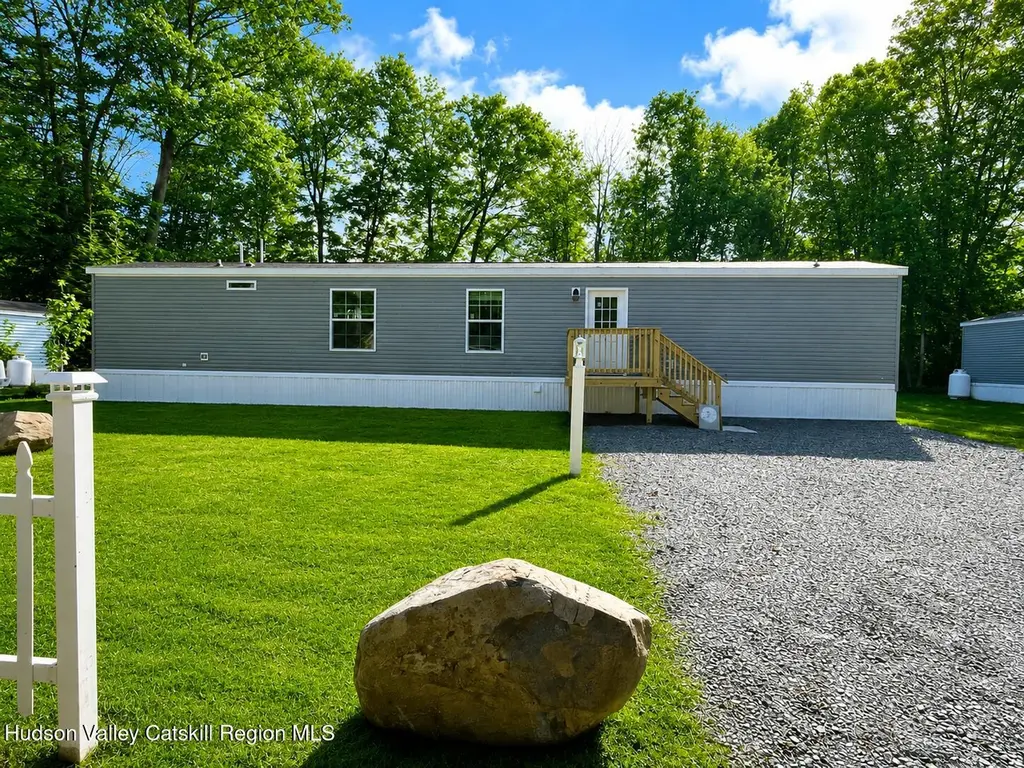
Listing remarks MLS
More options available, contact Jolene for details. Move in Ready! Heated and Ready to go! Brand New Single Wide Mobile home located in ''The Village'' Mobile home park that is well managed and maintained! Sits on a large rented lot that backs to trees. Great location located on a dead end street. Beautifully landscaped. White picket fence. Beautiful kitchen with SS appliances opens to living room. Primary bedroom with it's own bath with walk-in shower. Good sized 2nd bedroom. Lot rent is 495.00/month. Walking Trails nearby. Close to the Berkshires for skiing. 30 minutes to Albany, 40 minutes to Hudson. Cash or Special Mobile home financing required
Key facts
- Backs to trees
- Dead end street
- Shed with power
Tags
Property features AI
Exterior
- Parking: Driveway
- Utilities: Private well water; Septic tank
- Home design: Manufactured home (single wide); One story
- Construction: Asphalt shingle roof; No foundation specified
- Exterior features: Deck; Shed(s); Cleared and landscaped lot
Interior
- Kitchen: Dishwasher; Electric oven; Microwave; Refrigerator
- Bedrooms: Master bedroom located downstairs
- Flooring: Carpet
- Bathrooms: 2 full bathrooms
- Heating & cooling: Propane heating; No central cooling
- Interior features: Master bedroom on the main level; Dishwasher, Electric oven, Microwave, Refrigerator
- Laundry & utility: In-unit laundry room
Neighborhood map
What this means for you Summary
Snapshot
- This is a 2-bed/2.0-bath single-family listed at $120k.
Deal economics
- At list price, monthly cash flow is $139 ($2k/yr) — positive.
- The deal already cash-flows at list — no discount required.
- Meets the 1% rule at list price ($1k rent vs $120k).
- Cap rate 7.7% vs local median 3.6% in Pittsfield — top-decile yield for the area; either an underpriced asset or a hidden risk that comps aren't pricing in. Stress-test before assuming the spread holds.
Location & tenants
- Location reads 75/100 on livability (#70 in MA, #3,820 nationally) — a middle-class / working-renter tenant base. Strengths: commute A+, housing A+, health & safety A+; Watch: employment C-, amenities D+, schools D.
- Berlin Central School District (rural): math 45% / reading 50% proficiency, ranked #412 of 590 in NY (top 70%) — families likely to look elsewhere, expect single-tenant / working-renter base with shorter leases.
- Market conditions: 1 comparable units currently listed for rent nearby; 405 units permitted in Rensselaer County in 2024 (224 in 5+ unit buildings).
Forward outlook
- In year one you build about $12k of equity ($829 loan paydown + $11k appreciation (8.9% local appreciation)).
- Rensselaer County population projected to shrink 6% by 2050 — rents likely to lag national; underwrite the cash flow, not the appreciation.
- At projected returns (8.9% appreciation + 3.0% rent growth), your $34k cash investment doubles in ~3 years — after that, you're playing with house money.
- By year 4, paydown + projected appreciation supports a ~$40k cash-out refi (75% LTV) — recoverable capital for the next deal without selling this one.
Negotiation context
- Only 6 days on market — expect competitive offers; lowballing is unlikely to land.
- 2 sale attempts with the ask held roughly flat each time — persistent listings suggest the price (not the market) is what's stuck; bring a comps-based counter.
Questions for the listing agent
- Is there a deadline driving the sale (1031 exchange, divorce, estate, relocation)? That informs how much negotiation room exists.
- Schools are D-rated, which usually means shorter tenancies and higher turnover. Who's the typical renter profile here, and what's been the actual vacancy rate?
- Crime grade is D in this area — have there been break-ins, vandalism, or insurance claims at this property in the last 3 years? What carrier currently insures it and at what premium?
- What's the average days-on-market for RENTAL listings here right now (not sales)? A rising rental-DOM trend means longer vacancies and softer asking-rent achievability than the comps imply.
- What's the recent tenant-quality profile in this submarket — average credit score on applications, eviction rate, late-payment / NSF rate, and stable-employment percentage? A property-management company in the area should have these aggregated.
- How much new for-sale + rental construction is in the pipeline within 1–3 miles? Heavy new supply typically softens prices + rents 12–24 months out; constrained supply supports both.
Investment metrics
- 1% rule
- 1.02% ✓
- Cap rate
- 7.69%
- Cash-on-cash
- 4.97%
- DSCR
- 1.22
- GRM
- 8.2
CMA / ARV
- ARV (on-the-fly)
- $119,700
- Comps found
- 2
Show comp detail 2 sales within ~0.75 mi
| Address | Dist | Beds/Ba | Sqft | Sold | Price | $/sf | Match |
|---|---|---|---|---|---|---|---|
| 21 Oak Way | 0.00mi | 2/2.0 | 900 (0%) | 3mo | $119,900 | $133 | 98 |
| 25 Oak Way | 0.02mi | 1/2.0 (-1) | 880 (-2%) | 11mo | $105,000 | $119 | 81 |
Match score weights: distance 35% · size 25% · config 20% · recency 20%. Top-matched comps best support the ARV.
Projected returns pro-forma
8.93% appreciation · 3.0% rent growth · sell at horizon
- IRR
- 25.7%
- Equity multiple
- 2.95×
- Total profit
- $65,535
- Equity at exit
- $98,817
- IRR
- 22.9%
- Equity multiple
- 6.49×
- Total profit
- $184,334
- Equity at exit
- $204,018
Cash invested: $33,572 (down + closing). Projections, not guarantees.
Landlord ↔ Tenant lean methodology
- Overall (STATE)
- 20 Strongly Tenant-Friendly
- State Massachusetts
- 20 Strongly Tenant-Friendly · D+15
- County
- — inherits STATE
- City
- — inherits STATE
ZIP-level market 12169
- Home prices YoY
- 3.2%
- Price-to-rent
- 8.2×
Monthly cashflow live
- Estimated rent
- $1,225 medium interval (Pro) →
- Mortgage (P&I)
- −$629
- Tax est. 1.5%
- −$150 /mo · $1,798/yr
- Insurance
- −$50
- HOA
- −$0
- Vacancy / Maint / Mgmt
- −$257
- Net cashflow
- $139
Break-even live
UW: 25.0% down · 7.5% · 30yr · 1.5% tax · 5.0% vac · 8.0% maint · 8.0% mgmt
Financing live
Cash to close
- Down payment
- $29,975
- Closing costs
- $3,597
- Reserves months
- —
- Total cash needed
- —
Loan-product check · same deal, 3 products live
Conventional
25% down · 7.5% · 30yr
- Down + closing
- —
- Monthly P&I
- —
- Monthly cashflow
- —
- DSCR
- —
- Eligible?
- —
Personal DTI + credit; lowest rate.
DSCR
20% down · 8.5% · 30yr
- Down + closing
- —
- Monthly P&I
- —
- Monthly cashflow
- —
- DSCR
- —
- Eligible?
- —
No personal income docs; deal must DSCR.
Hard money
10% down · 12.0% · 12mo
- Down + closing
- —
- Monthly P&I
- —
- Monthly cashflow
- —
- DSCR
- —
- Eligible?
- —
Short-term bridge; refi at stabilization.
Rent comps 1 comps
| Address | Beds | Baths | Sqft | Rent | $/sqft | DOM | Units | Dist |
|---|---|---|---|---|---|---|---|---|
| 372 New York 43 Stephentown, NY | 1.0 | 1.0 | 800 | $1,225 | $1.53 | 14d | 1 | 0.97mi |
Listing history 6 events
-
2026-06-18days on market $119,900 Active 6 DOM
-
2026-06-17days on market $119,900 Active 5 DOM
-
2026-06-16days on market $119,900 Active 4 DOM
-
2026-06-15days on market $119,900 Active 3 DOM
-
2026-06-14remarks 692-char remark
-
2026-06-14$119,900 Active 1 DOM
ⓘ Source: listings_history table (triggers on properties + properties_extension) + one-shot
backfill from property_details.listing_events for pre-trigger history.
Climate risk First Street
- Flood 4/10 Moderate FEMA zone X · 22% chance over 30 yrs
- Wildfire 3/10 Moderate
- Heat 2/10 Low 7 d/yr ≥91°F today · 17 d/yr by 30 yrs out
- Wind 4/10 Moderate 9% chance of damaging wind over 30 yrs
- Air quality 2/10 Low 1 unhealthy d/yr today · 1 by 30 yrs out
Nearby sold comps map
Loading sold comps map…
Walkable amenities ~0.75 mi
Loading nearby amenities…
Taxation est. · year 1
- Rental income
- $14,700
- − Mortgage interest
- −$6,716
- − Property taxes
- −$1,798
- − Insurance
- −$600
- − Repairs & maintenance
- −$1,176
- − Management
- −$1,176
- − Depreciation
- −$3,488
- Taxable loss
- −$254
- Est. tax savings @ 24.0%
- +$61
- After-tax cash flow
- $1,731/yr
For passive investors: Depreciation is non-cash, so a rental often shows a tax loss while cash-flowing — sheltering income. Rental losses are passive: they offset passive income freely, and up to $25,000/yr can offset ordinary (W-2) income if you actively participate and your MAGI is under $100k (phasing out to $0 by $150k); unused losses carry forward. On sale, claimed depreciation is recaptured at up to 25%, and gains may owe capital-gains tax (a 1031 exchange can defer both). Figures are a year-1 estimate at your 24.0% rate — not tax advice; consult a CPA.
Schools (NCES district)
- District
- Berlin Central School District
- NCES district ID
- 3604620
- Math proficiency
- 45% ▼ -3.00%
- Reading proficiency
- 50% ▲ 2.00%
- Median HH income
- $58,335
- Composite
- 41.5/100
- National rank
- #3455
- State rank
- #412 of 590 in NY
Livability — Pittsfield
- Score
- 75/100
- State rank
- #70
- US rank
- #3820
Category grades
Schools grade is shown separately in the Schools card above.
Census & demographics
- City population
- 44,848
- Population (ZIP)
- 407
Population outlook (Rensselaer County) Hauer SSP2
- Today (2025)
- 162,400 people
- By 2030
- 161,746 · -0.4%
- By 2040
- 158,095 · -2.7%
- By 2050
- 152,966 · -5.8%
- By 2075
- 140,767 · -13.3%
- By 2100
- 124,727 · -23.2%
Race, ethnicity, and origin ACS 2023
- Neighborhood character
- Predominantly White (81%)
- Race & ethnicity
- White 81% Hispanic / Latino 17% Two or more races 2%
- Hispanic origin (detail)
- Puerto Rican 17%
- Common ancestry
- Iranian 38% Lithuanian 14% Danish 8%
- Foreign-born
- 1%
- Languages at home
- 99% English-only · German/W. Germanic 1%
Political lean MEDSL · Rensselaer
- 2024 margin
- Toss-up / Even · D 50.7% · R 49.3%
- 2008→2024 swing
- -8.0pp toward R · 2008: 9.3pp · 2024: 1.4pp
- All cycles
- 2024: D+1.4 2020: D+5.6 2016: R+2.9 2012: D+11.8 2008: D+9.3
Not yet ingested
- Civics
- —
Market trends
- HPI YoY
- ▲ 8.93%
- Current HPI
- 290.2192
- Rent YoY
- —
- Metro
- —
- State GDP YoY
- ▲ 2.28%
- F500 in state
- 38
Industry mix (Fortune 500 HQ in MA)
| Industry | F500 HQs | Revenue |
|---|---|---|
| Technology | 3 | $17B |
|
||
| Insurance | 2 | $84B |
|
||
| Retail | 2 | $76B |
|
||
| Life Sciences | 1 | $43B |
|
||
| Energy Technology | 1 | $31B |
|
||
| Aerospace / Defense | 1 | $18B |
|
||
Price history
+0.0% since first listed4 events — show timeline
- 2026-06-11 Listed $119,900 HVCRMLS
- 2026-03-27 Sold (MLS) $119,900 HVCRMLS
- 2025-12-30 Pending — HVCRMLS
- 2025-09-02 Listed $119,900 HVCRMLS
Cash-flow waterfall
monthlySold comps — $/sqft
last 12 mo · ≤1 miLoading sold comps…