6353 Fm 1390 · Scurry, TX
Flood risk 1/10 · Minimal
- FEMA flood zone
- X (unshaded)
- Chance of flooding over 30 yrs
- 0.0%
- Est. flood insurance / yr
- $507 – $1,088
Fire risk 5/10 · Moderate
- Est. fire insurance / yr
- $1,222 – $2,270
Heat risk 7/10 · Major
- Hot days now (above 109°F)
- 7 days/yr
- Hot days in 30 yrs
- 24 days/yr
Wind risk 6/10 · Moderate
- Chance of severe wind over 30 yrs
- 27.0%
Air-quality risk 2/10 · Minimal
- Unhealthy air days now
- 0 days/yr
- Unhealthy air days in 30 yrs
- 1 days/yr
Risk factors via First Street. Map © Google.
Why this score? — see what drove the C grade
The composite is a weighted blend of 9 inputs, each scored 0–100. Each bar is that input's sub-score; the figure is the points it added to the 100-point composite (weight × sub-score).
- Cash flow +28.2/30.0
- DSCR +10.0/10.0
- 1% rule +6.7/10.0
- Schools +4.3/10.0
- Livability +3.3/5.0
- Rent growth +2.5/5.0
- Condition / age +2.5/5.0
- ARV discount +0.0/15.0
- Appreciation +0.0/10.0
$155,000
🖨 Deal sheet (PDF) 📄 Offer letter ✓ Due diligence
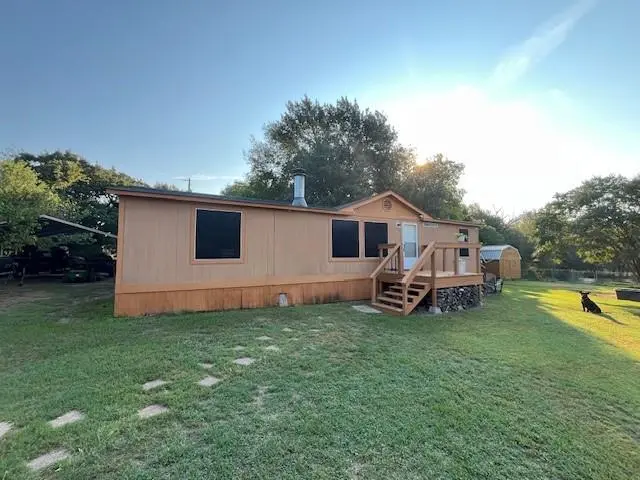
Listing remarks
Country Living Feel and great location for commuting into the Metroplex. Located approx. 3.5 miles from Hwy 175. 3 bedroom 2 bath home with woodburning fireplace. Large backyard with separate fenced area for your animals. Storage building in the backyard for lawn equipment, tools and hobby materials!
Key facts
- Separate fenced area
- Large backyard
- Storage building
Tags
Property features AI
Finance
- Other: Property is on multiple parcels; No known restrictions; Possession: Negotiable; Listing terms: Cash or Conventional
- HOA & community: No association
Exterior
- Parking: Carport (covered) with 1 covered space and 1 carport space
- Utilities: Co-op water; Outside city limits; Municipal utility district: No
- Home design: Manufactured home; Residential property; Single-story
- Construction: Built in 1995
- Exterior features: Chain link fence; Shed(s); Few trees; Interior lot; Level lot; Large backyard with grass
Interior
- Kitchen: Gas range; Gas water heater
- Bedrooms: 3 bedrooms; Primary bedroom on main level with fireplace
- Flooring: Luxury vinyl plank flooring
- Bathrooms: 2 full bathrooms
- Heating & cooling: Central heating; Central air conditioning
- Interior features: High-speed internet available; Paneling; Walk-in closet(s); One living area; One dining area; Two total rooms (listed); Wood-burning fireplace
- Laundry & utility: Gas water heater
Neighborhood map
What this means for you Summary
Snapshot
- This is a 3-bed/2.0-bath manufactured listed at $155k.
Deal economics
- At list price, monthly cash flow is $491 ($6k/yr) — positive.
- The deal already cash-flows at list — no discount required.
- Meets the 1% rule at list price ($2k rent vs $155k).
- Recommended offer: $150k (3.0% below list) — sets the bar for market timing.
Location & tenants
- Location reads 66/100 on livability (#616 in TX) — a middle-class / working-renter tenant base. Strengths: employment A+, cost of living A+, housing A+; Watch: amenities F, commute F, health & safety F.
- Scurry-Rosser ISD (rural): math 51% / reading 49% proficiency, ranked #172 of 826 in TX (top 21%) — acceptable for families but not a draw, mixed tenant base, ~2y average lease.
- Zoned schools: Scurry-Rosser El (math 52% / reading 52%, grade C-, #742 of 4,322 statewide, top 19%, 293 students, 65% FRL); Scurry-Rosser Middle (math 52% / reading 46%, grade C-, #378 of 1,662 statewide, top 23%, 407 students, 50% FRL); Scurry-Rosser H S (math 42% / reading 62%, grade D+, #447 of 1,632 statewide, top 29%, 366 students, 39% FRL).
- Market conditions: 278 active listings in the ZIP; 1,747 units permitted in Kaufman County in 2024 (180 in 5+ unit buildings).
Forward outlook
- Local home prices are declining (-3.0%/yr); year-one equity from $1k of loan paydown is wiped out by about $5k of value loss. Plan a longer hold.
- Kaufman County population projected at +43% by 2050 — long-run rental-demand tailwind backs the buy-and-hold thesis.
- At projected returns (-3.0% appreciation + 3.0% rent growth), your $43k cash investment doubles in ~9 years — after that, you're playing with house money.
Negotiation context
- It's been on market 46 days — a 3% lower offer ($150k) is reasonable based on typical stale-listing flexibility.
- 2 sale attempts with the ask held roughly flat each time — persistent listings suggest the price (not the market) is what's stuck; bring a comps-based counter.
Risks & watch-outs
- Climate carrying-cost: major wind risk, 27% chance of damaging wind over 30y; moderate wildfire risk; extreme-heat days projected 7→24/yr by 2055 (HVAC capex compounding) — expect insurance premiums to compound above CPI over the hold.
Questions for the listing agent
- It's been on market 46 days. Have you received any prior offers? Is the seller open to a 3% concession, seller financing, or rate buy-down credit?
- Is there a deadline driving the sale (1031 exchange, divorce, estate, relocation)? That informs how much negotiation room exists.
- Schools are D-rated, which usually means shorter tenancies and higher turnover. Who's the typical renter profile here, and what's been the actual vacancy rate?
- What's the average days-on-market for RENTAL listings here right now (not sales)? A rising rental-DOM trend means longer vacancies and softer asking-rent achievability than the comps imply.
- What's the recent tenant-quality profile in this submarket — average credit score on applications, eviction rate, late-payment / NSF rate, and stable-employment percentage? A property-management company in the area should have these aggregated.
- How much new for-sale + rental construction is in the pipeline within 1–3 miles? Heavy new supply typically softens prices + rents 12–24 months out; constrained supply supports both.
Investment metrics
- 1% rule
- 1.17% ✓
- Cap rate
- 10.09%
- Cash-on-cash
- 13.57%
- DSCR
- 1.60
- GRM
- 7.1
CMA / ARV
- ARV (median comp)
- $130,000
- List price
- $155,000
- Delta
- 19.23%
- Verdict
- OVERPRICED
- Comps
- 1 within 2.0 mi
Projected returns pro-forma
-3.0% appreciation · 3.0% rent growth · sell at horizon
- IRR
- 3.6%
- Equity multiple
- 1.14×
- Total profit
- $6,080
- Equity at exit
- $23,111
- IRR
- 13.1%
- Equity multiple
- 2.04×
- Total profit
- $45,324
- Equity at exit
- $13,402
Cash invested: $43,400 (down + closing). Projections, not guarantees.
Landlord ↔ Tenant lean methodology
- Overall (STATE)
- 87 Strongly Landlord-Friendly
- State Texas
- 87 Strongly Landlord-Friendly · R+5
- County
- — inherits STATE
- City
- — inherits STATE
ZIP-level market 75142
- Home prices YoY
- -19.8%
- Active inventory
- 278
- Price-to-rent
- 7.1×
Monthly cashflow live
- Estimated rent
- $1,817 medium interval (Pro) →
- Mortgage (P&I)
- −$813
- Tax from tax record
- −$67 /mo · $806/yr
- Insurance
- −$65
- HOA
- −$0
- Vacancy / Maint / Mgmt
- −$382
- Net cashflow
- $491
Break-even live
Sensitivity live
| Price | -10% $578 | -5% $534 | +0% $491 | +5% $447 | +10% $403 |
|---|---|---|---|---|---|
| Rent | -10% $347 | -5% $419 | +0% $491 | +5% $562 | +10% $634 |
| Rate | -1.0pp $569 | -0.5pp $530 | base $491 | +0.5pp $450 | +1.0pp $410 |
UW: 25.0% down · 7.5% · 30yr · 1.5% tax · 5.0% vac · 8.0% maint · 8.0% mgmt
Financing live
Cash to close
- Down payment
- $38,750
- Closing costs
- $4,650
- Reserves months
- —
- Total cash needed
- —
Loan-product check · same deal, 3 products live
Conventional
25% down · 7.5% · 30yr
- Down + closing
- —
- Monthly P&I
- —
- Monthly cashflow
- —
- DSCR
- —
- Eligible?
- —
Personal DTI + credit; lowest rate.
DSCR
20% down · 8.5% · 30yr
- Down + closing
- —
- Monthly P&I
- —
- Monthly cashflow
- —
- DSCR
- —
- Eligible?
- —
No personal income docs; deal must DSCR.
Hard money
10% down · 12.0% · 12mo
- Down + closing
- —
- Monthly P&I
- —
- Monthly cashflow
- —
- DSCR
- —
- Eligible?
- —
Short-term bridge; refi at stabilization.
Listing history 21 events
-
2026-06-21days on market $155,000 Active 46 DOM
-
2026-06-18days on market $155,000 Active 43 DOM
-
2026-06-17days on market $155,000 Active 42 DOM
-
2026-06-16days on market $155,000 Active 41 DOM
-
2026-06-15days on market $155,000 Active 40 DOM
-
2026-06-13days on market $155,000 Active 38 DOM
-
2026-06-13days on market $155,000 Active 37 DOM
-
2026-06-09days on market $155,000 Active 34 DOM
-
2026-06-08days on market $155,000 Active 33 DOM
-
2026-06-07days on market $155,000 Active 32 DOM
-
2026-06-04days on market $155,000 Active 29 DOM
-
2026-06-03days on market $155,000 Active 28 DOM
-
2026-06-02days on market $155,000 Active 27 DOM
-
2026-06-01days on market $155,000 Active 26 DOM
-
2026-05-31days on market $155,000 Active 25 DOM
-
2026-05-06$155,000 Active 304-char remark
-
2026-04-30historical
-
2026-03-30price $159,900
-
2026-03-12price $165,000
-
2025-11-12price $169,900
-
2025-09-12$174,000 Active
ⓘ Source: listings_history table (triggers on properties + properties_extension) + one-shot
backfill from property_details.listing_events for pre-trigger history.
Tax reassessment forecast TX · Resets to sale price
- Current annual tax
- $806 · $67/mo
- Projected year-2 tax
- $2,836 · $236/mo
- Expected delta
- +$2,030/yr (+$169/mo · 251.8%)
ⓘ Screening estimate from a state-policy table — verify with the county assessor before closing.
Climate risk First Street
- Flood 1/10 Low FEMA zone X (unshaded) · 0% chance over 30 yrs
- Wildfire 5/10 Major
- Heat 7/10 Severe 7 d/yr ≥109°F today · 24 d/yr by 30 yrs out
- Wind 6/10 Major 27% chance of damaging wind over 30 yrs
- Air quality 2/10 Low 0 unhealthy d/yr today · 1 by 30 yrs out
Nearby sold comps map
Loading sold comps map…
Walkable amenities ~0.75 mi
Loading nearby amenities…
Taxation est. · year 1
- Rental income
- $21,801
- − Mortgage interest
- −$8,682
- − Property taxes
- −$806
- − Insurance
- −$775
- − Repairs & maintenance
- −$1,744
- − Management
- −$1,744
- − Depreciation
- −$4,509
- Taxable income
- $3,540
- Est. tax owed @ 24.0%
- −$850
- After-tax cash flow
- $5,038/yr
For passive investors: Depreciation is non-cash, so a rental often shows a tax loss while cash-flowing — sheltering income. Rental losses are passive: they offset passive income freely, and up to $25,000/yr can offset ordinary (W-2) income if you actively participate and your MAGI is under $100k (phasing out to $0 by $150k); unused losses carry forward. On sale, claimed depreciation is recaptured at up to 25%, and gains may owe capital-gains tax (a 1031 exchange can defer both). Figures are a year-1 estimate at your 24.0% rate — not tax advice; consult a CPA.
Schools (NCES district)
- District
- Scurry-Rosser ISD
- NCES district ID
- 4839570
- Math proficiency
- 51% ▼ -1.00%
- Reading proficiency
- 49% ▬ 0.00%
- Median HH income
- $54,837
- Composite
- 43.27/100
- National rank
- #3047
- State rank
- #172 of 826 in TX
Livability — Scurry
- Score
- 66/100
- State rank
- #616
- US rank
- #11669
Category grades
Schools grade is shown separately in the Schools card above.
Census & demographics
- Population (ZIP)
- 23,301
Population outlook (Kaufman County) Hauer SSP2
- Today (2025)
- 138,716 people
- By 2030
- 150,815 · +8.7%
- By 2040
- 174,877 · +26.1%
- By 2050
- 198,020 · +42.8%
- By 2075
- 251,908 · +81.6%
- By 2100
- 285,325 · +105.7%
Race, ethnicity, and origin ACS 2023
- Neighborhood character
- Diverse neighborhood (Simpson 0.57)
- Race & ethnicity
- White 53% Hispanic / Latino 39% Two or more races 23% Black 4%
- Hispanic origin (detail)
- Mexican 36%
- Common ancestry
- Italian 1% Slovak 1% Serbian 1%
- Foreign-born
- 10% · Canada
- Languages at home
- 69% English-only · Spanish 30%
Political lean MEDSL · Kaufman
- 2024 margin
- Strong R (+27.9) · D 35.6% · R 63.5%
- 2008→2024 swing
- +7.9pp toward D · 2008: -35.8pp · 2024: -27.9pp
- All cycles
- 2024: R+27.9 2020: R+33.9 2016: R+47.0 2012: R+44.4 2008: R+35.8
Not yet ingested
- Civics
- —
Market trends
- HPI YoY
- ▼ -64.48%
- Current HPI
- 261.3091
- Rent YoY
- —
- Metro
- —
- State GDP YoY
- ▲ 3.95%
- F500 in state
- 110
Industry mix (Fortune 500 HQ in TX)
| Industry | F500 HQs | Revenue |
|---|---|---|
| Energy | 16 | $1,198B |
|
||
| Technology | 5 | $198B |
|
||
| Engineering / Construction | 4 | $72B |
|
||
| Energy Services | 3 | $60B |
|
||
| Utilities | 3 | $41B |
|
||
| Healthcare | 2 | $330B |
|
||
Price history
-10.9% since first listed6 events — show timeline
- 2026-05-06 Listed $155,000 NTREIS
- 2026-04-30 Listing Removed — NTREIS
- 2026-03-30 Price Changed $159,900 NTREIS
- 2026-03-12 Price Changed $165,000 NTREIS
- 2025-11-12 Price Changed $169,900 NTREIS
- 2025-09-12 Listed $174,000 NTREIS
Property tax history
+5.0%/yrLatest (2025): $806 · +142.0% YoY. Source: county tax records.
Cash-flow waterfall
monthlySold comps — $/sqft
last 12 mo · ≤1 miLoading sold comps…