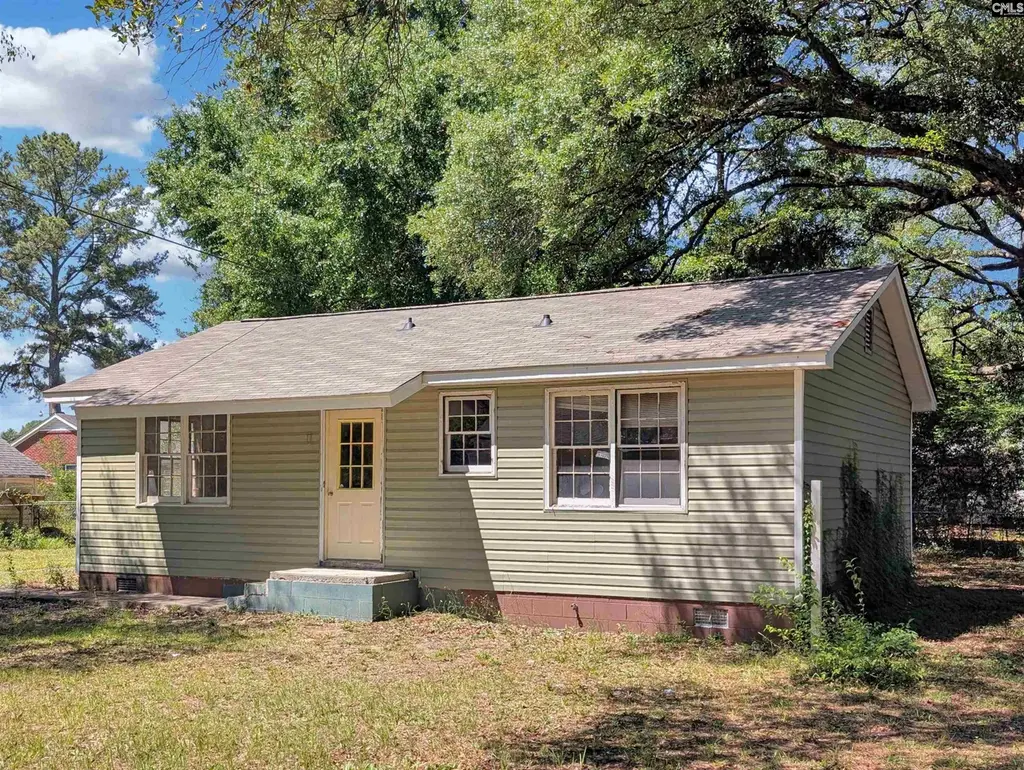
328 Chavis St · West Columbia, SC
Flood risk 1/10 · Minimal
- FEMA flood zone
- X (unshaded)
- Chance of flooding over 30 yrs
- 0.0%
- Est. flood insurance / yr
- $507 – $1,088
Fire risk 1/10 · Minimal
- Est. fire insurance / yr
- $783 – $1,453
Heat risk 7/10 · Major
- Hot days now (above 108°F)
- 7 days/yr
- Hot days in 30 yrs
- 16 days/yr
Wind risk 6/10 · Moderate
- Chance of severe wind over 30 yrs
- 65.0%
Air-quality risk 3/10 · Minor
- Unhealthy air days now
- 2 days/yr
- Unhealthy air days in 30 yrs
- 2 days/yr
Risk factors via First Street. Map © Google.
Why this score? — see what drove the D+ grade
The composite is a weighted blend of 9 inputs, each scored 0–100. Each bar is that input's sub-score; the figure is the points it added to the 100-point composite (weight × sub-score).
- Cash flow +19.0/30.0
- ARV discount +7.5/15.0
- DSCR +6.0/10.0
- 1% rule +5.3/10.0
- Rent growth +3.4/5.0
- Livability +3.2/5.0
- Schools +2.9/10.0
- Condition / age +2.5/5.0
- Appreciation +0.0/10.0
$125,000
🖨 Deal sheet 📄 Offer letter ✓ Due diligence
Listing remarks
Investor Special in West Columbia, SC! This 2-bedroom, 1-bath home offers a fantastic opportunity for investors or anyone looking to RENOVATE and BUILD EQUITY. The current layout is of an open floor plan that provides plenty of potential for updates and customization. To get you started, the ROOF and SIDING were both replaced in 2024. The home is located in the Lexington Two School District and is just minutes from Downtown Columbia, shopping, dining, entertainment, and major highways. The convenient location also makes this home an excellent option for OFF-CAMPUS HOUSING for students attending the University of South Carolina, Benedict College, or Allen University. Whether you're searching
Key facts
- Open floor plan
- 8,886 sq ft lot
- Built 1986
Tags
Property features AI
Exterior
- Utilities: Public water; Public sewer
- Home design: Single-story home
- Construction: Crawlspace foundation
- Exterior features: Vinyl exterior finish; Paved road access; Approximately 0.204-acre lot
Interior
- Kitchen: Kitchen located on the main level
- Bedrooms: Master bedroom on the main level with a private closet and vinyl floors; Second bedroom on the main level with a private closet and vinyl floors
- Flooring: Vinyl flooring in bedrooms
- Bathrooms: One full bathroom
- Heating & cooling: Total heated area 864
- Interior features: Family room on the main level
- Laundry & utility: Washer/dryer area on the main level
Neighborhood map
What this means for you Summary
Snapshot
- This is a 2-bed/1.0-bath single-family listed at $125k.
Deal economics
- At list price, monthly cash flow is $130 ($2k/yr) — positive.
- The deal already cash-flows at list — no discount required.
- Meets the 1% rule at list price ($1k rent vs $125k).
Location & tenants
- Location reads 63/100 on livability (#168 in SC) — a middle-class / working-renter tenant base. Strengths: cost of living A+, housing A+, health & safety A+; Watch: employment D+, schools D, crime F.
- Lexington 02 (suburban): math 30% / reading 38% proficiency, ranked #45 of 80 in SC (top 56%) — families likely to look elsewhere, expect single-tenant / working-renter base with shorter leases.
- Market conditions: Rents rising (+3.5%/yr); 127 active listings in the ZIP; 28 comparable units currently listed for rent nearby; rentals at typical pace (median 14d on market — plan ~3-4 weeks tenant-placement turnaround); 1,712 units permitted in Lexington County in 2024 (0 in 5+ unit buildings).
Forward outlook
- Local home prices are declining (-3.0%/yr); year-one equity from $864 of loan paydown is wiped out by about $4k of value loss. Plan a longer hold.
- Lexington County population projected at +26% by 2050 — long-run rental-demand tailwind backs the buy-and-hold thesis.
Negotiation context
- Only 9 days on market — expect competitive offers; lowballing is unlikely to land.
- Current owner paid $35k; list at $125k implies a 257% gain — meaningful room to come down on a strong offer.
Risks & watch-outs
- Climate carrying-cost: major wind risk, 65% chance of damaging wind over 30y; extreme-heat days projected 7→16/yr by 2055 (HVAC capex compounding) — expect insurance premiums to compound above CPI over the hold.
Questions for the listing agent
- Is there a deadline driving the sale (1031 exchange, divorce, estate, relocation)? That informs how much negotiation room exists.
- Schools are D-rated, which usually means shorter tenancies and higher turnover. Who's the typical renter profile here, and what's been the actual vacancy rate?
- Crime grade is F in this area — have there been break-ins, vandalism, or insurance claims at this property in the last 3 years? What carrier currently insures it and at what premium?
- The area grade is low — what's the realistic commute time and amenity access for the typical tenant pool here? Any planned neighborhood developments (good or bad) we should know about?
- What's the average days-on-market for RENTAL listings here right now (not sales)? A rising rental-DOM trend means longer vacancies and softer asking-rent achievability than the comps imply.
- What's the recent tenant-quality profile in this submarket — average credit score on applications, eviction rate, late-payment / NSF rate, and stable-employment percentage? A property-management company in the area should have these aggregated.
- How much new for-sale + rental construction is in the pipeline within 1–3 miles? Heavy new supply typically softens prices + rents 12–24 months out; constrained supply supports both.
Investment metrics
- 1% rule
- 1.03% ✓
- Cap rate
- 7.54%
- Cash-on-cash
- 4.44%
- DSCR
- 1.20
- GRM
- 8.1
CMA / ARV
No comps found within radius.
Projected returns pro-forma
-3.0% appreciation · 3.48% rent growth · sell at horizon
- IRR
- -8.8%
- Equity multiple
- 0.68×
- Total profit
- $-11,346
- Equity at exit
- $18,638
- IRR
- 1.4%
- Equity multiple
- 1.10×
- Total profit
- $3,456
- Equity at exit
- $10,808
Cash invested: $35,000 (down + closing). Projections, not guarantees.
Landlord ↔ Tenant lean methodology
- Overall (STATE)
- 90 Strongly Landlord-Friendly
- State South Carolina
- 90 Strongly Landlord-Friendly · R+6
- County
- — inherits STATE
- City
- — inherits STATE
ZIP-level market 29169
- Home prices YoY
- -15.8%
- Rents YoY
- 3.5%
- Active inventory
- 127
- Price-to-rent
- 8.1×
Monthly cashflow live
- Estimated rent
- $1,283 high interval (Pro) →
- Mortgage (P&I)
- −$656
- Tax from tax record
- −$176 /mo · $2,112/yr
- Insurance
- −$52
- HOA
- −$0
- Vacancy / Maint / Mgmt
- −$269
- Net cashflow
- $130
Break-even live
UW: 25.0% down · 7.5% · 30yr · 1.5% tax · 5.0% vac · 8.0% maint · 8.0% mgmt
Financing live
Cash to close
- Down payment
- $31,250
- Closing costs
- $3,750
- Reserves months
- —
- Total cash needed
- —
Loan-product check · same deal, 3 products live
Conventional
25% down · 7.5% · 30yr
- Down + closing
- —
- Monthly P&I
- —
- Monthly cashflow
- —
- DSCR
- —
- Eligible?
- —
Personal DTI + credit; lowest rate.
DSCR
20% down · 8.5% · 30yr
- Down + closing
- —
- Monthly P&I
- —
- Monthly cashflow
- —
- DSCR
- —
- Eligible?
- —
No personal income docs; deal must DSCR.
Hard money
10% down · 12.0% · 12mo
- Down + closing
- —
- Monthly P&I
- —
- Monthly cashflow
- —
- DSCR
- —
- Eligible?
- —
Short-term bridge; refi at stabilization.
Rent comps 28 comps
| Address | Beds | Baths | Sqft | Rent | $/sqft | DOM | Units | Dist |
|---|---|---|---|---|---|---|---|---|
| 1713 Crapps Ave West Columbia, SC | 2.0 | 1.0 | 925 | $1,095 | $1.18 | 14d | 1 | 0.25mi |
| 1713 Crapps Ave Unit 1 West Columbia, SC | 2.0 | 1.0 | 925 | $1,095 | $1.18 | 19d | 1 | 0.25mi |
| 524 Wessinger St West Columbia, SC | 2.0 | 1.5 | 900 | $1,300 | $1.44 | 21d | 1 | 0.29mi |
| 528 Wessinger St West Columbia, SC | 2.0 | 1.0 | 800 | $1,095 | $1.37 | 11d | 1 | 0.32mi |
| 1639 North Ave West Columbia, SC | 2.0 | 1.5 | 900 | $1,150 | $1.28 | 23d | 1 | 0.38mi |
| 614 Wessinger St West Columbia, SC | 2.0 | 1.0–1.5 | 1012 | $960 | $0.95 | 23d | 2 | 0.38mi |
| 1717 Burnham St West Columbia, SC | 1.0 | 1.0 | 725 | $950 | $1.31 | 11d | 1 | 0.42mi |
| 316 N Parson St West Columbia, SC | 2.0 | 1.0 | 1000 | $1,300 | $1.30 | 2d | 1 | 0.62mi |
| 320 Dreher Rd Unit 5 West Columbia, SC | 2.0 | 1.0 | 1000 | $1,000 | $1.00 | 23d | 1 | 0.81mi |
| 246 Dreher Rd West Columbia, SC | 2.0 | 1.0 | 800 | $1,400 | $1.75 | 14d | 1 | 0.82mi |
| 944 Glenn St West Columbia, SC | 2.0 | 1.0 | 960 | $1,150 | $1.20 | 23d | 1 | 0.87mi |
| 332 Guilford St West Columbia, SC | 3.0 | 1.0 | 958 | $1,550 | $1.62 | 21d | 1 | 0.93mi |
| 1736 12th St Unit 1754 Cayce, SC | 2.0 | 1.5 | 868 | $1,250 | $1.44 | 2d | 1 | 0.94mi |
| 304 S Marble St West Columbia, SC | 2.0 | 1.0 | 900 | $1,450 | $1.61 | 14d | 1 | 1.00mi |
| 306 S Marble St Unit 1 West Columbia, SC | 3.0 | 2.0 | 950 | $2,200 | $2.32 | 14d | 1 | 1.00mi |
| 614 North St West Columbia, SC | 2.0 | 1.0 | 870 | $945 | $1.09 | 2d | 1 | 1.01mi |
| 766 Augusta St Unit B3 West Columbia, SC | 2.0 | 1.0 | 750 | $1,150 | $1.53 | 23d | 1 | 1.05mi |
| 506 N Line St Unit A West Columbia, SC | 2.0 | 1.0 | 820 | $1,199 | $1.46 | 14d | 1 | 1.10mi |
| 506 N Line St Unit A West Columbia, SC | 2.0 | 1.0 | 820 | $1,100 | $1.34 | 11d | 1 | 1.10mi |
| 506 N Line St West Columbia, SC | 2.0 | 1.0 | 820 | $1,200 | $1.46 | 23d | 1 | 1.10mi |
| 506 N Line St West Columbia, SC | 2.0 | 1.0 | 820 | $1,200 | $1.46 | 11d | 1 | 1.10mi |
| 208 S Cromwell St Apt E West Columbia, SC | 2.0 | 1.5 | 1000 | $1,200 | $1.20 | 14d | 1 | 1.12mi |
| 221 S Lucas St West Columbia, SC | 2.0 | 1.0 | 1050 | $1,185 | $1.13 | 23d | 1 | 1.22mi |
| 617 Lexington Ave Unit C Cayce, SC | 2.0 | 1.0 | 830 | $1,300 | $1.57 | 14d | 1 | 1.40mi |
| 615 Lexington Ave Unit A Cayce, SC | 2.0 | 1.0 | 800 | $1,300 | $1.62 | 23d | 1 | 1.41mi |
| 504 State St West Columbia, SC | 2.0 | 1.0 | 1000 | $1,500 | $1.50 | 2d | 1 | 1.43mi |
| 800 Comanchee Trl Unit C3 West Columbia, SC | 2.0 | 1.0 | 840 | $985 | $1.17 | 23d | 1 | 1.48mi |
| 100 Riverbend Dr West Columbia, SC | 1.0–3.0 | 1.0–2.0 | 821 | $1,198 | $1.46 | 23d | 1 | 1.49mi |
Listing history 8 events
-
2026-06-18days on market $125,000 Active 9 DOM
-
2026-06-17days on market $125,000 Active 8 DOM
-
2026-06-16days on market $125,000 Active 7 DOM
-
2026-06-15days on market $125,000 Active 6 DOM
-
2026-06-14days on market $125,000 Active 4 DOM
-
2026-06-13days on market $125,000 Active 3 DOM
-
2026-06-10remarks 699-char remark
-
2026-06-10$125,000 Active 1 DOM
ⓘ Source: listings_history table (triggers on properties + properties_extension) + one-shot
backfill from property_details.listing_events for pre-trigger history.
Tax reassessment forecast SC · Resets to sale price
- Current annual tax
- $2,112 · $176/mo
- Projected year-2 tax
- $2,112 · $176/mo
- Expected delta
- $0/yr ($0/mo · 0.0%)
ⓘ Screening estimate from a state-policy table — verify with the county assessor before closing.
Climate risk First Street
- Flood 1/10 Low FEMA zone X (unshaded) · 0% chance over 30 yrs
- Wildfire 1/10 Low
- Heat 7/10 Severe 7 d/yr ≥108°F today · 16 d/yr by 30 yrs out
- Wind 6/10 Major 65% chance of damaging wind over 30 yrs
- Air quality 3/10 Moderate 2 unhealthy d/yr today · 2 by 30 yrs out
Nearby sold comps map
Loading sold comps map…
Walkable amenities ~0.75 mi
Loading nearby amenities…
Taxation est. · year 1
- Rental income
- $15,391
- − Mortgage interest
- −$7,002
- − Property taxes
- −$2,112
- − Insurance
- −$625
- − Repairs & maintenance
- −$1,231
- − Management
- −$1,231
- − Depreciation
- −$3,636
- Taxable loss
- −$447
- Est. tax savings @ 24.0%
- +$107
- After-tax cash flow
- $1,663/yr
For passive investors: Depreciation is non-cash, so a rental often shows a tax loss while cash-flowing — sheltering income. Rental losses are passive: they offset passive income freely, and up to $25,000/yr can offset ordinary (W-2) income if you actively participate and your MAGI is under $100k (phasing out to $0 by $150k); unused losses carry forward. On sale, claimed depreciation is recaptured at up to 25%, and gains may owe capital-gains tax (a 1031 exchange can defer both). Figures are a year-1 estimate at your 24.0% rate — not tax advice; consult a CPA.
Schools (NCES district)
- District
- Lexington 02
- NCES district ID
- 4502730
- Math proficiency
- 30% ▼ -6.00%
- Reading proficiency
- 38% ▬ 0.00%
- Median HH income
- $42,532
- Composite
- 28.78/100
- National rank
- #6669
- State rank
- #45 of 80 in SC
Livability — West Columbia
- Score
- 63/100
- State rank
- #168
- US rank
- #15166
Category grades
Schools grade is shown separately in the Schools card above.
Census & demographics
- Census place
- West Columbia, SC
- County
- Lexington County · 232,571 people
- City population
- 21,647
- Metro
- Columbia, SC
- Population (ZIP)
- 21,647
- Household income
- $57,122
- Rent vs Own
- Severe rent burden
- 1172.0
Population outlook (Lexington County) Hauer SSP2
- Today (2025)
- 322,999 people
- By 2030
- 342,356 · +6.0%
- By 2040
- 377,715 · +16.9%
- By 2050
- 406,984 · +26.0%
- By 2075
- 465,447 · +44.1%
- By 2100
- 485,674 · +50.4%
Race, ethnicity, and origin ACS 2023
- Neighborhood character
- Predominantly White (66%)
- Race & ethnicity
- White 66% Black 16% Two or more races 11% Hispanic / Latino 10% Asian 3%
- Hispanic origin (detail)
- Mexican 6%
- Common ancestry
- Serbian 2% Italian 2% Lithuanian 2%
- Foreign-born
- 8% · Canada, China
- Languages at home
- 88% English-only · Spanish 8% Other Indo-European 1% Chinese 1%
Political lean MEDSL · Lexington
- 2024 margin
- Solid R (+33.5) · D 32.5% · R 66.0% · Other 1.4%
- 2008→2024 swing
- +4.6pp toward D · 2008: -38.0pp · 2024: -33.5pp
- All cycles
- 2024: R+33.5 2020: R+30.1 2016: R+36.7 2012: R+37.8 2008: R+38.0
Not yet ingested
- Civics
- —
Market trends
- HPI YoY
- ▼ -53.87%
- Current HPI
- 287.4791
- Rent YoY
- ▲ 3.48%
- Metro
- Columbia, SC
- State GDP YoY
- ▲ 4.51%
- F500 in state
- 2
Industry mix (Fortune 500 HQ in SC)
| Industry | F500 HQs | Revenue |
|---|---|---|
| Packaging | 1 | $7B |
|
||
Price history
+257.1% since first listed2 events — show timeline
- 2026-06-09 Listed $125,000 Consolidated MLS
- 1996-07-01 Sold (Public Records) $35,000 Public Records
Property tax history
+6.5%/yrLatest (2024): $2,112 · +6.5% YoY. Source: county tax records.
Cash-flow waterfall
monthlySold comps — $/sqft
last 12 mo · ≤1 miLoading sold comps…