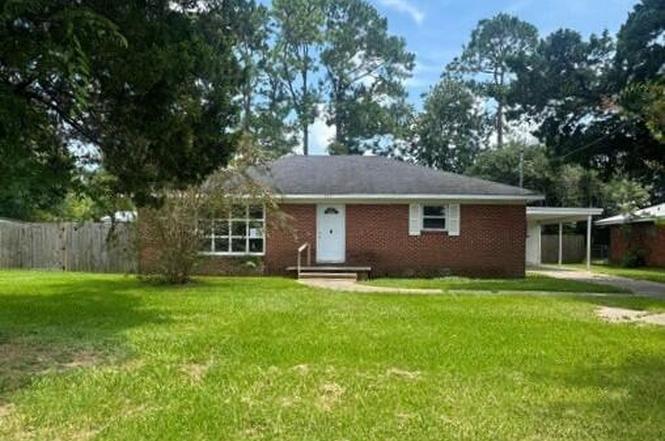
505 James St · New Iberia, LA
Flood risk 4/10 · Minor
- FEMA flood zone
- X (unshaded)
- Chance of flooding over 30 yrs
- 0.2%
- Est. flood insurance / yr
- $507 – $1,088
Fire risk 1/10 · Minimal
- Est. fire insurance / yr
- $1,269 – $2,357
Heat risk 9/10 · Severe
- Hot days now (above 109°F)
- 7 days/yr
- Hot days in 30 yrs
- 22 days/yr
Wind risk 9/10 · Severe
- Chance of severe wind over 30 yrs
- 99.0%
Air-quality risk 2/10 · Minimal
- Unhealthy air days now
- 1 days/yr
- Unhealthy air days in 30 yrs
- 1 days/yr
Risk factors via First Street. Map © Google.
Why this score? — see what drove the B- grade
The composite is a weighted blend of 9 inputs, each scored 0–100. Each bar is that input's sub-score; the figure is the points it added to the 100-point composite (weight × sub-score).
- Cash flow +30.0/30.0
- 1% rule +10.0/10.0
- DSCR +10.0/10.0
- ARV discount +7.5/15.0
- Livability +3.7/5.0
- Schools +3.2/10.0
- Rent growth +2.5/5.0
- Condition / age +2.5/5.0
- Appreciation +0.0/10.0
$42,000
🖨 Deal sheet 📄 Offer letter ✓ Due diligence
Listing remarks MLS
Are you looking for a brick home on a double lot thats not far from amenities? This home has 4 bedrooms and 2 bathrooms with an extra room that can be used for an office or den. The roof and windows are brand new with warranty. Enjoy your spacious backyard and also a nice size storage attached to the covered parking. There's a lot to enjoy with this home, schedule your private showing today!
Key facts
- Ample cabinetry
- Newer wood floors
- Brick-front home
Tags
Property features AI
Exterior
- Parking: Carport (1 covered space, total 1 parking space)
- Utilities: Public sewer; Electric service by CLECO
- Home design: Single-family residence
- Construction: Composition roof; Aluminum siding; Brick veneer; HardiPlank-type siding; Brick; Frame construction; Metal siding
- Exterior features: Exterior lighting; Open porch/patio; Paved road frontage
Interior
- Kitchen: Granite counters; Solid surface counters
- Flooring: Tile; Wood
- Bathrooms: 2 full bathrooms
- Heating & cooling: Central heating; Central air
- Interior features: Built-in features; Separate shower; Granite counters; Solid surface counters; Tile and wood flooring; Central heating; Central air
Neighborhood map
What this means for you Summary
Snapshot
- This is a 3-bed/2.0-bath single-family listed at $42k.
Deal economics
- At list price, monthly cash flow is $708 ($8k/yr) — positive.
- The deal already cash-flows at list — no discount required.
- Meets the 1% rule at list price ($1k rent vs $42k).
- Recommended offer: $37k (12.0% below list) — sets the bar for market timing.
- Cap rate 26.5% vs local median 5.8% in New Iberia — top-decile yield for the area; either an underpriced asset or a hidden risk that comps aren't pricing in. Stress-test before assuming the spread holds.
Location & tenants
- Location reads 73/100 on livability (#33 in LA) — a middle-class / working-renter tenant base. Strengths: cost of living A+, housing A+, health & safety A+; Watch: commute D+, crime F, employment F.
- Iberia Parish (other): math 32% / reading 43% proficiency, ranked #27 of 98 in LA (top 28%) — families likely to look elsewhere, expect single-tenant / working-renter base with shorter leases; 66% free/reduced lunch — lower-income household profile, screen leases tightly.
- Zoned schools: Pesson Addition Elementary School (math 32% / reading 33%, grade F, #300 of 646 statewide, top 47%, 415 students, 84% FRL); Iberia Middle School (math 20% / reading 40%, grade F, #114 of 218 statewide, top 53%, 498 students, 77% FRL); New Iberia Senior High School (math 35% / reading 52%, grade F, #64 of 265 statewide, top 24%, 1,449 students, 62% FRL).
- Market conditions: 237 active listings in the ZIP; 94 units permitted in Iberia Parish in 2024 (0 in 5+ unit buildings).
Forward outlook
- Local home prices are declining (-3.0%/yr); year-one equity from $290 of loan paydown is wiped out by about $1k of value loss. Plan a longer hold.
- Iberia County population projected to shrink 4% by 2050 — rents likely to lag national; underwrite the cash flow, not the appreciation.
- At projected returns (-3.0% appreciation + 3.0% rent growth), your $12k cash investment doubles in ~2 years — after that, you're playing with house money.
Negotiation context
- It's been on market 180 days — a 12% lower offer ($37k) is reasonable based on typical stale-listing flexibility.
- 6 sale attempts since 6y ago; this cycle's ask has dropped $83k (66%) from the opening price — seller is motivated, your offer sets the floor, not the list.
Risks & watch-outs
- Climate carrying-cost: severe wind risk, 99% chance of damaging wind over 30y; extreme-heat days projected 7→22/yr by 2055 (HVAC capex compounding) — expect insurance premiums to compound above CPI over the hold.
Questions for the listing agent
- It's been on market 180 days. Have you received any prior offers? Is the seller open to a 12% concession, seller financing, or rate buy-down credit?
- Built in 1960 — when were the roof, HVAC, electrical panel, plumbing, and water heater last replaced?
- Why hasn't it sold? Are there any deal-killer items the seller is aware of (foundation, flood, title, zoning, code violations)?
- Is there a deadline driving the sale (1031 exchange, divorce, estate, relocation)? That informs how much negotiation room exists.
- Schools are B-rated — typically a magnet for longer-tenancy family renters. What's the average tenant stay here, and is there a school-zone premium baked into asking?
- Crime grade is F in this area — have there been break-ins, vandalism, or insurance claims at this property in the last 3 years? What carrier currently insures it and at what premium?
- What's the average days-on-market for RENTAL listings here right now (not sales)? A rising rental-DOM trend means longer vacancies and softer asking-rent achievability than the comps imply.
- What's the recent tenant-quality profile in this submarket — average credit score on applications, eviction rate, late-payment / NSF rate, and stable-employment percentage? A property-management company in the area should have these aggregated.
- How much new for-sale + rental construction is in the pipeline within 1–3 miles? Heavy new supply typically softens prices + rents 12–24 months out; constrained supply supports both.
Investment metrics
- 1% rule
- 2.97% ✓
- Cap rate
- 26.52%
- Cash-on-cash
- 72.23%
- DSCR
- 4.21
- GRM
- 2.8
CMA / ARV
- ARV (on-the-fly)
- $200,900
- Comps found
- 6
Show comp detail 6 sales within ~0.75 mi
| Address | Dist | Beds/Ba | Sqft | Sold | Price | $/sf | Match |
|---|---|---|---|---|---|---|---|
| 617 E St. Peter St | 0.33mi | 3/2.0 | 1,963 (-2%) | 8mo | $27,000 | $14 | 74 |
| 37 Prairie Ave | 0.52mi | 3/2.0 | 1,988 (-1%) | 7mo | $198,000 | $100 | 68 |
| 310 S Evangeline St | 0.57mi | 3/2.0 | 1,934 (-4%) | 1mo | $196,000 | $101 | 66 |
| 625 E Main St | 0.45mi | 3/3.0 | 2,130 (+6%) | 15mo | $278,350 | $131 | 53 |
| 722 S Lewis St | 0.35mi | 3/2.5 | 2,200 (+10%) | 23mo | $158,500 | $72 | 47 |
| 102 Myrtle Oak Dr | 0.67mi | 4/2.0 (+1) | 2,267 (+13%) | 1mo | $130,000 | $57 | 42 |
Match score weights: distance 35% · size 25% · config 20% · recency 20%. Top-matched comps best support the ARV.
Projected returns pro-forma
-3.0% appreciation · 3.0% rent growth · sell at horizon
- IRR
- 71.9%
- Equity multiple
- 4.26×
- Total profit
- $38,290
- Equity at exit
- $6,262
- IRR
- 75.8%
- Equity multiple
- 8.78×
- Total profit
- $91,439
- Equity at exit
- $3,631
Cash invested: $11,760 (down + closing). Projections, not guarantees.
Landlord ↔ Tenant lean methodology
- Overall (STATE)
- 90 Strongly Landlord-Friendly
- State Louisiana
- 90 Strongly Landlord-Friendly · R+12
- County
- — inherits STATE
- City
- — inherits STATE
ZIP-level market 70560
- Home prices YoY
- -29.8%
- Active inventory
- 237
- Price-to-rent
- 2.8×
Monthly cashflow live
- Estimated rent
- $1,246 medium interval (Pro) →
- Mortgage (P&I)
- −$220
- Tax from tax record
- −$39 /mo · $467/yr
- Insurance
- −$18
- HOA
- −$0
- Vacancy / Maint / Mgmt
- −$262
- Net cashflow
- $708
Break-even live
UW: 25.0% down · 7.5% · 30yr · 1.5% tax · 5.0% vac · 8.0% maint · 8.0% mgmt
Financing live
Cash to close
- Down payment
- $10,500
- Closing costs
- $1,260
- Reserves months
- —
- Total cash needed
- —
Loan-product check · same deal, 3 products live
Conventional
25% down · 7.5% · 30yr
- Down + closing
- —
- Monthly P&I
- —
- Monthly cashflow
- —
- DSCR
- —
- Eligible?
- —
Personal DTI + credit; lowest rate.
DSCR
20% down · 8.5% · 30yr
- Down + closing
- —
- Monthly P&I
- —
- Monthly cashflow
- —
- DSCR
- —
- Eligible?
- —
No personal income docs; deal must DSCR.
Hard money
10% down · 12.0% · 12mo
- Down + closing
- —
- Monthly P&I
- —
- Monthly cashflow
- —
- DSCR
- —
- Eligible?
- —
Short-term bridge; refi at stabilization.
Listing history 20 events
-
2026-05-21status Pending
-
2026-05-21price $42,000
-
2026-05-21status Active
-
2026-03-04status Pending
-
2026-02-20status Active
-
2026-02-20price $44,175
-
2025-12-27price $85,000
-
2025-11-22price $100,000
-
2025-10-22price $115,000
-
2025-09-03$125,000 Active
-
2025-06-03price $170,000
-
2025-04-09$180,000 Active
-
2021-03-22soldstatus $130,000
-
2021-03-19soldstatus $130,000 394-char remark
Show marketing remark (394 chars)
Are you looking for a brick home on a double lot thats not far from amenities? This home has 4 bedrooms and 2 bathrooms with an extra room that can be used for an office or den. The roof and windows are brand new with warranty. Enjoy your spacious backyard and also a nice size storage attached to the covered parking. There's a lot to enjoy with this home, schedule your private showing today!
-
2020-12-29$130,000 394-char remark
Show marketing remark (394 chars)
Are you looking for a brick home on a double lot thats not far from amenities? This home has 4 bedrooms and 2 bathrooms with an extra room that can be used for an office or den. The roof and windows are brand new with warranty. Enjoy your spacious backyard and also a nice size storage attached to the covered parking. There's a lot to enjoy with this home, schedule your private showing today!
-
2020-05-15soldstatus $26,500
-
2020-03-19$29,900
-
2007-06-05soldstatus
-
2007-06-01soldstatus $78,652
-
1979-10-17soldstatus
ⓘ Source: listings_history table (triggers on properties + properties_extension) + one-shot
backfill from property_details.listing_events for pre-trigger history.
Tax reassessment forecast LA · Resets to sale price
- Current annual tax
- $467 · $39/mo
- Projected year-2 tax
- $467 · $39/mo
- Expected delta
- $0/yr ($0/mo · 0.0%)
ⓘ Screening estimate from a state-policy table — verify with the county assessor before closing.
Climate risk First Street
- Flood 4/10 Moderate FEMA zone X (unshaded) · 20% chance over 30 yrs
- Wildfire 1/10 Low
- Heat 9/10 Extreme 7 d/yr ≥109°F today · 22 d/yr by 30 yrs out
- Wind 9/10 Extreme 99% chance of damaging wind over 30 yrs
- Air quality 2/10 Low 1 unhealthy d/yr today · 1 by 30 yrs out
Nearby sold comps map
Loading sold comps map…
Walkable amenities ~0.75 mi
Loading nearby amenities…
Taxation est. · year 1
- Rental income
- $14,955
- − Mortgage interest
- −$2,353
- − Property taxes
- −$467
- − Insurance
- −$210
- − Repairs & maintenance
- −$1,196
- − Management
- −$1,196
- − Depreciation
- −$1,222
- Taxable income
- $8,311
- Est. tax owed @ 24.0%
- −$1,995
- After-tax cash flow
- $6,500/yr
For passive investors: Depreciation is non-cash, so a rental often shows a tax loss while cash-flowing — sheltering income. Rental losses are passive: they offset passive income freely, and up to $25,000/yr can offset ordinary (W-2) income if you actively participate and your MAGI is under $100k (phasing out to $0 by $150k); unused losses carry forward. On sale, claimed depreciation is recaptured at up to 25%, and gains may owe capital-gains tax (a 1031 exchange can defer both). Figures are a year-1 estimate at your 24.0% rate — not tax advice; consult a CPA.
Schools (NCES district)
- District
- Iberia Parish
- NCES district ID
- 2200720
- Math proficiency
- 32% ▼ -43.00%
- Reading proficiency
- 43% ▼ -35.00%
- Median HH income
- $43,289
- Composite
- 31.74/100
- National rank
- #5904
- State rank
- #27 of 98 in LA
Livability — New Iberia
- Score
- 73/100
- State rank
- #33
- US rank
- #5376
Category grades
Schools grade is shown separately in the Schools card above.
Census & demographics
- Census place
- New Iberia, LA
- Population (ZIP)
- 37,589
Population outlook (Iberia County) Hauer SSP2
- Today (2025)
- 74,632 people
- By 2030
- 74,368 · -0.4%
- By 2040
- 73,223 · -1.9%
- By 2050
- 71,728 · -3.9%
- By 2075
- 69,028 · -7.5%
- By 2100
- 65,018 · -12.9%
Race, ethnicity, and origin ACS 2023
- Neighborhood character
- Diverse neighborhood (Simpson 0.61)
- Race & ethnicity
- White 52% Black 35% Two or more races 8% Hispanic / Latino 6% Asian 2%
- Hispanic origin (detail)
- Mexican 2%
- Common ancestry
- Lithuanian 11% Italian 1% Serbian 1%
- Foreign-born
- 3% · Canada
- Languages at home
- 93% English-only · French/Haitian/Cajun 3% Spanish 2% Other Asian/Pacific 1%
Political lean MEDSL · Iberia
- 2024 margin
- Solid R (+34.1) · D 32.4% · R 66.5% · Other 1.1%
- 2008→2024 swing
- -11.1pp toward R · 2008: -23.0pp · 2024: -34.1pp
- All cycles
- 2024: R+34.1 2020: R+31.2 2016: R+31.4 2012: R+26.2 2008: R+23.0
Not yet ingested
- Civics
- —
Market trends
- HPI YoY
- ▼ -65.82%
- Current HPI
- 154.9018
- Rent YoY
- —
- Metro
- —
- State GDP YoY
- ▲ 3.29%
- F500 in state
- 10
Industry mix (Fortune 500 HQ in LA)
| Industry | F500 HQs | Revenue |
|---|---|---|
| Telecommunications | 2 | $23B |
|
||
| Utilities | 1 | $12B |
|
||
| Wholesale / Distribution | 1 | $5B |
|
||
| Advertising | 1 | $2B |
|
||
Price history
-46.6% since first listed20 events — show timeline
- 2026-05-21 Pending — AcadianaMLS
- 2026-05-21 Price Changed $42,000 AcadianaMLS
- 2026-05-21 Relisted — AcadianaMLS
- 2026-03-04 Pending — AcadianaMLS
- 2026-02-20 Relisted — AcadianaMLS
- 2026-02-20 Price Changed $44,175 AcadianaMLS
- 2025-12-27 Price Changed $85,000 AcadianaMLS
- 2025-11-22 Price Changed $100,000 AcadianaMLS
- 2025-10-22 Price Changed $115,000 AcadianaMLS
- 2025-09-03 Listed $125,000 AcadianaMLS
- 2025-06-03 Price Changed $170,000 AcadianaMLS
- 2025-04-09 Listed $180,000 AcadianaMLS
- 2021-03-22 Sold (Public Records) $130,000 Public Records
- 2021-03-19 Sold (MLS) $130,000 AcadianaMLS
- 2020-12-29 Listed $130,000 AcadianaMLS
- 2020-05-15 Sold (MLS) $26,500 AcadianaMLS
- 2020-03-19 Listed $29,900 AcadianaMLS
- 2007-06-05 Sold (Public Records) — Public Records
- 2007-06-01 Sold (Public Records) $78,652 Public Records
- 1979-10-17 Sold (Public Records) — Public Records
Property tax history
-2.5%/yrLatest (2025): $467 · +2.0% YoY. Source: county tax records.
Cash-flow waterfall
monthlySold comps — $/sqft
last 12 mo · ≤1 miLoading sold comps…