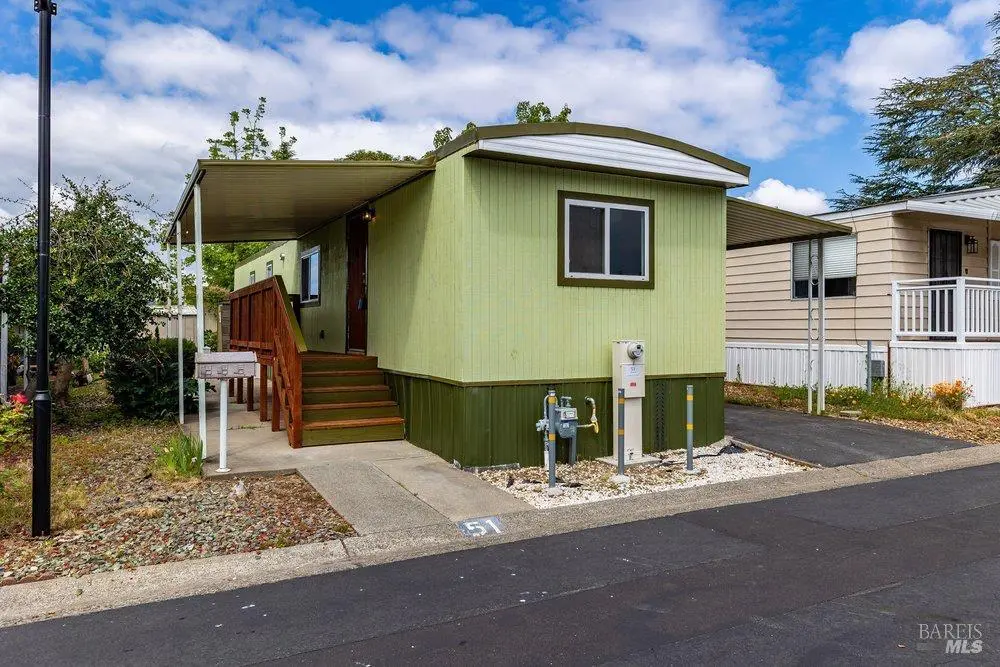
150 Silverado Trl #51 · Napa, CA
Flood risk 1/10 · Minimal
- FEMA flood zone
- X (unshaded)
- Chance of flooding over 30 yrs
- 0.0%
- Est. flood insurance / yr
- $507 – $1,088
Fire risk 6/10 · Moderate
- Est. fire insurance / yr
- $659 – $1,223
Heat risk 5/10 · Moderate
- Hot days now (above 95°F)
- 7 days/yr
- Hot days in 30 yrs
- 15 days/yr
Wind risk 1/10 · Minimal
- Chance of severe wind over 30 yrs
- —
Air-quality risk 9/10 · Severe
- Unhealthy air days now
- 16 days/yr
- Unhealthy air days in 30 yrs
- 17 days/yr
Risk factors via First Street. Map © Google.
Why this score? — see what drove the C+ grade
The composite is a weighted blend of 9 inputs, each scored 0–100. Each bar is that input's sub-score; the figure is the points it added to the 100-point composite (weight × sub-score).
- Cash flow +30.0/30.0
- DSCR +10.0/10.0
- 1% rule +9.8/10.0
- Schools +4.0/10.0
- Livability +3.5/5.0
- Condition / age +2.5/5.0
- Rent growth +1.8/5.0
- ARV discount +0.0/15.0
- Appreciation +0.0/10.0
$199,999
🖨 Deal sheet 📄 Offer letter ✓ Due diligence
Listing remarks
Welcome to easy living in the desirable 55+ community of Silverado Pines. This beautifully updated 1970 mobile home offers the perfect blend of modern comfort and low-maintenance lifestyle. The home features a stylishly remodeled kitchen with quartz countertops, sleek cabinetry, and stainless steel appliances, along with rich flooring and fresh finishes throughout. The bathrooms have been tastefully remodeled with a contemporary shower and updated fixtures. Enjoy abundant natural light and a peaceful setting, ideal for relaxing or entertaining. Located in the heart of Napa, you're just minutes from shopping, dining, and world-class wineries. Move-in ready and designed for comfortable, caref
Key facts
- Quartz countertops
- Remodeled kitchen
- Contemporary shower
Tags
Property features AI
Finance
- Financial info: Land lease amount applies
- HOA & community: No association; Senior community
Exterior
- Parking: Covered parking (2 spaces); Additional/other parking features
- Utilities: Natural gas connected; Public sewer; Other utilities
- Home design: Manufactured in park; Single wide
- Construction: Aluminum skirting; Holiday House make (manufactured home)
- Exterior features: Metal roof; Land lease in place; Located in a senior community (Silverado Pines)
Interior
- Kitchen: Free-standing gas range; Free-standing refrigerator; Gas cooktop; Microwave
- Bedrooms: 2 bedrooms
- Bathrooms: 2 full bathrooms; Shower stall(s); Tub with shower over
- Heating & cooling: Central heating; Central cooling
- Interior features: Updated/remodeled condition; Breakfast area; Kitchen island; Slab countertops; Unfurnished
- Laundry & utility: Stacked washer and dryer included
Neighborhood map
What this means for you Summary
Snapshot
- This is a 2-bed/2.0-bath manufactured listed at $200k.
Deal economics
- At list price, monthly cash flow is $956 ($11k/yr) — positive.
- The deal already cash-flows at list — no discount required.
- Meets the 1% rule at list price ($3k rent vs $200k).
- Recommended offer: $194k (3.0% below list) — sets the bar for market timing.
- Cap rate 12.0% vs local median 2.0% in Napa — top-decile yield for the area; either an underpriced asset or a hidden risk that comps aren't pricing in. Stress-test before assuming the spread holds.
Location & tenants
- Location reads 70/100 on livability (#227 in CA) — a middle-class / working-renter tenant base. Strengths: employment A+, health & safety A+, amenities B+; Watch: commute F, cost of living F.
- Napa Valley Unified (urban): math 35% / reading 48% proficiency, ranked #599 of 1,400 in CA (top 43%) — families likely to look elsewhere, expect single-tenant / working-renter base with shorter leases.
- Market conditions: Rents soft (-2.7%/yr); 145 active listings in the ZIP; 4 comparable units currently listed for rent nearby; rentals lingering (median 44d on market — plan ~5-8 weeks vacancy on turnover, expect pricing pressure); 50% of comp listings sitting > 30 days — soft ceiling on asking rent; solid renter incomes; 427 units permitted in Napa County in 2024 (189 in 5+ unit buildings).
- This rent runs 34% of the median local income ($105k/yr) — at the standard rent-burdened threshold; future hikes will face affordability resistance.
Forward outlook
- Local home prices are declining (-3.0%/yr); year-one equity from $1k of loan paydown is wiped out by about $6k of value loss. Plan a longer hold.
- Napa County population projected at +14% by 2050 — modest demand growth; plan on rents tracking national, not racing it.
- At projected returns (-3.0% appreciation + 0.0% rent growth), your $56k cash investment doubles in ~8 years — after that, you're playing with house money.
Negotiation context
- It's been on market 49 days — a 3% lower offer ($194k) is reasonable based on typical stale-listing flexibility.
Risks & watch-outs
- Climate carrying-cost: major wildfire risk; extreme-heat days projected 7→15/yr by 2055 (HVAC capex compounding) — expect insurance premiums to compound above CPI over the hold.
Questions for the listing agent
- It's been on market 49 days. Have you received any prior offers? Is the seller open to a 3% concession, seller financing, or rate buy-down credit?
- Built in 1972 — when were the roof, HVAC, electrical panel, plumbing, and water heater last replaced?
- Is there a deadline driving the sale (1031 exchange, divorce, estate, relocation)? That informs how much negotiation room exists.
- What's the average days-on-market for RENTAL listings here right now (not sales)? A rising rental-DOM trend means longer vacancies and softer asking-rent achievability than the comps imply.
- What's the recent tenant-quality profile in this submarket — average credit score on applications, eviction rate, late-payment / NSF rate, and stable-employment percentage? A property-management company in the area should have these aggregated.
- How much new for-sale + rental construction is in the pipeline within 1–3 miles? Heavy new supply typically softens prices + rents 12–24 months out; constrained supply supports both.
Investment metrics
- 1% rule
- 1.48% ✓
- Cap rate
- 12.03%
- Cash-on-cash
- 20.48%
- DSCR
- 1.91
- GRM
- 5.6
CMA / ARV
- ARV (median comp)
- $137,232
- List price
- $199,999
- Delta
- 45.74%
- Verdict
- OVERPRICED
- Comps
- 2 within 1.0 mi
Show comp detail 1 sale within ~0.75 mi
| Address | Dist | Beds/Ba | Sqft | Sold | Price | $/sf | Match |
|---|---|---|---|---|---|---|---|
| 150 Silverado Trl #65 | 0.01mi | 2/2.0 | 684 (+2%) | 8mo | $70,000 | $102 | 89 |
Match score weights: distance 35% · size 25% · config 20% · recency 20%. Top-matched comps best support the ARV.
Projected returns pro-forma
-3.0% appreciation · 0.0% rent growth · sell at horizon
- IRR
- 9.3%
- Equity multiple
- 1.35×
- Total profit
- $19,841
- Equity at exit
- $29,821
- IRR
- 15.8%
- Equity multiple
- 2.11×
- Total profit
- $62,331
- Equity at exit
- $17,292
Cash invested: $56,000 (down + closing). Projections, not guarantees.
Landlord ↔ Tenant lean methodology
- Overall (STATE)
- 18 Strongly Tenant-Friendly
- State California
- 18 Strongly Tenant-Friendly · D+13
- County
- — inherits STATE
- City
- — inherits STATE
ZIP-level market 94559
- Rents YoY
- -2.7%
- Active inventory
- 145
- Price-to-rent
- 5.6×
Monthly cashflow live
- Estimated rent
- $2,959 medium interval (Pro) →
- Mortgage (P&I)
- −$1,049
- Tax est. 1.5%
- −$250 /mo · $3,000/yr
- Insurance
- −$83
- HOA
- −$0
- Vacancy / Maint / Mgmt
- −$621
- Net cashflow
- $956
Break-even live
UW: 25.0% down · 7.5% · 30yr · 1.5% tax · 5.0% vac · 8.0% maint · 8.0% mgmt
Financing live
Cash to close
- Down payment
- $50,000
- Closing costs
- $6,000
- Reserves months
- —
- Total cash needed
- —
Loan-product check · same deal, 3 products live
Conventional
25% down · 7.5% · 30yr
- Down + closing
- —
- Monthly P&I
- —
- Monthly cashflow
- —
- DSCR
- —
- Eligible?
- —
Personal DTI + credit; lowest rate.
DSCR
20% down · 8.5% · 30yr
- Down + closing
- —
- Monthly P&I
- —
- Monthly cashflow
- —
- DSCR
- —
- Eligible?
- —
No personal income docs; deal must DSCR.
Hard money
10% down · 12.0% · 12mo
- Down + closing
- —
- Monthly P&I
- —
- Monthly cashflow
- —
- DSCR
- —
- Eligible?
- —
Short-term bridge; refi at stabilization.
Rent comps 4 comps
| Address | Beds | Baths | Sqft | Rent | $/sqft | DOM | Units | Dist |
|---|---|---|---|---|---|---|---|---|
| 791 Vista Tulocay Ln Napa, CA | 1.0–3.0 | 1.0–2.0 | 1046 | $3,068 | $2.93 | 14d | 27 | 0.33mi |
| 2052 Wilkins Ave Napa, CA | 1.0–2.0 | 1.0 | 700 | $3,964 | $5.66 | 14d | 1 | 0.34mi |
| 511 Riverside Dr Unit RIV515 Napa, CA | 1.0 | 1.0 | 732 | $1,875 | $2.56 | 44d | 1 | 0.60mi |
| 2123 2nd St Napa, CA | 1.0 | 1.0 | 500 | $2,045 | $4.09 | 44d | 1 | 1.40mi |
Listing history 17 events
-
2026-06-18days on market $199,999 Active 49 DOM
-
2026-06-17days on market $199,999 Active 48 DOM
-
2026-06-16days on market $199,999 Active 47 DOM
-
2026-06-15days on market $199,999 Active 46 DOM
-
2026-06-14days on market $199,999 Active 44 DOM
-
2026-06-13days on market $199,999 Active 43 DOM
-
2026-06-10days on market $199,999 Active 41 DOM
-
2026-06-09days on market $199,999 Active 40 DOM
-
2026-06-08days on market $199,999 Active 39 DOM
-
2026-06-07days on market $199,999 Active 38 DOM
-
2026-06-05days on market $199,999 Active 35 DOM
-
2026-06-03days on market $199,999 Active 34 DOM
-
2026-06-02days on market $199,999 Active 33 DOM
-
2026-06-01days on market $199,999 Active 32 DOM
-
2026-05-31days on market $199,999 Active 31 DOM
-
2026-05-30days on market $199,999 Active 30 DOM
-
2026-04-30$199,999 Active 710-char remark
ⓘ Source: listings_history table (triggers on properties + properties_extension) + one-shot
backfill from property_details.listing_events for pre-trigger history.
Climate risk First Street
- Flood 1/10 Low FEMA zone X (unshaded) · 0% chance over 30 yrs
- Wildfire 6/10 Major
- Heat 5/10 Major 7 d/yr ≥95°F today · 15 d/yr by 30 yrs out
- Wind 1/10 Low
- Air quality 9/10 Extreme 16 unhealthy d/yr today · 17 by 30 yrs out
Nearby sold comps map
Loading sold comps map…
Walkable amenities ~0.75 mi
Loading nearby amenities…
Taxation est. · year 1
- Rental income
- $35,514
- − Mortgage interest
- −$11,203
- − Property taxes
- −$3,000
- − Insurance
- −$1,000
- − Repairs & maintenance
- −$2,841
- − Management
- −$2,841
- − Depreciation
- −$5,818
- Taxable income
- $8,810
- Est. tax owed @ 24.0%
- −$2,114
- After-tax cash flow
- $9,356/yr
For passive investors: Depreciation is non-cash, so a rental often shows a tax loss while cash-flowing — sheltering income. Rental losses are passive: they offset passive income freely, and up to $25,000/yr can offset ordinary (W-2) income if you actively participate and your MAGI is under $100k (phasing out to $0 by $150k); unused losses carry forward. On sale, claimed depreciation is recaptured at up to 25%, and gains may owe capital-gains tax (a 1031 exchange can defer both). Figures are a year-1 estimate at your 24.0% rate — not tax advice; consult a CPA.
Schools (NCES district)
- District
- Napa Valley Unified
- NCES district ID
- 0626640
- Math proficiency
- 35% ▲ 1.00%
- Reading proficiency
- 48% ▲ 2.00%
- Median HH income
- $72,007
- Composite
- 40.18/100
- National rank
- #7827
- State rank
- #599 of 1400 in CA
Livability — Napa
- Score
- 70/100
- State rank
- #227
- US rank
- #7435
Category grades
Schools grade is shown separately in the Schools card above.
Census & demographics
- Census place
- Napa, CA
- County
- Napa County · 120,669 people
- City population
- 91,371
- Metro
- Napa, CA
- Population (ZIP)
- 27,714
- Household income
- $105,188
- Rent vs Own
- Severe rent burden
- 1186.0
Population outlook (Napa County) Hauer SSP2
- Today (2025)
- 153,987 people
- By 2030
- 159,490 · +3.6%
- By 2040
- 168,796 · +9.6%
- By 2050
- 176,213 · +14.4%
- By 2075
- 190,113 · +23.5%
- By 2100
- 190,528 · +23.7%
Race, ethnicity, and origin ACS 2023
- Neighborhood character
- Diverse neighborhood (Simpson 0.57)
- Race & ethnicity
- White 51% Hispanic / Latino 41% Two or more races 13% Asian 3%
- Hispanic origin (detail)
- Mexican 39%
- Common ancestry
- Italian 7% Slovak 2% Lithuanian 2%
- Foreign-born
- 20% · Canada
- Languages at home
- 64% English-only · Spanish 32% Other Indo-European 1%
Political lean MEDSL · Napa
- 2024 margin
- Solid D (+34.9) · D 65.9% · R 31.1% · Other 3.0%
- 2008→2024 swing
- +2.4pp toward D · 2008: 32.5pp · 2024: 34.9pp
- All cycles
- 2024: D+34.9 2020: D+40.4 2016: D+35.2 2012: D+25.7 2008: D+32.5
Not yet ingested
- Civics
- —
Market trends
- HPI YoY
- ▼ -978.36%
- Current HPI
- 297.6522
- Rent YoY
- ▼ -2.70%
- Metro
- Napa, CA
- State GDP YoY
- ▲ 3.21%
- F500 in state
- 116
Industry mix (Fortune 500 HQ in CA)
| Industry | F500 HQs | Revenue |
|---|---|---|
| Technology | 27 | $1,492B |
|
||
| Financial Services | 3 | $174B |
|
||
| Retail | 3 | $44B |
|
||
| Insurance | 3 | $26B |
|
||
| Media / Entertainment | 2 | $115B |
|
||
| Pharmaceuticals / Biotech | 2 | $62B |
|
||
Price history
1 event — show timeline
- 2026-04-30 Listed $199,999 BAREIS
Property tax history
+9.7%/yrLatest (2025): $321 · +57.3% YoY. Source: county tax records.
Cash-flow waterfall
monthlySold comps — $/sqft
last 12 mo · ≤1 miLoading sold comps…