 Multi-family
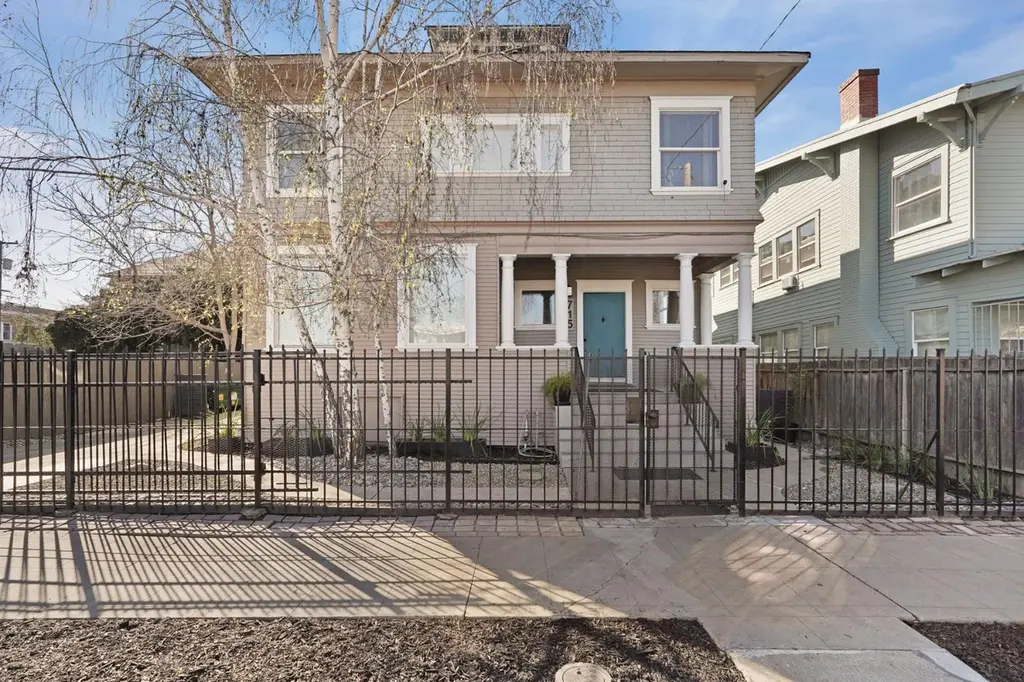
715 N Sutter St · Stockton, CA
Flood risk 5/10 · Moderate
- FEMA flood zone
- X
- Chance of flooding over 30 yrs
- 0.24%
- Est. flood insurance / yr
- $507 – $1,088
Fire risk 1/10 · Minimal
- Est. fire insurance / yr
- $659 – $1,223
Heat risk 7/10 · Major
- Hot days now (above 103°F)
- 7 days/yr
- Hot days in 30 yrs
- 15 days/yr
Wind risk 1/10 · Minimal
- Chance of severe wind over 30 yrs
- —
Air-quality risk 10/10 · Severe
- Unhealthy air days now
- 30 days/yr
- Unhealthy air days in 30 yrs
- 30 days/yr
Risk factors via First Street. Map © Google.
Why this score? — see what drove the C grade
The composite is a weighted blend of 9 inputs, each scored 0–100. Each bar is that input's sub-score; the figure is the points it added to the 100-point composite (weight × sub-score).
- Cash flow +21.2/30.0
- ARV discount +7.5/15.0
- DSCR +6.8/10.0
- Appreciation +5.4/10.0
- 1% rule +4.4/10.0
- Schools +2.9/10.0
- Livability +2.9/5.0
- Rent growth +2.5/5.0
- Condition / age +2.5/5.0
$549,000
🖨 Deal sheet 📄 Offer letter ✓ Due diligence
Multi-family units
County records classify this as Multi-Family (2-4 Unit). Listing-text estimate: 1 unit. estimate disagrees with records
Listing remarks
Are you looking for a turn key owner-occupant & /or Investment to maximize your returns? Don't miss out on this fantastic four-plex opportunity! The Traditional building sits on a raised foundation & features fresh paint, a low maintenance yard with automatic irrigation and rear uncovered parking access. The (4) 2 Bedroom units feature a recently renovated unit, two updated-move in ready units, and one long term tenant occupied unit. The interiors of each unit contain generously sized room with 9 foot ceilings, extra storage, large windows that that let in plenty of natural light + individual rear entrances and separate utility meters. Located steps away from Central Stockton's C
Key facts
- 5,001 sq ft lot
- 4 parking spots
- Built 1940
Property features AI
Finance
- Financial info: Four-unit income property (quadruplex)
- HOA & community: No association
Exterior
- Parking: Off-street parking
- Utilities: City utilities; Public water; Public sewer; Separate meters for electricity and gas; 220 volt electric service
- Home design: Residential income property (quadruplex apartments); Updated / remodeled condition; Built in 1940; Two stories; Entry on street level; Facing direction not specified
- Construction: Composition roof
- Exterior features: Fenced yard; Sidewalk; Landscaped front; Regular-shaped lot
Interior
- Kitchen: Free-standing gas range; Free-standing electric range; Free-standing refrigerator
- Bedrooms: Four units each with 2 bedrooms
- Flooring: Carpet; Tile; Wood
- Bathrooms: Each unit has 1 full bathroom
- Heating & cooling: Wall furnace heating; Ceiling fans; Wall air conditioning units; Window air conditioning units
- Interior features: Vaulted ceilings; Formal entry; Balcony/deck; Window coverings and screens; Unfinished basement
- Laundry & utility: Laundry area (other)
Neighborhood map
What this means for you Summary
Snapshot
- This is a 32-bed/16.0-bath multifamily listed at $549k.
Deal economics
- At list price, monthly cash flow is $792 ($10k/yr) — positive.
- The deal already cash-flows at list — no discount required.
- To meet the 1% rule (rent ≥ 1% of price), the offer needs to be $518k (5.6% below list).
- Recommended offer: $518k (5.6% below list) — sets the bar for 1% rule.
- Cap rate 8.0% vs local median 3.6% in Stockton — top-decile yield for the area; either an underpriced asset or a hidden risk that comps aren't pricing in. Stress-test before assuming the spread holds.
Location & tenants
- Location reads 57/100 on livability (#734 in CA) — a working-class tenant base; expect higher turnover. Strengths: housing A+, health & safety A, amenities A-; Watch: employment C-, schools D-, crime F.
- Stockton Unified (urban): math 23% / reading 46% proficiency, ranked #295 of 517 in CA (top 57%) — families likely to look elsewhere, expect single-tenant / working-renter base with shorter leases; 78% free/reduced lunch — lower-income household profile, screen leases tightly.
- Market conditions: 24 active listings in the ZIP; lower-income renter base — watch delinquency; 3,779 units permitted in San Joaquin County in 2024 (0 in 5+ unit buildings).
- At $5,185/mo this rent would consume 201% of the median local household income ($31k/yr) (locally 837% of renters already pay >50% of income on rent) — very limited rent-growth headroom before tenants either downsize or default.
Forward outlook
- In year one you build about $8k of equity ($4k loan paydown + $4k appreciation (0.7% local appreciation)).
- San Joaquin County population projected at +17% by 2050 — long-run rental-demand tailwind backs the buy-and-hold thesis.
- At projected returns (0.7% appreciation + 3.0% rent growth), your $154k cash investment doubles in ~7 years — after that, you're playing with house money.
- By year 5, paydown + projected appreciation supports a ~$37k cash-out refi (75% LTV) — recoverable capital for the next deal without selling this one.
Negotiation context
- It's been on market 18 days — a 2% lower offer ($541k) is reasonable based on typical stale-listing flexibility.
- Current owner paid $149k; list at $549k implies a 268% gain — meaningful room to come down on a strong offer.
Risks & watch-outs
- Watch-outs: built in 1940 — expect roof / HVAC / electrical / plumbing capex.
- Climate carrying-cost: moderate flood risk; extreme-heat days projected 7→15/yr by 2055 (HVAC capex compounding) — expect insurance premiums to compound above CPI over the hold.
Questions for the listing agent
- Built in 1940 — when were the roof, HVAC, electrical panel, plumbing, and water heater last replaced?
- Is there a deadline driving the sale (1031 exchange, divorce, estate, relocation)? That informs how much negotiation room exists.
- Schools are D-rated, which usually means shorter tenancies and higher turnover. Who's the typical renter profile here, and what's been the actual vacancy rate?
- Crime grade is F in this area — have there been break-ins, vandalism, or insurance claims at this property in the last 3 years? What carrier currently insures it and at what premium?
- What's the average days-on-market for RENTAL listings here right now (not sales)? A rising rental-DOM trend means longer vacancies and softer asking-rent achievability than the comps imply.
- What's the recent tenant-quality profile in this submarket — average credit score on applications, eviction rate, late-payment / NSF rate, and stable-employment percentage? A property-management company in the area should have these aggregated.
- How much new apartment / multifamily construction is in the pipeline within 1–3 miles? Heavy new supply (>2% of stock underway) typically softens rents 12–24 months out; light construction supports rent growth.
Investment metrics
- 1% rule
- 0.94% ✗
- Cap rate
- 8.02%
- Cash-on-cash
- 6.19%
- DSCR
- 1.28
- GRM
- 8.8
CMA / ARV
No comps found within radius.
Projected returns pro-forma
0.7% appreciation · 3.0% rent growth · sell at horizon
- IRR
- 6.9%
- Equity multiple
- 1.34×
- Total profit
- $52,604
- Equity at exit
- $179,012
- IRR
- 11.2%
- Equity multiple
- 2.32×
- Total profit
- $203,365
- Equity at exit
- $231,519
Cash invested: $153,720 (down + closing). Projections, not guarantees.
Landlord ↔ Tenant lean methodology
- Overall (STATE)
- 18 Strongly Tenant-Friendly
- State California
- 18 Strongly Tenant-Friendly · D+13
- County
- — inherits STATE
- City
- — inherits STATE
ZIP-level market 95202
- Home prices YoY
- 0.2%
- Active inventory
- 24
- Price-to-rent
- 35.3×
Monthly cashflow live
- Estimated rent
- $5,185 high interval (Pro) →
- Mortgage (P&I)
- −$2,879
- Tax from tax record
- −$196 /mo · $2,353/yr
- Insurance
- −$229
- HOA
- −$0
- Vacancy / Maint / Mgmt
- −$1,089
- Net cashflow
- $792
Break-even live
4-unit breakdown (identical units grouped — click to expand)
| Units | Beds | Baths | Est. rent |
|---|---|---|---|
| 4× units | 2 | 1 | $5,184 |
| #1 | 2 | 1 | $1,296 |
| #2 | 2 | 1 | $1,296 |
| #3 | 2 | 1 | $1,296 |
| #4 | 2 | 1 | $1,296 |
| Total (4 units) | $5,185 | ||
UW: 25.0% down · 7.5% · 30yr · 1.5% tax · 5.0% vac · 8.0% maint · 8.0% mgmt
Financing live
Cash to close
- Down payment
- $137,250
- Closing costs
- $16,470
- Reserves months
- —
- Total cash needed
- —
Loan-product check · same deal, 3 products live
Conventional
25% down · 7.5% · 30yr
- Down + closing
- —
- Monthly P&I
- —
- Monthly cashflow
- —
- DSCR
- —
- Eligible?
- —
Personal DTI + credit; lowest rate.
DSCR
20% down · 8.5% · 30yr
- Down + closing
- —
- Monthly P&I
- —
- Monthly cashflow
- —
- DSCR
- —
- Eligible?
- —
No personal income docs; deal must DSCR.
Hard money
10% down · 12.0% · 12mo
- Down + closing
- —
- Monthly P&I
- —
- Monthly cashflow
- —
- DSCR
- —
- Eligible?
- —
Short-term bridge; refi at stabilization.
Listing history 5 events
-
2013-05-02soldstatus $149,000
-
2011-08-24soldstatus $120,000
-
2001-05-04soldstatus $101,000
-
1994-07-05soldstatus $125,000
-
1984-05-31soldstatus $44,500
ⓘ Source: listings_history table (triggers on properties + properties_extension) + one-shot
backfill from property_details.listing_events for pre-trigger history.
Tax reassessment forecast CA · Resets to sale price
- Current annual tax
- $2,353 · $196/mo
- Projected year-2 tax
- $4,172 · $348/mo
- Expected delta
- +$1,820/yr (+$152/mo · 77.3%)
ⓘ Screening estimate from a state-policy table — verify with the county assessor before closing.
Climate risk First Street
- Flood 5/10 Major FEMA zone X · 24% chance over 30 yrs
- Wildfire 1/10 Low
- Heat 7/10 Severe 7 d/yr ≥103°F today · 15 d/yr by 30 yrs out
- Wind 1/10 Low
- Air quality 10/10 Extreme 30 unhealthy d/yr today · 30 by 30 yrs out
Nearby sold comps map
Loading sold comps map…
Walkable amenities ~0.75 mi
Loading nearby amenities…
Taxation est. · year 1
- Rental income
- $62,220
- − Mortgage interest
- −$30,753
- − Property taxes
- −$2,353
- − Insurance
- −$2,745
- − Repairs & maintenance
- −$4,978
- − Management
- −$4,978
- − Depreciation
- −$15,971
- Taxable income
- $444
- Est. tax owed @ 24.0%
- −$106
- After-tax cash flow
- $9,401/yr
For passive investors: Depreciation is non-cash, so a rental often shows a tax loss while cash-flowing — sheltering income. Rental losses are passive: they offset passive income freely, and up to $25,000/yr can offset ordinary (W-2) income if you actively participate and your MAGI is under $100k (phasing out to $0 by $150k); unused losses carry forward. On sale, claimed depreciation is recaptured at up to 25%, and gains may owe capital-gains tax (a 1031 exchange can defer both). Figures are a year-1 estimate at your 24.0% rate — not tax advice; consult a CPA.
Schools (NCES district)
- District
- Stockton Unified
- NCES district ID
- 0638010
- Math proficiency
- 23% ▲ 2.00%
- Reading proficiency
- 46% ▲ 16.00%
- Median HH income
- $37,563
- Composite
- 28.65/100
- National rank
- #6701
- State rank
- #295 of 517 in CA
Livability — Stockton
- Score
- 57/100
- State rank
- #734
- US rank
- #21638
Category grades
Schools grade is shown separately in the Schools card above.
Census & demographics
- Census place
- Stockton, CA
- County
- San Joaquin County · 729,570 people
- City population
- 332,006
- Metro
- Stockton, CA
- Population (ZIP)
- 7,066
- Household income
- $31,020
- Rent vs Own
- Severe rent burden
- 837.0
Population outlook (San Joaquin County) Hauer SSP2
- Today (2025)
- 796,965 people
- By 2030
- 828,849 · +4.0%
- By 2040
- 885,611 · +11.1%
- By 2050
- 929,798 · +16.7%
- By 2075
- 994,578 · +24.8%
- By 2100
- 971,291 · +21.9%
Race, ethnicity, and origin ACS 2023
- Neighborhood character
- Diverse neighborhood (Simpson 0.67)
- Race & ethnicity
- Hispanic / Latino 50% Black 23% Two or more races 21% White 14% Asian 6%
- Hispanic origin (detail)
- Mexican 39%
- Common ancestry
- Russian 2% Danish 1% Portuguese 1%
- Foreign-born
- 19% · Canada, China
- Languages at home
- 69% English-only · Spanish 27% Other Asian/Pacific 2% Tagalog/Filipino 1%
Political lean MEDSL · San Joaquin
- 2024 margin
- Toss-up / Even · D 48.0% · R 48.9% · Other 3.0%
- 2008→2024 swing
- -11.6pp toward R · 2008: 10.7pp · 2024: -0.9pp
- All cycles
- 2024: R+0.9 2020: D+13.9 2016: D+12.9 2012: D+8.9 2008: D+10.7
Not yet ingested
- Civics
- —
Market trends
- HPI YoY
- ▲ 0.70%
- Current HPI
- 315.9916
- Rent YoY
- —
- Metro
- Stockton, CA
- State GDP YoY
- ▲ 3.21%
- F500 in state
- 116
Industry mix (Fortune 500 HQ in CA)
| Industry | F500 HQs | Revenue |
|---|---|---|
| Technology | 27 | $1,492B |
|
||
| Financial Services | 3 | $174B |
|
||
| Retail | 3 | $44B |
|
||
| Insurance | 3 | $26B |
|
||
| Media / Entertainment | 2 | $115B |
|
||
| Pharmaceuticals / Biotech | 2 | $62B |
|
||
Price history
+234.8% since first listed5 events — show timeline
- 2013-05-02 Sold (Public Records) $149,000 Public Records
- 2011-08-24 Sold (Public Records) $120,000 Public Records
- 2001-05-04 Sold (Public Records) $101,000 Public Records
- 1994-07-05 Sold (Public Records) $125,000 Public Records
- 1984-05-31 Sold (Public Records) $44,500 Public Records
Property tax history
-3.5%/yrLatest (2025): $2,353 · +1.6% YoY. Source: county tax records.
Cash-flow waterfall
monthlySold comps — $/sqft
last 12 mo · ≤1 miLoading sold comps…