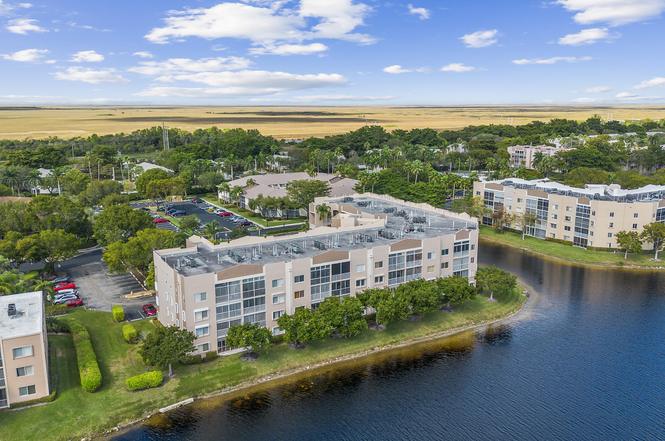
 🌊 Lakefront
7450 Trent Dr #302 · Tamarac, FL
Flood risk No data
- FEMA flood zone
- —
- Chance of flooding over 30 yrs
- —
- Est. flood insurance / yr
- —
Fire risk No data
- Est. fire insurance / yr
- —
Heat risk No data
- Hot days now (above threshold)
- —
- Hot days in 30 yrs
- —
Wind risk No data
- Chance of severe wind over 30 yrs
- —
Air-quality risk No data
- Unhealthy air days now
- —
- Unhealthy air days in 30 yrs
- —
Risk factors via First Street. Map © Google.
Why this score? — see what drove the C+ grade
The composite is a weighted blend of 9 inputs, each scored 0–100. Each bar is that input's sub-score; the figure is the points it added to the 100-point composite (weight × sub-score).
- Cash flow +26.1/30.0
- 1% rule +10.0/10.0
- DSCR +8.8/10.0
- ARV discount +7.5/15.0
- Schools +4.1/10.0
- Livability +3.8/5.0
- Condition / age +2.5/5.0
- Rent growth +2.0/5.0
- Appreciation +0.0/10.0
$99,900
🖨 Deal sheet 📄 Offer letter ✓ Due diligence
Listing remarks
THIS IS AN UNAPPROVED SHORTSALE. Great Deal
Key facts
- $556 HOA
- Community pool
- Built 1993
Neighborhood map
What this means for you Summary
Snapshot
- This is a 2-bed/2.0-bath condo listed at $100k.
Deal economics
- At list price, monthly cash flow is $251 ($3k/yr) — positive.
- The deal already cash-flows at list — no discount required.
- Meets the 1% rule at list price ($2k rent vs $100k).
- Recommended offer: $88k (12.0% below list) — sets the bar for market timing.
- Cap rate 9.3% vs local median 3.9% in Tamarac — top-decile yield for the area; either an underpriced asset or a hidden risk that comps aren't pricing in. Stress-test before assuming the spread holds.
Location & tenants
- Location reads 76/100 on livability (#239 in FL, #3,785 nationally) — a middle-class / working-renter tenant base. Strengths: housing A+, health & safety A+, cost of living A-; Watch: employment C-, amenities F, commute F.
- Broward (suburban): math 42% / reading 53% proficiency, ranked #46 of 73 in FL (top 63%) — families likely to look elsewhere, expect single-tenant / working-renter base with shorter leases.
- Market conditions: Rents soft (-1.9%/yr); 588 active listings in the ZIP; 40 comparable units currently listed for rent nearby; rentals at typical pace (median 24d on market — plan ~3-4 weeks tenant-placement turnaround); 2,111 units permitted in Broward County in 2024 (1,265 in 5+ unit buildings).
- This rent runs 43% of the median local income ($62k/yr) — at the standard rent-burdened threshold; future hikes will face affordability resistance.
Forward outlook
- Local home prices are declining (-3.0%/yr); year-one equity from $691 of loan paydown is wiped out by about $3k of value loss. Plan a longer hold.
- Broward County population projected at +34% by 2050 — long-run rental-demand tailwind backs the buy-and-hold thesis.
Negotiation context
- It's been on market 242 days — a 12% lower offer ($88k) is reasonable based on typical stale-listing flexibility.
- 6 sale attempts since 3y ago; this cycle's ask has dropped $20k (17%) from the opening price — seller is motivated, your offer sets the floor, not the list.
- Current owner paid $80k; 24% above their basis — modest negotiation headroom, anchor on the comps not their cost.
Risks & watch-outs
- Watch-outs: property tax is 4.6% of price; HOA is 25% of rent.
Questions for the listing agent
- It's been on market 242 days. Have you received any prior offers? Is the seller open to a 12% concession, seller financing, or rate buy-down credit?
- Property tax is high relative to price — has the assessment been appealed recently, and will the sale trigger a re-assessment?
- What does the HOA fee cover, when was the last increase, and are there any pending special assessments or reserve-fund shortfalls?
- Any open or pending special assessments — roof, HVAC, plumbing, elevator, façade? What's the per-unit balance and payoff schedule, and is the seller paying it off at close or rolling it to the buyer?
- Why hasn't it sold? Are there any deal-killer items the seller is aware of (foundation, flood, title, zoning, code violations)?
- Is there a deadline driving the sale (1031 exchange, divorce, estate, relocation)? That informs how much negotiation room exists.
- Schools are B-rated — typically a magnet for longer-tenancy family renters. What's the average tenant stay here, and is there a school-zone premium baked into asking?
- This sits on a lake — are riparian / water-frontage rights deeded with the parcel? Any dock permits, shoreline easements, or HOA water-use restrictions?
- What's the documented flood / surge / shoreline-erosion history here (FEMA AND non-FEMA — e.g., storm surge, creek backup, septic-field saturation)?
- Any water-quality or seasonal algae-bloom issues that affect tenant satisfaction or short-term-rental demand?
- What's the average days-on-market for RENTAL listings here right now (not sales)? A rising rental-DOM trend means longer vacancies and softer asking-rent achievability than the comps imply.
- What's the recent tenant-quality profile in this submarket — average credit score on applications, eviction rate, late-payment / NSF rate, and stable-employment percentage? A property-management company in the area should have these aggregated.
- How much new apartment / multifamily construction is in the pipeline within 1–3 miles? Heavy new supply (>2% of stock underway) typically softens rents 12–24 months out; light construction supports rent growth.
Investment metrics
- 1% rule
- 2.23% ✓
- Cap rate
- 9.31%
- Cash-on-cash
- 10.77%
- DSCR
- 1.48
- GRM
- 3.7
CMA / ARV
No comps found within radius.
Projected returns pro-forma
-3.0% appreciation · 0.0% rent growth · sell at horizon
- IRR
- -6.3%
- Equity multiple
- 0.78×
- Total profit
- $-6,189
- Equity at exit
- $14,895
- IRR
- -5.9%
- Equity multiple
- 0.72×
- Total profit
- $-7,833
- Equity at exit
- $8,638
Cash invested: $27,972 (down + closing). Projections, not guarantees.
Landlord ↔ Tenant lean methodology
- Overall (STATE)
- 87 Strongly Landlord-Friendly
- State Florida
- 87 Strongly Landlord-Friendly · R+3
- County
- — inherits STATE
- City
- — inherits STATE
ZIP-level market 33321
- Home prices YoY
- -30.4%
- Rents YoY
- -1.9%
- Active inventory
- 588
- Price-to-rent
- 3.7×
Monthly cashflow live
- Estimated rent
- $2,225 high interval (Pro) →
- Mortgage (P&I)
- −$524
- Tax from tax record
- −$385 /mo · $4,626/yr
- Insurance
- −$42
- HOA
- −$556
- Vacancy / Maint / Mgmt
- −$467
- Net cashflow
- $251
Break-even live
UW: 25.0% down · 7.5% · 30yr · 1.5% tax · 5.0% vac · 8.0% maint · 8.0% mgmt
Financing live
Cash to close
- Down payment
- $24,975
- Closing costs
- $2,997
- Reserves months
- —
- Total cash needed
- —
Loan-product check · same deal, 3 products live
Conventional
25% down · 7.5% · 30yr
- Down + closing
- —
- Monthly P&I
- —
- Monthly cashflow
- —
- DSCR
- —
- Eligible?
- —
Personal DTI + credit; lowest rate.
DSCR
20% down · 8.5% · 30yr
- Down + closing
- —
- Monthly P&I
- —
- Monthly cashflow
- —
- DSCR
- —
- Eligible?
- —
No personal income docs; deal must DSCR.
Hard money
10% down · 12.0% · 12mo
- Down + closing
- —
- Monthly P&I
- —
- Monthly cashflow
- —
- DSCR
- —
- Eligible?
- —
Short-term bridge; refi at stabilization.
Rent comps 40 comps
| Address | Beds | Baths | Sqft | Rent | $/sqft | DOM | Units | Dist |
|---|---|---|---|---|---|---|---|---|
| 7737 Trent Dr #204 Tamarac, FL | 2.0 | 2.0 | 1080 | $2,000 | $1.85 | 20d | 1 | 0.15mi |
| 7878 Trent Dr #308 Tamarac, FL | 2.0 | 2.0 | 1215 | $2,000 | $1.65 | 12d | 1 | 0.20mi |
| 7878 Trent Dr #308 Tamarac, FL | 2.0 | 2.0 | 1215 | $2,300 | $1.89 | 24d | 1 | 0.20mi |
| 7271 S Devon Dr #101 Tamarac, FL | 2.0 | 2.0 | 1187 | $2,200 | $1.85 | 22d | 1 | 0.33mi |
| 7214 S Devon Dr #211 Tamarac, FL | 2.0 | 2.0 | 1292 | $2,400 | $1.86 | 24d | 1 | 0.36mi |
| 10403 NW 80th Ct Unit 10403 Tamarac, FL | 1.0 | 1.0 | 1688 | $1,995 | $1.18 | 24d | 1 | 0.42mi |
| 8205 NW 106th Ave Tamarac, FL | 3.0 | 2.0 | 1587 | $3,500 | $2.21 | 5d | 1 | 0.49mi |
| 8320 Santa Monica Ave Unit 8320 Tamarac, FL | 3.0 | 2.5 | 1428 | $2,900 | $2.03 | 5d | 1 | 0.51mi |
| 10959 W Clairmont Cir #211 Tamarac, FL | 2.0 | 2.0 | 1163 | $2,100 | $1.81 | 24d | 1 | 0.52mi |
| 10426 E Clairmont Cir #212 Tamarac, FL | 2.0 | 2.0 | 1294 | $2,100 | $1.62 | 24d | 1 | 0.59mi |
| 8000 N Nob Hill Rd #206 Tamarac, FL | 2.0 | 2.0 | 981 | $2,000 | $2.04 | 5d | 1 | 0.61mi |
| 8000 N Nob Hill Rd #206 Tamarac, FL | 2.0 | 2.0 | 981 | $2,190 | $2.23 | 7d | 1 | 0.61mi |
| 8000 N Nob Hill Rd #106 Tamarac, FL | 2.0 | 2.0 | 981 | $2,000 | $2.04 | 4d | 1 | 0.61mi |
| 7940 N Nob Hill Rd #108 Tamarac, FL | 2.0 | 2.0 | 981 | $2,150 | $2.19 | 24d | 1 | 0.63mi |
| 10350 E Clairmont Cir #312 Tamarac, FL | 2.0 | 2.0 | 1294 | $2,300 | $1.78 | 24d | 1 | 0.64mi |
| 7970 N Nob Hill Rd Tamarac, FL | 3.0 | 2.0 | 1137 | $2,475 | $2.18 | 24d | 2 | 0.65mi |
| 7970 N Nob Hill Rd Tamarac, FL | 1.0–3.0 | 1.0–2.0 | 1137 | $2,195 | $1.93 | 20d | 2 | 0.65mi |
| 10000 S Nob Hill Cir #10163 Tamarac, FL | 2.0 | 1.0 | 900 | $1,767 | $1.96 | 3d | 1 | 0.65mi |
| 7950 N Nob Hill Rd #203 Tamarac, FL | 3.0 | 2.0 | 981 | $2,700 | $2.75 | 24d | 1 | 0.66mi |
| 8020 N Nob Hill Rd Tamarac, FL | 1.0–2.0 | 1.0–2.0 | 981 | $2,180 | $2.22 | 15d | 3 | 0.66mi |
| 8030 N Nob Hill Rd #105 Tamarac, FL | 2.0 | 2.0 | 981 | $2,100 | $2.14 | 24d | 1 | 0.67mi |
| 7980 N Nob Hill Rd #205 Tamarac, FL | 2.0 | 2.0 | 981 | $2,050 | $2.09 | 24d | 1 | 0.69mi |
| 7980 N Nob Hill Rd Tamarac, FL | 1.0–2.0 | 1.0–2.0 | 836 | $2,050 | $2.45 | 16d | 2 | 0.70mi |
| 7755 Yardley Dr #112 Fort Lauderdale, FL | 2.0 | 2.0 | 1229 | $2,400 | $1.95 | 24d | 1 | 0.71mi |
| 8060 N Nob Hill Rd #203 Tamarac, FL | 2.0 | 2.0 | 981 | $2,200 | $2.24 | 24d | 1 | 0.71mi |
| 8070 N Nob Hill Rd #205 Tamarac, FL | 2.0 | 2.0 | 981 | $1,990 | $2.03 | 24d | 1 | 0.71mi |
| 7765 Yardley Dr #107 Fort Lauderdale, FL | 2.0 | 2.0 | 1469 | $2,200 | $1.50 | 12d | 1 | 0.73mi |
| 10881 Sea Hibiscus Ln Tamarac, FL | 3.0 | 2.5 | 1627 | $3,350 | $2.06 | 24d | 1 | 0.74mi |
| 8090 NW 96th Ter Tamarac, FL | 1.0–3.0 | 1.0–2.0 | 1154 | $2,498 | $2.16 | 2d | 19 | 0.81mi |
| 9909 Westwood Dr Unit 23-1 Tamarac, FL | 2.0 | 1.0 | 939 | $1,870 | $1.99 | 5d | 1 | 0.83mi |
| 9909 Westwood Dr Unit 23-1 Tamarac, FL | 2.0 | 1.0 | 939 | $1,880 | $2.00 | 24d | 1 | 0.83mi |
| 8108 Prestige Commons Dr Tamarac, FL | 3.0 | 2.5 | 1478 | $3,200 | $2.17 | 24d | 1 | 0.84mi |
| 9907 Westwood Dr Unit 24-2 Tamarac, FL | 2.0 | 1.0 | 939 | $2,000 | $2.13 | 24d | 1 | 0.86mi |
| 9511 Weldon Cir Unit 412 Tamarac, FL | 2.0 | 2.0 | 1080 | $1,875 | $1.74 | 7d | 1 | 0.86mi |
| 9511 Weldon Cir Tamarac, FL | 2.0 | 2.0 | 1116 | $1,850 | $1.66 | 24d | 2 | 0.87mi |
| 9485 N Belfort Cir #308 Tamarac, FL | 2.0 | 2.0 | 1228 | $2,100 | $1.71 | 14d | 1 | 0.93mi |
| 9560 Weldon Cir Unit J308 Fort Lauderdale, FL | 2.0 | 1.5 | 981 | $1,900 | $1.94 | 2d | 1 | 0.95mi |
| 9560 Weldon Cir Unit J308 Fort Lauderdale, FL | 2.0 | 1.5 | 981 | $1,900 | $1.94 | 24d | 1 | 0.95mi |
| 555 Lakeview Dr Coral Springs, FL | 2.0–3.0 | 2.0 | 1255 | $2,272 | $1.81 | 2d | 14 | 0.97mi |
| 7670 Westwood Dr #703 Tamarac, FL | 2.0 | 2.0 | 984 | $1,850 | $1.88 | 24d | 1 | 1.00mi |
HOA detail condo
- Monthly dues
- $556 · $6,672/yr
- Assessments
- None detected in remarks — confirm with the listing agent.
Listing history 23 events
-
2026-04-05status Pending
-
2026-01-30price $99,900
-
2026-01-08status Active
-
2026-01-02historical
-
2025-10-10price $110,000
-
2025-07-30historical
-
2025-07-30$119,900 Active
-
2025-05-13historical Active Under Contract
-
2025-04-16price $129,900
-
2025-03-27price $149,900
-
2025-02-28price $160,000
-
2025-02-10$175,000 Active
-
2025-01-20historical
-
2024-01-11status Active
-
2024-01-11price $199,500
-
2023-12-20historical Active Under Contract
-
2023-11-30price $145,000
-
2023-11-30price $150,000
-
2023-07-25status Active
-
2023-07-25price $250,000
-
2023-07-02historical Active Under Contract
-
2023-06-16$200,000 Active
-
1993-11-01soldstatus $80,500
ⓘ Source: listings_history table (triggers on properties + properties_extension) + one-shot
backfill from property_details.listing_events for pre-trigger history.
Tax reassessment forecast FL · Resets to sale price
- Current annual tax
- $4,626 · $385/mo
- Projected year-2 tax
- $4,626 · $385/mo
- Expected delta
- $0/yr ($0/mo · 0.0%)
ⓘ Screening estimate from a state-policy table — verify with the county assessor before closing.
Nearby sold comps map
Loading sold comps map…
Walkable amenities ~0.75 mi
Loading nearby amenities…
Taxation est. · year 1
- Rental income
- $26,703
- − Mortgage interest
- −$5,596
- − Property taxes
- −$4,626
- − Insurance
- −$500
- − Repairs & maintenance
- −$2,136
- − Management
- −$2,136
- − HOA
- −$6,672
- − Depreciation
- −$2,906
- Taxable income
- $2,131
- Est. tax owed @ 24.0%
- −$512
- After-tax cash flow
- $2,500/yr
For passive investors: Depreciation is non-cash, so a rental often shows a tax loss while cash-flowing — sheltering income. Rental losses are passive: they offset passive income freely, and up to $25,000/yr can offset ordinary (W-2) income if you actively participate and your MAGI is under $100k (phasing out to $0 by $150k); unused losses carry forward. On sale, claimed depreciation is recaptured at up to 25%, and gains may owe capital-gains tax (a 1031 exchange can defer both). Figures are a year-1 estimate at your 24.0% rate — not tax advice; consult a CPA.
Schools (NCES district)
- District
- Broward
- NCES district ID
- 1200180
- Math proficiency
- 42% ▼ -18.00%
- Reading proficiency
- 53% ▼ -5.00%
- Median HH income
- $52,139
- Composite
- 40.88/100
- National rank
- #3621
- State rank
- #46 of 73 in FL
Livability — Tamarac
- Score
- 76/100
- State rank
- #239
- US rank
- #3785
Category grades
Schools grade is shown separately in the Schools card above.
Census & demographics
- Census place
- Tamarac, FL
- County
- Broward County · 1,963,430 people
- City population
- 105,666
- Metro
- Miami-Fort Lauderdale-Pompano Beach, FL
- Population (ZIP)
- 51,216
- Household income
- $62,066
- Rent vs Own
- Severe rent burden
- 1394.0
Population outlook (Broward County) Hauer SSP2
- Today (2025)
- 2,207,033 people
- By 2030
- 2,360,704 · +7.0%
- By 2040
- 2,661,208 · +20.6%
- By 2050
- 2,946,698 · +33.5%
- By 2075
- 3,602,273 · +63.2%
- By 2100
- 3,970,984 · +79.9%
Race, ethnicity, and origin ACS 2023
- Neighborhood character
- Highly diverse neighborhood (Simpson 0.70)
- Race & ethnicity
- Hispanic / Latino 34% White 33% Black 27% Two or more races 20% Asian 3%
- Hispanic origin (detail)
- Mexican 2% Puerto Rican 5% Cuban 5% Dominican 3%
- Common ancestry
- Romanian 3% Hispanic 3% Scotch-Irish 2%
- Foreign-born
- 38% · Canada, Jamaica, Dominican Republic
- Languages at home
- 63% English-only · Spanish 29% French/Haitian/Cajun 4% Other Indo-European 1%
Political lean MEDSL · Broward
- 2024 margin
- D (+17.0) · D 58.0% · R 41.0%
- 2008→2024 swing
- -17.8pp toward R · 2008: 34.7pp · 2024: 17.0pp
- All cycles
- 2024: D+17.0 2020: D+29.8 2016: D+35.0 2012: D+34.9 2008: D+34.7
Not yet ingested
- Civics
- —
Market trends
- HPI YoY
- ▼ -158.63%
- Current HPI
- 362.2989
- Rent YoY
- ▼ -1.86%
- Metro
- Miami-Fort Lauderdale-Pompano Beach, FL
- State GDP YoY
- ▲ 3.28%
- F500 in state
- 36
Industry mix (Fortune 500 HQ in FL)
| Industry | F500 HQs | Revenue |
|---|---|---|
| Industrial Technology | 2 | $29B |
|
||
| Insurance | 2 | $17B |
|
||
| Retail | 1 | $60B |
|
||
| Technology Distribution | 1 | $58B |
|
||
| Homebuilding | 1 | $35B |
|
||
| Technology Manufacturing | 1 | $35B |
|
||
Price history
+24.1% since first listed23 events — show timeline
- 2026-04-05 Pending — Beaches MLS
- 2026-01-30 Price Changed $99,900 Beaches MLS
- 2026-01-08 Relisted — Beaches MLS
- 2026-01-02 Listing Removed — Beaches MLS
- 2025-10-10 Price Changed $110,000 Beaches MLS
- 2025-07-30 Listing Removed — Beaches MLS
- 2025-07-30 Listed $119,900 Beaches MLS
- 2025-05-13 Contingent — Beaches MLS
- 2025-04-16 Price Changed $129,900 Beaches MLS
- 2025-03-27 Price Changed $149,900 Beaches MLS
- 2025-02-28 Price Changed $160,000 Beaches MLS
- 2025-02-10 Listed $175,000 Beaches MLS
- 2025-01-20 Listing Removed — MARMLS
- 2024-01-11 Relisted — MARMLS
- 2024-01-11 Price Changed $199,500 MARMLS
- 2023-12-20 Contingent — MARMLS
- 2023-11-30 Price Changed $145,000 MARMLS
- 2023-11-30 Price Changed $150,000 MARMLS
- 2023-07-25 Relisted — MARMLS
- 2023-07-25 Price Changed $250,000 MARMLS
- 2023-07-02 Contingent — MARMLS
- 2023-06-16 Listed $200,000 MARMLS
- 1993-11-01 Sold (Public Records) $80,500 Public Records
Property tax history
+17.1%/yrLatest (2025): $4,626 · -5.9% YoY. Source: county tax records.
Cash-flow waterfall
monthlySold comps — $/sqft
last 12 mo · ≤1 miLoading sold comps…