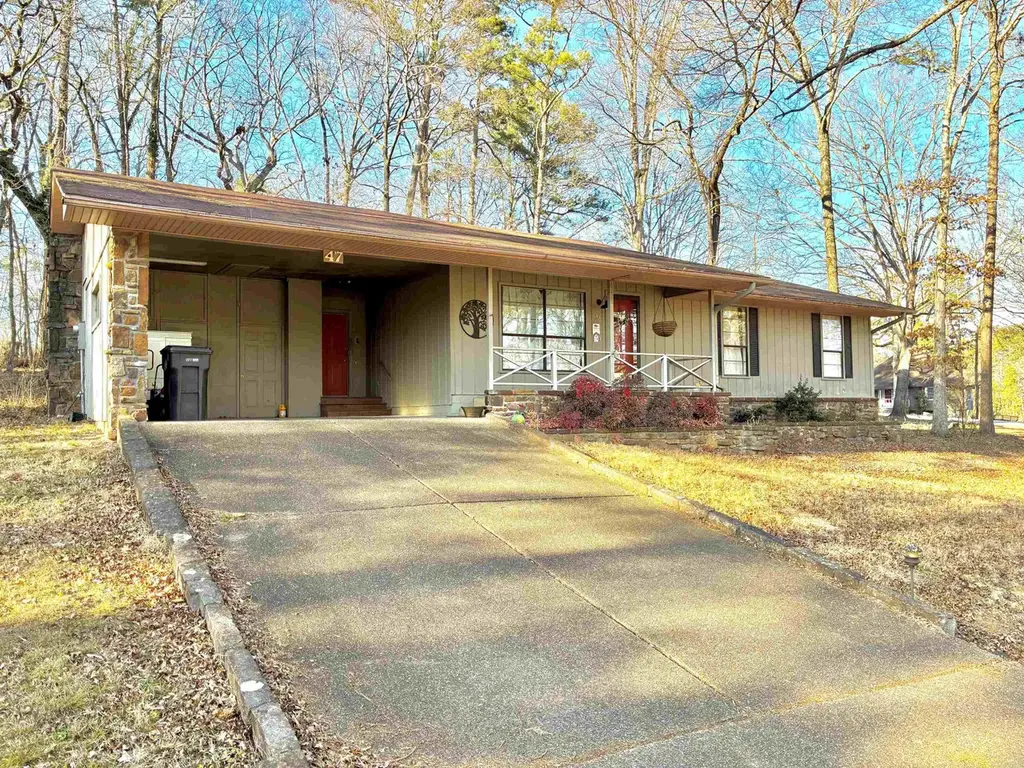
47 Malaga Way · Hot Springs Village, AR
Flood risk 1/10 · Minimal
- FEMA flood zone
- X (unshaded)
- Chance of flooding over 30 yrs
- 0.0%
- Est. flood insurance / yr
- $507 – $1,088
Fire risk 4/10 · Minor
- Est. fire insurance / yr
- $1,499 – $2,785
Heat risk 5/10 · Moderate
- Hot days now (above 111°F)
- 7 days/yr
- Hot days in 30 yrs
- 19 days/yr
Wind risk 4/10 · Minor
- Chance of severe wind over 30 yrs
- 9.0%
Air-quality risk 1/10 · Minimal
- Unhealthy air days now
- 0 days/yr
- Unhealthy air days in 30 yrs
- 0 days/yr
Risk factors via First Street. Map © Google.
Why this score? — see what drove the D grade
The composite is a weighted blend of 9 inputs, each scored 0–100. Each bar is that input's sub-score; the figure is the points it added to the 100-point composite (weight × sub-score).
- Cash flow +12.2/30.0
- ARV discount +11.6/15.0
- DSCR +3.6/10.0
- Schools +3.5/10.0
- Livability +3.5/5.0
- 1% rule +3.3/10.0
- Rent growth +2.5/5.0
- Condition / age +2.5/5.0
- Appreciation +0.0/10.0
$199,970
🖨 Deal sheet (PDF) 📄 Offer letter ✓ Due diligence
Listing remarks MLS
Cozy Hot Springs Village home featuring a rustic look in a quiet neighborhood setting. Features a fenced backyard with a deck for relaxing or entertaining friends and family. This place feels like home the minute you walk through the door. Roof last replaced in 2017 and HVAC system replaced in 2014.
Key facts
- Deck
- Rustic look
- Quiet neighborhood
Tags
Neighborhood map
What this means for you Summary
Snapshot
- This is a 3-bed/2.0-bath single-family listed at $200k.
Deal economics
- At list price, monthly cash flow is $-41 ($-490/yr) — negative.
- To cash-flow at today's rent, offer at most $193k (3.6% below list).
- To meet the 1% rule (rent ≥ 1% of price), the offer needs to be $166k (16.9% below list).
- Recommended offer: $166k (16.9% below list) — sets the bar for 1% rule.
- Cap rate 6.0% vs local median 3.6% in Hot Springs Village — top-decile yield for the area; either an underpriced asset or a hidden risk that comps aren't pricing in. Stress-test before assuming the spread holds.
Location & tenants
- Location reads 69/100 on livability (#76 in AR) — a middle-class / working-renter tenant base. Strengths: crime A+, housing A+, cost of living A; Watch: amenities F, commute F, health & safety F.
- Jessieville School District (rural): math 40% / reading 43% proficiency, ranked #60 of 238 in AR (top 25%) — families likely to look elsewhere, expect single-tenant / working-renter base with shorter leases; 70% free/reduced lunch — lower-income household profile, screen leases tightly.
- Zoned schools: Jessieville Elementary School (math 57% / reading 42%, grade D, #93 of 454 statewide, top 23%, 368 students, 99% FRL); Jessieville Middle School (math 38% / reading 48%, grade D-, #70 of 201 statewide, top 38%, 205 students, 98% FRL); Jessieville High School (math 17% / reading 37%, grade F, #164 of 292 statewide, top 61%, 273 students, 99% FRL) — zoned schools average 99% FRL vs 70% district-wide (29 pts higher); higher-poverty schools than district average — tighter screening recommended.
- Market conditions: 770 active listings in the ZIP; 7 comparable units currently listed for rent nearby; rentals at typical pace (median 16d on market — plan ~3-4 weeks tenant-placement turnaround); solid renter incomes; 117 units permitted in Garland County in 2024 (24 in 5+ unit buildings).
Forward outlook
- Local home prices are declining (-3.0%/yr); year-one equity from $1k of loan paydown is wiped out by about $6k of value loss. Plan a longer hold.
- Garland County population projected at +7% by 2050 — modest demand growth; plan on rents tracking national, not racing it.
Negotiation context
- It's been on market 168 days — a 12% lower offer ($176k) is reasonable based on typical stale-listing flexibility.
- 5 sale attempts since 6y ago; this cycle's ask has dropped $25k (11%) from the opening price — seller is motivated, your offer sets the floor, not the list.
- Current owner paid $118k; list at $200k implies a 70% gain — meaningful room to come down on a strong offer.
Risks & watch-outs
- Climate carrying-cost: extreme-heat days projected 7→19/yr by 2055 (HVAC capex compounding) — expect insurance premiums to compound above CPI over the hold.
Questions for the listing agent
- What do current leases actually rent for vs. the listed asking? Can we see a recent rent roll and the last 12 months of T-12 income?
- It's been on market 168 days. Have you received any prior offers? Is the seller open to a 17% concession, seller financing, or rate buy-down credit?
- Built in 1974 — when were the roof, HVAC, electrical panel, plumbing, and water heater last replaced?
- What does the HOA fee cover, when was the last increase, and are there any pending special assessments or reserve-fund shortfalls?
- Why hasn't it sold? Are there any deal-killer items the seller is aware of (foundation, flood, title, zoning, code violations)?
- Is there a deadline driving the sale (1031 exchange, divorce, estate, relocation)? That informs how much negotiation room exists.
- Schools are D-rated, which usually means shorter tenancies and higher turnover. Who's the typical renter profile here, and what's been the actual vacancy rate?
- The area grade is low — what's the realistic commute time and amenity access for the typical tenant pool here? Any planned neighborhood developments (good or bad) we should know about?
- What's the average days-on-market for RENTAL listings here right now (not sales)? A rising rental-DOM trend means longer vacancies and softer asking-rent achievability than the comps imply.
- What's the recent tenant-quality profile in this submarket — average credit score on applications, eviction rate, late-payment / NSF rate, and stable-employment percentage? A property-management company in the area should have these aggregated.
- How much new for-sale + rental construction is in the pipeline within 1–3 miles? Heavy new supply typically softens prices + rents 12–24 months out; constrained supply supports both.
Investment metrics
- 1% rule
- 0.83% ✗
- Cap rate
- 6.05%
- Cash-on-cash
- -0.87%
- DSCR
- 0.96
- GRM
- 10.0
CMA / ARV
- ARV (median comp)
- $219,839
- List price
- $199,970
- Delta
- -9.04%
- Verdict
- FAIR
- Comps
- 20 within 1.0 mi
Show comp detail 12 sales within ~0.75 mi
| Address | Dist | Beds/Ba | Sqft | Sold | Price | $/sf | Match |
|---|---|---|---|---|---|---|---|
| 17 La Canada Ln | 0.23mi | 3/2.0 | 1,524 (-2%) | 1mo | $275,000 | $180 | 86 |
| 85 Malaga Way | 0.22mi | 3/2.0 | 1,530 (-1%) | 11mo | $222,000 | $145 | 79 |
| 75 Malaga Way | 0.23mi | 2/2.0 (-1) | 1,620 (+5%) | 5mo | $223,000 | $138 | 72 |
| 1 Bahia Ln | 0.17mi | 3/2.0 | 1,726 (+12%) | 6mo | $220,000 | $127 | 68 |
| 1 Badalona Cir | 0.42mi | 3/2.5 | 1,584 (+2%) | 10mo | $160,000 | $101 | 66 |
| 22 Vilafranca Ln | 0.41mi | 2/2.0 (-1) | 1,497 (-3%) | 7mo | $255,000 | $170 | 65 |
| 4 Bejar Ln | 0.45mi | 3/2.0 | 1,460 (-6%) | 9mo | $195,000 | $134 | 62 |
| 31 Barcelona Ln | 0.64mi | 3/2.0 | 1,600 (+3%) | 9mo | $250,000 | $156 | 57 |
| 30 Segovia Dr | 0.42mi | 3/2.0 | 1,408 (-9%) | 11mo | $235,000 | $167 | 56 |
| 29 Salobrena Way | 0.68mi | 2/2.0 (-1) | 1,662 (+7%) | 5mo | $157,000 | $94 | 47 |
| 8 Larraga Way | 0.65mi | 2/2.0 (-1) | 1,460 (-6%) | 10mo | $224,500 | $154 | 47 |
| 6 Las Navas Ln | 0.71mi | 3/2.0 | 1,766 (+14%) | 9mo | $165,000 | $93 | 36 |
Match score weights: distance 35% · size 25% · config 20% · recency 20%. Top-matched comps best support the ARV.
Projected returns pro-forma
-3.0% appreciation · 3.0% rent growth · sell at horizon
- IRR
- -17.7%
- Equity multiple
- 0.37×
- Total profit
- $-34,997
- Equity at exit
- $29,816
- IRR
- -9.9%
- Equity multiple
- 0.40×
- Total profit
- $-33,793
- Equity at exit
- $17,290
Cash invested: $55,992 (down + closing). Projections, not guarantees.
Landlord ↔ Tenant lean methodology
- Overall (STATE)
- 92 Strongly Landlord-Friendly
- State Arkansas
- 92 Strongly Landlord-Friendly · R+14
- County
- — inherits STATE
- City
- — inherits STATE
ZIP-level market 71909
- Home prices YoY
- -10.9%
- Active inventory
- 770
- Price-to-rent
- 10.0×
Monthly cashflow live
- Estimated rent
- $1,661 high interval (Pro) →
- Mortgage (P&I)
- −$1,049
- Tax from tax record
- −$103 /mo · $1,236/yr
- Insurance
- −$83
- HOA
- −$118
- Vacancy / Maint / Mgmt
- −$349
- Net cashflow
- $-41
Break-even live
Sensitivity live
| Price | -10% $72 | -5% $16 | +0% $-41 | +5% $-97 | +10% $-154 |
|---|---|---|---|---|---|
| Rent | -10% $-172 | -5% $-106 | +0% $-41 | +5% $25 | +10% $90 |
| Rate | -1.0pp $60 | -0.5pp $10 | base $-41 | +0.5pp $-93 | +1.0pp $-145 |
UW: 25.0% down · 7.5% · 30yr · 1.5% tax · 5.0% vac · 8.0% maint · 8.0% mgmt
Financing live
Cash to close
- Down payment
- $49,992
- Closing costs
- $5,999
- Reserves months
- —
- Total cash needed
- —
Loan-product check · same deal, 3 products live
Conventional
25% down · 7.5% · 30yr
- Down + closing
- —
- Monthly P&I
- —
- Monthly cashflow
- —
- DSCR
- —
- Eligible?
- —
Personal DTI + credit; lowest rate.
DSCR
20% down · 8.5% · 30yr
- Down + closing
- —
- Monthly P&I
- —
- Monthly cashflow
- —
- DSCR
- —
- Eligible?
- —
No personal income docs; deal must DSCR.
Hard money
10% down · 12.0% · 12mo
- Down + closing
- —
- Monthly P&I
- —
- Monthly cashflow
- —
- DSCR
- —
- Eligible?
- —
Short-term bridge; refi at stabilization.
Rent comps 7 comps
| Address | Beds | Baths | Sqft | Rent | $/sqft | DOM | Units | Dist |
|---|---|---|---|---|---|---|---|---|
| 16 Malaga Cir Hot Springs Village, AR | 2.0 | 2.0 | 1694 | $1,850 | $1.09 | 16d | 1 | 0.28mi |
| 120 Emperado Way Hot Springs Village, AR | 3.0 | 1.5 | 1296 | $1,300 | $1.00 | 25d | 1 | 0.78mi |
| 10 Frontera Cir Hot Springs Village, AR | 3.0 | 2.0 | 1738 | $1,385 | $0.80 | 16d | 1 | 0.84mi |
| 6 Tomino Way Hot Springs Village, AR | 3.0 | 1.5 | 1549 | $1,350 | $0.87 | 16d | 1 | 0.84mi |
| 29 Frontera Cir Hot Springs Village, AR | 2.0 | 2.0 | 1179 | $1,600 | $1.36 | 25d | 1 | 0.87mi |
| 2 Dulzura Ln Hot Springs Village, AR | 2.0 | 1.5 | 1120 | $1,200 | $1.07 | 46d | 1 | 0.94mi |
| 16 Dulzura Ln Unit 1 Hot Springs, AR | 2.0 | 1.5 | 1120 | $1,100 | $0.98 | 16d | 1 | 0.99mi |
HOA detail
- Monthly dues
- $118 · $1,416/yr
Listing history 34 events
-
2026-06-21days on market $199,970 Active 168 DOM
-
2026-06-18days on market $199,970 Active 165 DOM
-
2026-06-17days on market $199,970 Active 164 DOM
-
2026-06-16days on market $199,970 Active 163 DOM
-
2026-06-15days on market $199,970 Active 162 DOM
-
2026-06-14days on market $199,970 Active 160 DOM
-
2026-06-10days on market $199,970 Active 157 DOM
-
2026-06-09days on market $199,970 Active 156 DOM
-
2026-06-08days on market $199,970 Active 155 DOM
-
2026-06-07days on market $199,970 Active 154 DOM
-
2026-06-05days on market $199,970 Active 151 DOM
-
2026-06-03days on market $199,970 Active 150 DOM
-
2026-06-02days on market $199,970 Active 149 DOM
-
2026-06-01days on market $199,970 Active 148 DOM
-
2026-05-31days on market $199,970 Active 147 DOM
-
2026-05-31days on market $199,970 Active 146 DOM
-
2026-05-05price $199,970 300-char remark
Show marketing remark (300 chars)
Cozy Hot Springs Village home featuring a rustic look in a quiet neighborhood setting. Features a fenced backyard with a deck for relaxing or entertaining friends and family. This place feels like home the minute you walk through the door. Roof last replaced in 2017 and HVAC system replaced in 2014.
-
2026-03-26price $209,000 300-char remark
Show marketing remark (300 chars)
Cozy Hot Springs Village home featuring a rustic look in a quiet neighborhood setting. Features a fenced backyard with a deck for relaxing or entertaining friends and family. This place feels like home the minute you walk through the door. Roof last replaced in 2017 and HVAC system replaced in 2014.
-
2026-01-04$225,000 New Listing 300-char remark
Show marketing remark (300 chars)
Cozy Hot Springs Village home featuring a rustic look in a quiet neighborhood setting. Features a fenced backyard with a deck for relaxing or entertaining friends and family. This place feels like home the minute you walk through the door. Roof last replaced in 2017 and HVAC system replaced in 2014.
-
2022-04-20soldstatus $117,500
-
2020-10-02soldstatus $81,225
-
2020-09-30soldstatus $81,225 223-char remark
Show marketing remark (223 chars)
Nice 2 BR 2 Bath home in area of like homes. It features a large deck, dining room, large kitchen and family room with a fireplace. It is located in a gated community of golfing, lakes, trails, swimming pool and Club House.
-
2020-09-04soldstatus $81,225 Sold
-
2020-07-23status Under Contract
-
2020-07-17status Back on Market
-
2020-07-08status Under Contract
-
2020-06-05status Back on Market
-
2020-06-05historical
-
2020-05-03status Under Contract
-
2020-05-02price $81,225
-
2020-04-08price $85,500
-
2020-01-02$81,225 223-char remark
Show marketing remark (223 chars)
Nice 2 BR 2 Bath home in area of like homes. It features a large deck, dining room, large kitchen and family room with a fireplace. It is located in a gated community of golfing, lakes, trails, swimming pool and Club House.
-
2020-01-01$92,000 New Listing
-
1999-05-11soldstatus $74,000
ⓘ Source: listings_history table (triggers on properties + properties_extension) + one-shot
backfill from property_details.listing_events for pre-trigger history.
Tax reassessment forecast AR · Resets to sale price
- Current annual tax
- $1,236 · $103/mo
- Projected year-2 tax
- $1,280 · $107/mo
- Expected delta
- +$44/yr (+$4/mo · 3.5%)
ⓘ Screening estimate from a state-policy table — verify with the county assessor before closing.
Climate risk First Street
- Flood 1/10 Low FEMA zone X (unshaded) · 0% chance over 30 yrs
- Wildfire 4/10 Moderate
- Heat 5/10 Major 7 d/yr ≥111°F today · 19 d/yr by 30 yrs out
- Wind 4/10 Moderate 9% chance of damaging wind over 30 yrs
- Air quality 1/10 Low 0 unhealthy d/yr today · 0 by 30 yrs out
Nearby sold comps map
Loading sold comps map…
Walkable amenities ~0.75 mi
Loading nearby amenities…
Taxation est. · year 1
- Rental income
- $19,932
- − Mortgage interest
- −$11,201
- − Property taxes
- −$1,236
- − Insurance
- −$1,000
- − Repairs & maintenance
- −$1,595
- − Management
- −$1,595
- − HOA
- −$1,416
- − Depreciation
- −$5,817
- Taxable loss
- −$3,928
- Est. tax savings @ 24.0%
- +$943
- After-tax cash flow
- $453/yr
For passive investors: Depreciation is non-cash, so a rental often shows a tax loss while cash-flowing — sheltering income. Rental losses are passive: they offset passive income freely, and up to $25,000/yr can offset ordinary (W-2) income if you actively participate and your MAGI is under $100k (phasing out to $0 by $150k); unused losses carry forward. On sale, claimed depreciation is recaptured at up to 25%, and gains may owe capital-gains tax (a 1031 exchange can defer both). Figures are a year-1 estimate at your 24.0% rate — not tax advice; consult a CPA.
Schools (NCES district)
- District
- Jessieville School District
- NCES district ID
- 0507920
- Math proficiency
- 40% ▼ -6.00%
- Reading proficiency
- 43% ▼ -4.00%
- Median HH income
- $44,066
- Composite
- 35.16/100
- National rank
- #5003
- State rank
- #60 of 238 in AR
Livability — Hot Springs Village
- Score
- 69/100
- State rank
- #76
- US rank
- #8970
Category grades
Schools grade is shown separately in the Schools card above.
Census & demographics
- Census place
- Hot Springs Village, AR
- County
- Saline County · 77,216 people
- City population
- 18,449
- Metro
- Little Rock-North Little Rock-Conway, AR
- Population (ZIP)
- 18,449
- Household income
- $75,433
- Rent vs Own
- Severe rent burden
- 207.0
Population outlook (Garland County) Hauer SSP2
- Today (2025)
- 100,343 people
- By 2030
- 101,880 · +1.5%
- By 2040
- 104,804 · +4.4%
- By 2050
- 107,292 · +6.9%
- By 2075
- 113,182 · +12.8%
- By 2100
- 112,247 · +11.9%
Race, ethnicity, and origin ACS 2023
- Neighborhood character
- Predominantly White (93%)
- Race & ethnicity
- White 93% Two or more races 3% Hispanic / Latino 2%
- Common ancestry
- Slovak 3% Romanian 3% Serbian 2%
- Foreign-born
- 2% · Canada, Vietnam
- Languages at home
- 97% English-only · Spanish 1%
Political lean MEDSL · Garland
- 2024 margin
- Solid R (+36.2) · D 30.8% · R 67.0% · Other 2.2%
- 2008→2024 swing
- -11.3pp toward R · 2008: -25.0pp · 2024: -36.2pp
- All cycles
- 2024: R+36.2 2020: R+34.0 2016: R+34.1 2012: R+29.9 2008: R+25.0
Not yet ingested
- Civics
- —
Market trends
- HPI YoY
- ▼ -24.00%
- Current HPI
- 195.9499
- Rent YoY
- —
- Metro
- Little Rock-North Little Rock-Conway, AR
- State GDP YoY
- ▲ 3.80%
- F500 in state
- 10
Industry mix (Fortune 500 HQ in AR)
| Industry | F500 HQs | Revenue |
|---|---|---|
| Retail | 1 | $681B |
|
||
| Food / Agriculture | 1 | $53B |
|
||
| Retail / Energy | 1 | $22B |
|
||
| Transportation / Logistics | 1 | $12B |
|
||
| Energy | 1 | $4B |
|
||
Price history
+170.2% since first listed18 events — show timeline
- 2026-05-05 Price Changed $199,970 CARMLS
- 2026-03-26 Price Changed $209,000 CARMLS
- 2026-01-04 Listed $225,000 CARMLS
- 2022-04-20 Sold (Public Records) $117,500 Public Records
- 2020-10-02 Sold (Public Records) $81,225 Public Records
- 2020-09-30 Sold (MLS) $81,225 HSBOR
- 2020-09-04 Sold (MLS) $81,225 CARMLS
- 2020-07-23 Pending — CARMLS
- 2020-07-17 Relisted — CARMLS
- 2020-07-08 Pending — CARMLS
- 2020-06-05 Relisted — CARMLS
- 2020-06-05 Listing Removed — CARMLS
- 2020-05-03 Pending — CARMLS
- 2020-05-02 Price Changed $81,225 CARMLS
- 2020-04-08 Price Changed $85,500 CARMLS
- 2020-01-02 Listed $81,225 HSBOR
- 2020-01-01 Listed $92,000 CARMLS
- 1999-05-11 Sold (Public Records) $74,000 Public Records
Property tax history
+11.7%/yrLatest (2025): $1,236 · -1.4% YoY. Source: county tax records.
Cash-flow waterfall
monthlySold comps — $/sqft
last 12 mo · ≤1 miLoading sold comps…