100 E Thomas Pl Unit 4055-14 · Avon, CO
Flood risk 10/10 · Severe
- FEMA flood zone
- X (unshaded)
- Chance of flooding over 30 yrs
- 0.99%
- Est. flood insurance / yr
- $507 – $1,088
Fire risk 4/10 · Minor
- Est. fire insurance / yr
- $939 – $1,743
Heat risk 1/10 · Minimal
- Hot days now (above 74°F)
- 14 days/yr
- Hot days in 30 yrs
- 37 days/yr
Wind risk 1/10 · Minimal
- Chance of severe wind over 30 yrs
- —
Air-quality risk 2/10 · Minimal
- Unhealthy air days now
- 1 days/yr
- Unhealthy air days in 30 yrs
- 2 days/yr
Risk factors via First Street. Map © Google.
Why this score? — see what drove the D grade
The composite is a weighted blend of 9 inputs, each scored 0–100. Each bar is that input's sub-score; the figure is the points it added to the 100-point composite (weight × sub-score).
- Cash flow +15.0/30.0
- Appreciation +8.3/10.0
- 1% rule +5.0/10.0
- DSCR +5.0/10.0
- Livability +3.1/5.0
- Schools +3.0/10.0
- Rent growth +2.5/5.0
- Condition / age +2.5/5.0
- ARV discount +0.0/15.0
$49,000
🖨 Deal sheet 📄 Offer letter ✓ Due diligence
Listing remarks
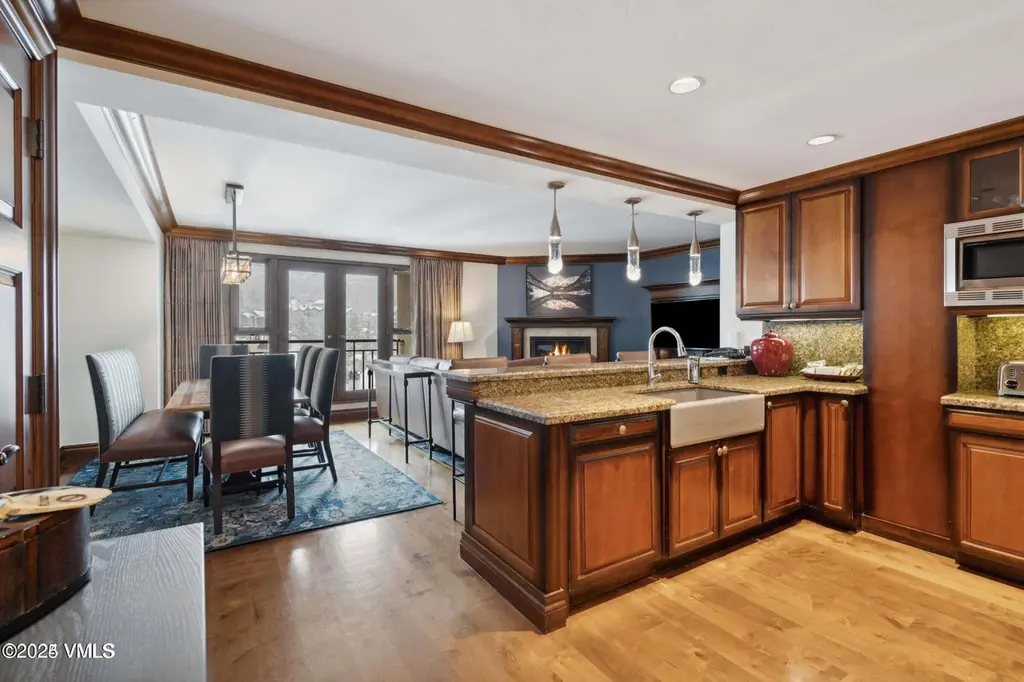
Discover exceptional mountain living in this elegant penthouse residence at the luxurious Park Hyatt Hotel. Perched above Beaver Creek Plaza with panoramic views of the village and ski slopes, this 3 bedroom 3 bath has everything you need. Enjoy the ideal slopeside setting for memorable spring trips with access to ski valet, garage parking, Spa Anjali and steps from restaurants, shops, and activities. In addition to your spring week, ownership includes annual points providing 1 full week during Beaver Creek's vibrant summer season plus additional nights. Enjoy flexibility, luxury, and adventure in one of Colorado's most sought-after alpine destinations. Dates for 2027 are April 3-10
Key facts
- Ski valet
- Panoramic views
- Penthouse residence
Tags
Property features AI
Finance
- HOA & community: Annual association fee; Association fee covers cable TV, club membership, common area maintenance, electricity, gas, heat, insurance, internet, management, sewer, taxes, trash, water, and furniture replacement; Association amenities include fitness center, front desk, pool, shuttle service, and spa/hot tub; On-site management
Exterior
- Parking:
- Utilities: Cable available; Electricity available; Natural gas available; Phone available; Sewer available; Trash service; Water available
- Home design: Multifamily zoning
- Construction: Tile roof; Poured-in-place foundation
- Exterior features: Pool; Spa/Hot Tub; Fitness Center; Cross country trail(s); Shuttle service; On-site management
Interior
- Kitchen: Dishwasher; Range; Microwave; Refrigerator
- Bedrooms: 3 bedrooms
- Flooring: Carpet; Marble; Wood
- Bathrooms: 3 full bathrooms
- Heating & cooling: Central heating; Ductless heating; Central air conditioning; Zoned cooling
- Interior features: Furnished; Washer/Dryer included; Range Hood
- Laundry & utility: Washer; Dryer; Washer/Dryer
Neighborhood map
What this means for you Summary
Snapshot
- This is a 3-bed/3.0-bath timeshare listed at $49k.
Deal economics
- At list price, monthly cash flow is $2k ($26k/yr) — positive.
- The deal already cash-flows at list — no discount required.
- Meets the 1% rule at list price ($4k rent vs $49k).
- Recommended offer: $48k (3.0% below list) — sets the bar for market timing.
- Cap rate 60.5% vs local median 2.3% in Avon — top-decile yield for the area; either an underpriced asset or a hidden risk that comps aren't pricing in. Stress-test before assuming the spread holds.
Location & tenants
- Location reads 61/100 on livability (#220 in CO) — a middle-class / working-renter tenant base. Strengths: commute A+, health & safety A+, housing B; Watch: schools F, crime D-, amenities F.
- Eagle County School District No. RE-50 (town): math 22% / reading 42% proficiency, ranked #39 of 86 in CO (top 45%) — families likely to look elsewhere, expect single-tenant / working-renter base with shorter leases.
- Market conditions: 448 active listings in the ZIP; solid renter incomes; 387 units permitted in Eagle County in 2024 (256 in 5+ unit buildings).
- At $4,425/mo this rent would consume 52% of the median local household income ($103k/yr) (locally 744% of renters already pay >50% of income on rent) — very limited rent-growth headroom before tenants either downsize or default.
Forward outlook
- In year one you build about $4k of equity ($339 loan paydown + $3k appreciation (6.6% local appreciation)).
- Eagle County population projected at +4% by 2050 — modest demand growth; plan on rents tracking national, not racing it.
- At projected returns (6.6% appreciation + 3.0% rent growth), your $14k cash investment doubles in ~1 year — after that, you're playing with house money.
- By year 9, paydown + projected appreciation supports a ~$33k cash-out refi (75% LTV) — recoverable capital for the next deal without selling this one.
Negotiation context
- It's been on market 32 days — a 3% lower offer ($48k) is reasonable based on typical stale-listing flexibility.
Risks & watch-outs
- Watch-outs: flood insurance adds $66/mo; HOA is 21% of rent.
- Climate carrying-cost: severe flood risk — expect insurance premiums to compound above CPI over the hold.
Questions for the listing agent
- It's been on market 32 days. Have you received any prior offers? Is the seller open to a 3% concession, seller financing, or rate buy-down credit?
- What's the actual annual flood-insurance premium (NFIP or private), and is the property in a SFHA with mandatory coverage?
- What does the HOA fee cover, when was the last increase, and are there any pending special assessments or reserve-fund shortfalls?
- Is there a deadline driving the sale (1031 exchange, divorce, estate, relocation)? That informs how much negotiation room exists.
- Schools are F-rated, which usually means shorter tenancies and higher turnover. Who's the typical renter profile here, and what's been the actual vacancy rate?
- Crime grade is D in this area — have there been break-ins, vandalism, or insurance claims at this property in the last 3 years? What carrier currently insures it and at what premium?
- The area grade is low — what's the realistic commute time and amenity access for the typical tenant pool here? Any planned neighborhood developments (good or bad) we should know about?
- What's the average days-on-market for RENTAL listings here right now (not sales)? A rising rental-DOM trend means longer vacancies and softer asking-rent achievability than the comps imply.
- What's the recent tenant-quality profile in this submarket — average credit score on applications, eviction rate, late-payment / NSF rate, and stable-employment percentage? A property-management company in the area should have these aggregated.
- How much new for-sale + rental construction is in the pipeline within 1–3 miles? Heavy new supply typically softens prices + rents 12–24 months out; constrained supply supports both.
Investment metrics
- 1% rule
- 9.03% ✓
- Cap rate
- 60.54%
- Cash-on-cash
- 193.76%
- DSCR
- 9.62
- GRM
- 0.9
CMA / ARV
- ARV (on-the-fly)
- $35,574
- Comps found
- 12
Show comp detail 12 sales within ~0.75 mi
| Address | Dist | Beds/Ba | Sqft | Sold | Price | $/sf | Match |
|---|---|---|---|---|---|---|---|
| 210 Offerson #419-47 | 0.10mi | 3/3.0 | 1,758 (+4%) | 8mo | $500 | — | 83 |
| 63 Avondale Ln #439/439A - week 7 | 0.10mi | 3/3.0 | 1,614 (-5%) | 13mo | $58,000 | $36 | 77 |
| 210 Offerson Rd | 0.10mi | 3/3.0 | 1,875 (+11%) | 2mo | $12,000 | $6 | 76 |
| 210 Offerson Rd #419, Week 25 | 0.10mi | 3/3.0 | 1,800 (+6%) | 11mo | $8,000 | $4 | 76 |
| 210 Offerson Rd #421, Week 25 | 0.10mi | 3/3.0 | 1,800 (+6%) | 13mo | $8,000 | $4 | 74 |
| 210 Offerson #419-2 | 0.10mi | 3/3.0 | 1,875 (+11%) | 9mo | $40,000 | $21 | 70 |
| 46 Avondale Ln #R-510, Weeks 39 & 40 | 0.08mi | 3/3.0 | 1,871 (+10%) | 12mo | $255,000 | $136 | 69 |
| 210 Offerson #304-12 | 0.10mi | 3/3.0 | 1,875 (+11%) | 10mo | $45,000 | $24 | 69 |
| 210 Offerson #206-50 | 0.10mi | 3/3.0 | 1,875 (+11%) | 12mo | $21,375 | $11 | 68 |
| 210 Offerson #311-13 & 14 | 0.10mi | 3/3.0 | 1,875 (+11%) | 13mo | $35,000 | $19 | 66 |
| 100 E Thomas Pl #2055-Week 2 | 0.04mi | 3/3.0 | 1,927 (+14%) | 13mo | $102,500 | $53 | 65 |
| 46 Avondale Ln #410 Calendar Weeks 9&10 | 0.08mi | 2/2.0 (-1) | 1,528 (-10%) | 8mo | $135,000 | $88 | 64 |
Match score weights: distance 35% · size 25% · config 20% · recency 20%. Top-matched comps best support the ARV.
Projected returns pro-forma
6.63% appreciation · 3.0% rent growth · sell at horizon
- IRR
- —
- Equity multiple
- 12.19×
- Total profit
- $153,558
- Equity at exit
- $32,787
- IRR
- —
- Equity multiple
- 26.18×
- Total profit
- $345,469
- Equity at exit
- $61,249
Cash invested: $13,720 (down + closing). Projections, not guarantees.
Landlord ↔ Tenant lean methodology
- Overall (STATE)
- 38 Tenant-Leaning
- State Colorado
- 38 Tenant-Leaning · D+4
- County
- — inherits STATE
- City
- — inherits STATE
ZIP-level market 81620
- Home prices YoY
- 1.9%
- Active inventory
- 448
- Price-to-rent
- 0.9×
Monthly cashflow live
- Estimated rent
- $4,425 medium interval (Pro) →
- Mortgage (P&I)
- −$257
- Tax est. 1.5%
- −$61 /mo · $735/yr
- Insurance
- −$20
- Flood insurance flood zone
- −$66 /mo · $798/yr
- HOA
- −$942
- Vacancy / Maint / Mgmt
- −$929
- Net cashflow
- $2,149
Break-even live
UW: 25.0% down · 7.5% · 30yr · 1.5% tax · 5.0% vac · 8.0% maint · 8.0% mgmt
Financing live
Cash to close
- Down payment
- $12,250
- Closing costs
- $1,470
- Reserves months
- —
- Total cash needed
- —
Loan-product check · same deal, 3 products live
Conventional
25% down · 7.5% · 30yr
- Down + closing
- —
- Monthly P&I
- —
- Monthly cashflow
- —
- DSCR
- —
- Eligible?
- —
Personal DTI + credit; lowest rate.
DSCR
20% down · 8.5% · 30yr
- Down + closing
- —
- Monthly P&I
- —
- Monthly cashflow
- —
- DSCR
- —
- Eligible?
- —
No personal income docs; deal must DSCR.
Hard money
10% down · 12.0% · 12mo
- Down + closing
- —
- Monthly P&I
- —
- Monthly cashflow
- —
- DSCR
- —
- Eligible?
- —
Short-term bridge; refi at stabilization.
HOA detail
- Monthly dues
- $942 · $11,304/yr
Listing history 17 events
-
2026-06-19days on market $49,000 Active 32 DOM
-
2026-06-18days on market $49,000 Active 31 DOM
-
2026-06-17days on market $49,000 Active 30 DOM
-
2026-06-16days on market $49,000 Active 29 DOM
-
2026-06-15days on market $49,000 Active 28 DOM
-
2026-06-14days on market $49,000 Active 26 DOM
-
2026-06-12days on market $49,000 Active 25 DOM
-
2026-06-09days on market $49,000 Active 22 DOM
-
2026-06-08days on market $49,000 Active 21 DOM
-
2026-06-07days on market $49,000 Active 20 DOM
-
2026-06-05days on market $49,000 Active 17 DOM
-
2026-06-03days on market $49,000 Active 16 DOM
-
2026-06-02days on market $49,000 Active 15 DOM
-
2026-06-01days on market $49,000 Active 14 DOM
-
2026-05-31days on market $49,000 Active 13 DOM
-
2026-05-30days on market $49,000 Active 12 DOM
-
2026-05-18$49,000 Active
ⓘ Source: listings_history table (triggers on properties + properties_extension) + one-shot
backfill from property_details.listing_events for pre-trigger history.
Climate risk First Street
- Flood 10/10 Extreme FEMA zone X (unshaded) · 99% chance over 30 yrs
- Wildfire 4/10 Moderate
- Heat 1/10 Low 14 d/yr ≥74°F today · 37 d/yr by 30 yrs out
- Wind 1/10 Low
- Air quality 2/10 Low 1 unhealthy d/yr today · 2 by 30 yrs out
Nearby sold comps map
Loading sold comps map…
Walkable amenities ~0.75 mi
Loading nearby amenities…
Taxation est. · year 1
- Rental income
- $53,103
- − Mortgage interest
- −$2,745
- − Property taxes
- −$735
- − Insurance
- −$1,042
- − Repairs & maintenance
- −$4,248
- − Management
- −$4,248
- − HOA
- −$11,304
- − Depreciation
- −$1,425
- Taxable income
- $27,354
- Est. tax owed @ 24.0%
- −$6,565
- After-tax cash flow
- $19,221/yr
For passive investors: Depreciation is non-cash, so a rental often shows a tax loss while cash-flowing — sheltering income. Rental losses are passive: they offset passive income freely, and up to $25,000/yr can offset ordinary (W-2) income if you actively participate and your MAGI is under $100k (phasing out to $0 by $150k); unused losses carry forward. On sale, claimed depreciation is recaptured at up to 25%, and gains may owe capital-gains tax (a 1031 exchange can defer both). Figures are a year-1 estimate at your 24.0% rate — not tax advice; consult a CPA.
Schools (NCES district)
- District
- Eagle County School District No. RE-50
- NCES district ID
- 0803540
- Math proficiency
- 22% ▼ -8.00%
- Reading proficiency
- 42% ▼ -4.00%
- Median HH income
- $73,322
- Composite
- 30.01/100
- National rank
- #6360
- State rank
- #39 of 86 in CO
Livability — Avon
- Score
- 61/100
- State rank
- #220
- US rank
- #17858
Category grades
Schools grade is shown separately in the Schools card above.
Census & demographics
- County
- Eagle County · 42,178 people
- City population
- 10,870
- Metro
- Edwards, CO
- Population (ZIP)
- 10,870
- Household income
- $102,775
- Rent vs Own
- Severe rent burden
- 744.0
Population outlook (Eagle County) Hauer SSP2
- Today (2025)
- 57,837 people
- By 2030
- 59,258 · +2.5%
- By 2040
- 60,698 · +4.9%
- By 2050
- 60,206 · +4.1%
- By 2075
- 54,326 · -6.1%
- By 2100
- 47,000 · -18.7%
Race, ethnicity, and origin ACS 2023
- Neighborhood character
- Diverse neighborhood (Simpson 0.56)
- Race & ethnicity
- White 62% Hispanic / Latino 23% Two or more races 23% Asian 3% Black 2%
- Hispanic origin (detail)
- Mexican 14%
- Common ancestry
- Italian 3% Scotch-Irish 2% Slovak 2%
- Foreign-born
- 14% · Canada, Dominican Republic
- Languages at home
- 78% English-only · Spanish 15% Other Indo-European 4% Chinese 1%
Political lean MEDSL · Eagle
- 2024 margin
- Strong D (+24.4) · D 61.0% · R 36.5% · Other 2.5%
- 2008→2024 swing
- +1.3pp toward D · 2008: 23.1pp · 2024: 24.4pp
- All cycles
- 2024: D+24.4 2020: D+29.8 2016: D+19.9 2012: D+14.7 2008: D+23.1
Not yet ingested
- Civics
- —
Market trends
- HPI YoY
- ▲ 6.63%
- Current HPI
- 363.7493
- Rent YoY
- —
- Metro
- Edwards, CO
- State GDP YoY
- ▲ 1.95%
- F500 in state
- 14
Industry mix (Fortune 500 HQ in CO)
| Industry | F500 HQs | Revenue |
|---|---|---|
| Technology Distribution | 1 | $31B |
|
||
| Food / Agriculture | 1 | $18B |
|
||
| Packaging | 1 | $14B |
|
||
| Healthcare | 1 | $13B |
|
||
| Energy | 1 | $10B |
|
||
| Technology | 1 | $4B |
|
||
Price history
1 event — show timeline
- 2026-05-18 Listed $49,000 VMLS
Cash-flow waterfall
monthlySold comps — $/sqft
last 12 mo · ≤1 miLoading sold comps…