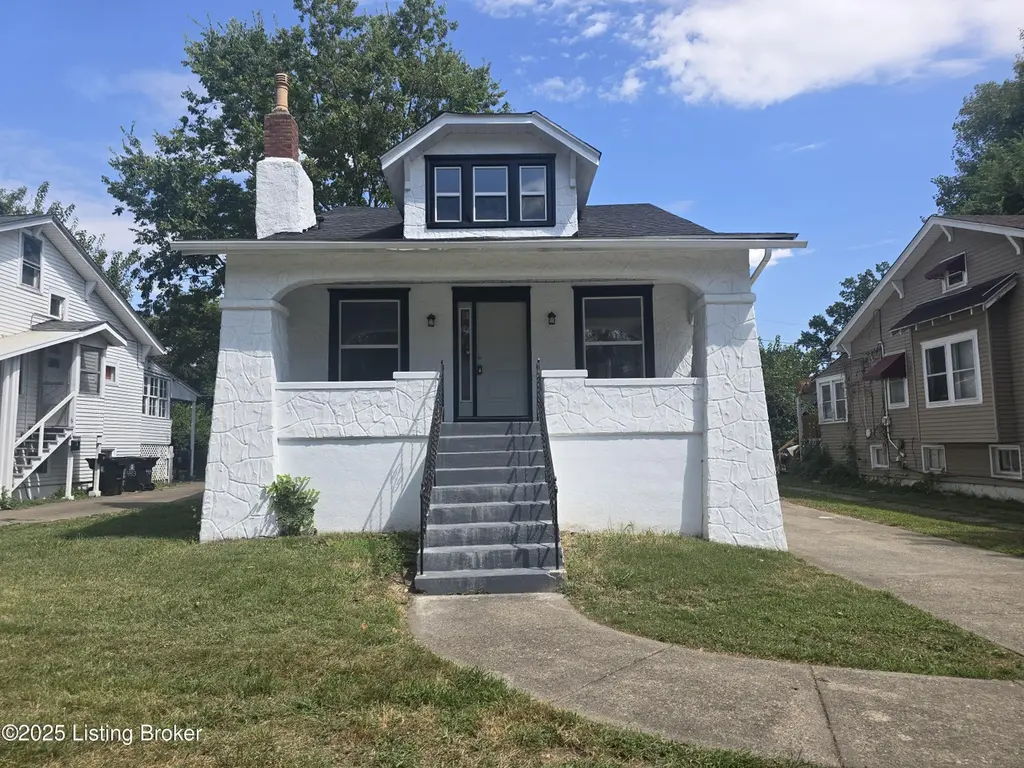
4521 S 3rd St · Louisville, KY
Flood risk 1/10 · Minimal
- FEMA flood zone
- X (unshaded)
- Chance of flooding over 30 yrs
- 0.0%
- Est. flood insurance / yr
- $473 – $860
Fire risk 1/10 · Minimal
- Est. fire insurance / yr
- $839 – $1,559
Heat risk 5/10 · Moderate
- Hot days now (above 105°F)
- 7 days/yr
- Hot days in 30 yrs
- 19 days/yr
Wind risk 2/10 · Minimal
- Chance of severe wind over 30 yrs
- 2.0%
Air-quality risk 2/10 · Minimal
- Unhealthy air days now
- 1 days/yr
- Unhealthy air days in 30 yrs
- 3 days/yr
Risk factors via First Street. Map © Google.
Why this score? — see what drove the C+ grade
The composite is a weighted blend of 9 inputs, each scored 0–100. Each bar is that input's sub-score; the figure is the points it added to the 100-point composite (weight × sub-score).
- Cash flow +22.6/30.0
- ARV discount +15.0/15.0
- DSCR +7.2/10.0
- 1% rule +5.1/10.0
- Livability +3.2/5.0
- Rent growth +3.0/5.0
- Condition / age +2.5/5.0
- Schools +2.3/10.0
- Appreciation +0.0/10.0
$220,000
🖨 Deal sheet 📄 Offer letter ✓ Due diligence
Key facts
- 6,752 sq ft lot
- Garage
- Built 1925
Neighborhood map
What this means for you Summary
Snapshot
- This is a 4-bed/2.0-bath single-family listed at $220k.
Deal economics
- At list price, monthly cash flow is $373 ($4k/yr) — positive.
- The deal already cash-flows at list — no discount required.
- Meets the 1% rule at list price ($2k rent vs $220k).
- Recommended offer: $217k (1.5% below list) — sets the bar for market timing.
- Cap rate 8.3% vs local median 5.0% in Louisville — top-decile yield for the area; either an underpriced asset or a hidden risk that comps aren't pricing in. Stress-test before assuming the spread holds.
Location & tenants
- Location reads 63/100 on livability (#333 in KY) — a middle-class / working-renter tenant base. Strengths: cost of living A+, housing A+; Watch: employment C-, health & safety D+, schools D-.
- Jefferson County (urban): math 19% / reading 35% proficiency, ranked #121 of 165 in KY (top 73%) — low school quality limits family demand, transient renter base, plan for 1-2y turnover.
- Market conditions: Rents rising (+1.9%/yr); 243 active listings in the ZIP; 7 comparable units currently listed for rent nearby; rentals at typical pace (median 16d on market — plan ~3-4 weeks tenant-placement turnaround); 2,836 units permitted in Jefferson County in 2024 (1,558 in 5+ unit buildings).
- At $2,228/mo this rent would consume 49% of the median local household income ($55k/yr) (locally 2054% of renters already pay >50% of income on rent) — very limited rent-growth headroom before tenants either downsize or default.
Forward outlook
- Local home prices are declining (-3.0%/yr); year-one equity from $2k of loan paydown is wiped out by about $7k of value loss. Plan a longer hold.
- Jefferson County population projected at +13% by 2050 — modest demand growth; plan on rents tracking national, not racing it.
Negotiation context
- It's been on market 17 days — a 2% lower offer ($217k) is reasonable based on typical stale-listing flexibility.
- 7 sale attempts since 26y ago with the ask held roughly flat each time — persistent listings suggest the price (not the market) is what's stuck; bring a comps-based counter.
- Current owner paid $186k; 18% above their basis — modest negotiation headroom, anchor on the comps not their cost.
Risks & watch-outs
- Watch-outs: built in 1925 — expect roof / HVAC / electrical / plumbing capex.
- Climate carrying-cost: extreme-heat days projected 7→19/yr by 2055 (HVAC capex compounding) — expect insurance premiums to compound above CPI over the hold.
Questions for the listing agent
- Built in 1925 — when were the roof, HVAC, electrical panel, plumbing, and water heater last replaced?
- Is there a deadline driving the sale (1031 exchange, divorce, estate, relocation)? That informs how much negotiation room exists.
- Schools are D-rated, which usually means shorter tenancies and higher turnover. Who's the typical renter profile here, and what's been the actual vacancy rate?
- Crime grade is F in this area — have there been break-ins, vandalism, or insurance claims at this property in the last 3 years? What carrier currently insures it and at what premium?
- What's the average days-on-market for RENTAL listings here right now (not sales)? A rising rental-DOM trend means longer vacancies and softer asking-rent achievability than the comps imply.
- What's the recent tenant-quality profile in this submarket — average credit score on applications, eviction rate, late-payment / NSF rate, and stable-employment percentage? A property-management company in the area should have these aggregated.
- How much new for-sale + rental construction is in the pipeline within 1–3 miles? Heavy new supply typically softens prices + rents 12–24 months out; constrained supply supports both.
Investment metrics
- 1% rule
- 1.01% ✓
- Cap rate
- 8.33%
- Cash-on-cash
- 7.27%
- DSCR
- 1.32
- GRM
- 8.2
CMA / ARV
- ARV (on-the-fly)
- $271,674
- Comps found
- 12
Show comp detail 12 sales within ~0.75 mi
| Address | Dist | Beds/Ba | Sqft | Sold | Price | $/sf | Match |
|---|---|---|---|---|---|---|---|
| 4516 S 2nd St | 0.04mi | 3/2.5 (-1) | 2,534 (+9%) | 1mo | $285,600 | $113 | 75 |
| 124 E Wellington Ave | 0.37mi | 4/2.0 | 2,300 (-1%) | 11mo | $269,000 | $117 | 72 |
| 4503 Southern Pkwy | 0.11mi | 3/2.5 (-1) | 2,404 (+4%) | 15mo | $340,000 | $141 | 70 |
| 4332 S 3rd St | 0.35mi | 3/2.0 (-1) | 2,242 (-3%) | 11mo | $253,000 | $113 | 64 |
| 4507 Meridale Ave | 0.15mi | 4/3.0 | 2,545 (+10%) | 14mo | $309,000 | $121 | 61 |
| 4127 S 2nd St | 0.55mi | 3/2.0 (-1) | 2,300 (-1%) | 8mo | $250,000 | $109 | 61 |
| 4614 Southcrest Dr | 0.48mi | 4/2.0 | 2,126 (-8%) | 10mo | $225,000 | $106 | 56 |
| 4618 S 6th St | 0.41mi | 3/1.5 (-1) | 2,408 (+4%) | 16mo | $274,000 | $114 | 54 |
| 4705 Southern Pkwy | 0.49mi | 4/3.0 | 2,160 (-7%) | 12mo | $400,000 | $185 | 52 |
| 4410 Allmond Ave | 0.35mi | 3/2.0 (-1) | 2,002 (-14%) | 12mo | $223,000 | $111 | 46 |
| 4628 Southcrest Dr | 0.52mi | 3/3.0 (-1) | 2,152 (-7%) | 16mo | $349,000 | $162 | 41 |
| 910 W Ashland Ave | 0.64mi | 3/3.0 (-1) | 2,148 (-8%) | 13mo | $259,900 | $121 | 38 |
Match score weights: distance 35% · size 25% · config 20% · recency 20%. Top-matched comps best support the ARV.
Projected returns pro-forma
-3.0% appreciation · 1.89% rent growth · sell at horizon
- IRR
- -6.4%
- Equity multiple
- 0.77×
- Total profit
- $-14,392
- Equity at exit
- $32,803
- IRR
- 1.9%
- Equity multiple
- 1.13×
- Total profit
- $7,999
- Equity at exit
- $19,022
Cash invested: $61,600 (down + closing). Projections, not guarantees.
Landlord ↔ Tenant lean methodology
- Overall (STATE)
- 83 Strongly Landlord-Friendly
- State Kentucky
- 83 Strongly Landlord-Friendly · R+16
- County
- — inherits STATE
- City
- — inherits STATE
ZIP-level market 40214
- Rents YoY
- 1.9%
- Active inventory
- 243
- Price-to-rent
- 8.2×
Monthly cashflow live
- Estimated rent
- $2,228 high interval (Pro) →
- Mortgage (P&I)
- −$1,154
- Tax from tax record
- −$142 /mo · $1,701/yr
- Insurance
- −$92
- HOA
- −$0
- Vacancy / Maint / Mgmt
- −$468
- Net cashflow
- $373
Break-even live
UW: 25.0% down · 7.5% · 30yr · 1.5% tax · 5.0% vac · 8.0% maint · 8.0% mgmt
Financing live
Cash to close
- Down payment
- $55,000
- Closing costs
- $6,600
- Reserves months
- —
- Total cash needed
- —
Loan-product check · same deal, 3 products live
Conventional
25% down · 7.5% · 30yr
- Down + closing
- —
- Monthly P&I
- —
- Monthly cashflow
- —
- DSCR
- —
- Eligible?
- —
Personal DTI + credit; lowest rate.
DSCR
20% down · 8.5% · 30yr
- Down + closing
- —
- Monthly P&I
- —
- Monthly cashflow
- —
- DSCR
- —
- Eligible?
- —
No personal income docs; deal must DSCR.
Hard money
10% down · 12.0% · 12mo
- Down + closing
- —
- Monthly P&I
- —
- Monthly cashflow
- —
- DSCR
- —
- Eligible?
- —
Short-term bridge; refi at stabilization.
Rent comps 7 comps
| Address | Beds | Baths | Sqft | Rent | $/sqft | DOM | Units | Dist |
|---|---|---|---|---|---|---|---|---|
| 4513 S 6th St Louisville, KY | 3.0 | 2.0 | 1581 | $2,650 | $1.68 | 23d | 1 | 0.26mi |
| 3830 Southern Pkwy Louisville, KY | 4.0 | 2.5 | 3332 | $2,100 | $0.63 | 15d | 1 | 0.81mi |
| 3102 Grant Ave Louisville, KY | 4.0 | 2.0 | 1603 | $1,595 | $1.00 | 23d | 1 | 0.98mi |
| 519 Forum Ave Louisville, KY | 3.0 | 1.5 | 1693 | $1,600 | $0.95 | 23d | 1 | 1.04mi |
| 4010 Taylor Blvd Louisville, KY | 4.0 | 2.0 | 1612 | $3,000 | $1.86 | 15d | 1 | 1.06mi |
| 2718 S 3rd St Unit 2 Louisville, KY | 4.0 | 2.0 | 2000 | $2,800 | $1.40 | 11d | 1 | 1.48mi |
| 2711 S 3rd St Unit 1 Louisville, KY | 4.0 | 2.0 | 1800 | $2,400 | $1.33 | 11d | 1 | 1.50mi |
Listing history 34 events
-
2026-06-18days on market $220,000 Active 17 DOM
-
2026-06-17price $220,000 Active 16 DOM
-
2026-06-17days on market $225,000 Active 16 DOM
-
2026-06-16days on market $225,000 Active 15 DOM
-
2026-06-15days on market $225,000 Active 14 DOM
-
2026-06-13days on market $225,000 Active 12 DOM
-
2026-06-10days on market $225,000 Active 9 DOM
-
2026-06-09days on market $225,000 Active 8 DOM
-
2026-06-08days on market $225,000 Active 7 DOM
-
2026-06-08status $225,000 Active 6 DOM
-
2026-04-13status Pending
-
2026-04-07$225,000 Active
-
2026-04-03historical
-
2026-03-25price $225,500
-
2026-03-25status Active
-
2026-01-30historical Active Under Contract
-
2025-12-25price $215,500
-
2025-12-01$221,500 Active
-
2025-11-21historical
-
2025-11-12price $220,500
-
2025-10-18price $225,500
-
2025-10-17price $226,500
-
2025-10-02price $231,500
-
2025-09-06price $233,500
-
2025-08-29price $234,500
-
2025-08-20price $239,500
-
2025-08-17$245,000 Active
-
2025-08-05soldstatus $186,000
-
2011-11-29soldstatus $32,011
-
2011-11-01$34,900
-
2011-09-18historical
-
2011-06-20$43,900
-
2000-04-10soldstatus $97,000
-
2000-03-01$99,500
ⓘ Source: listings_history table (triggers on properties + properties_extension) + one-shot
backfill from property_details.listing_events for pre-trigger history.
Tax reassessment forecast KY · Resets to sale price
- Current annual tax
- $1,701 · $142/mo
- Projected year-2 tax
- $1,892 · $158/mo
- Expected delta
- +$191/yr (+$16/mo · 11.2%)
ⓘ Screening estimate from a state-policy table — verify with the county assessor before closing.
Climate risk First Street
- Flood 1/10 Low FEMA zone X (unshaded) · 0% chance over 30 yrs
- Wildfire 1/10 Low
- Heat 5/10 Major 7 d/yr ≥105°F today · 19 d/yr by 30 yrs out
- Wind 2/10 Low 2% chance of damaging wind over 30 yrs
- Air quality 2/10 Low 1 unhealthy d/yr today · 3 by 30 yrs out
Nearby sold comps map
Loading sold comps map…
Walkable amenities ~0.75 mi
Loading nearby amenities…
Taxation est. · year 1
- Rental income
- $26,739
- − Mortgage interest
- −$12,323
- − Property taxes
- −$1,701
- − Insurance
- −$1,100
- − Repairs & maintenance
- −$2,139
- − Management
- −$2,139
- − Depreciation
- −$6,400
- Taxable income
- $936
- Est. tax owed @ 24.0%
- −$225
- After-tax cash flow
- $4,253/yr
For passive investors: Depreciation is non-cash, so a rental often shows a tax loss while cash-flowing — sheltering income. Rental losses are passive: they offset passive income freely, and up to $25,000/yr can offset ordinary (W-2) income if you actively participate and your MAGI is under $100k (phasing out to $0 by $150k); unused losses carry forward. On sale, claimed depreciation is recaptured at up to 25%, and gains may owe capital-gains tax (a 1031 exchange can defer both). Figures are a year-1 estimate at your 24.0% rate — not tax advice; consult a CPA.
Schools (NCES district)
- District
- Jefferson County
- NCES district ID
- 2102990
- Math proficiency
- 19% ▼ -17.00%
- Reading proficiency
- 35% ▼ -11.00%
- Median HH income
- $47,885
- Composite
- 23.45/100
- National rank
- #7884
- State rank
- #121 of 165 in KY
Livability — Louisville
- Score
- 63/100
- State rank
- #333
- US rank
- #15887
Category grades
Schools grade is shown separately in the Schools card above.
Census & demographics
- Census place
- Louisville, KY
- County
- Jefferson County · 790,184 people
- City population
- 769,292
- Metro
- Louisville/Jefferson County, KY-IN
- Population (ZIP)
- 45,405
- Household income
- $54,931
- Rent vs Own
- Severe rent burden
- 2054.0
Population outlook (Jefferson County) Hauer SSP2
- Today (2025)
- 823,112 people
- By 2030
- 849,343 · +3.2%
- By 2040
- 895,696 · +8.8%
- By 2050
- 933,630 · +13.4%
- By 2075
- 1,028,262 · +24.9%
- By 2100
- 1,072,675 · +30.3%
Race, ethnicity, and origin ACS 2023
- Neighborhood character
- Diverse neighborhood (Simpson 0.67)
- Race & ethnicity
- White 51% Black 22% Hispanic / Latino 14% Two or more races 12% Asian 7%
- Hispanic origin (detail)
- Mexican 3% Cuban 6%
- Common ancestry
- Slovak 1% Lithuanian 1% Serbian 1%
- Foreign-born
- 21% · Canada, Vietnam, Philippines
- Languages at home
- 74% English-only · Spanish 12% Vietnamese 3% Other Asian/Pacific 2%
Political lean MEDSL · Jefferson
- 2024 margin
- D (+16.6) · D 57.4% · R 40.9% · Other 1.7%
- 2008→2024 swing
- +4.5pp toward D · 2008: 12.0pp · 2024: 16.6pp
- All cycles
- 2024: D+16.6 2020: D+20.1 2016: D+13.3 2012: D+11.1 2008: D+12.0
Not yet ingested
- Civics
- —
Market trends
- HPI YoY
- ▼ -235.43%
- Current HPI
- 237.4062
- Rent YoY
- ▲ 1.89%
- Metro
- Louisville/Jefferson County, KY-IN
- State GDP YoY
- ▲ 1.81%
- F500 in state
- 4
Industry mix (Fortune 500 HQ in KY)
| Industry | F500 HQs | Revenue |
|---|---|---|
| Healthcare | 1 | $118B |
|
||
| Food / Beverage | 1 | $7B |
|
||
Price history
+126.1% since first listed24 events — show timeline
- 2026-04-13 Pending — Metro Search MLS
- 2026-04-07 Listed $225,000 Metro Search MLS
- 2026-04-03 Listing Removed — Metro Search MLS
- 2026-03-25 Price Changed $225,500 Metro Search MLS
- 2026-03-25 Relisted — Metro Search MLS
- 2026-01-30 Contingent — Metro Search MLS
- 2025-12-25 Price Changed $215,500 Metro Search MLS
- 2025-12-01 Listed $221,500 Metro Search MLS
- 2025-11-21 Listing Removed — Metro Search MLS
- 2025-11-12 Price Changed $220,500 Metro Search MLS
- 2025-10-18 Price Changed $225,500 Metro Search MLS
- 2025-10-17 Price Changed $226,500 Metro Search MLS
- 2025-10-02 Price Changed $231,500 Metro Search MLS
- 2025-09-06 Price Changed $233,500 Metro Search MLS
- 2025-08-29 Price Changed $234,500 Metro Search MLS
- 2025-08-20 Price Changed $239,500 Metro Search MLS
- 2025-08-17 Listed $245,000 Metro Search MLS
- 2025-08-05 Sold (Public Records) $186,000 Public Records
- 2011-11-29 Sold (MLS) $32,011 Metro Search MLS
- 2011-11-01 Listed $34,900 Metro Search MLS
- 2011-09-18 Listing Removed — Metro Search MLS
- 2011-06-20 Listed $43,900 Metro Search MLS
- 2000-04-10 Sold (MLS) $97,000 Metro Search MLS
- 2000-03-01 Listed $99,500 Metro Search MLS
Property tax history
+0.6%/yrLatest (2025): $1,701 · -1.9% YoY. Source: county tax records.
Cash-flow waterfall
monthlySold comps — $/sqft
last 12 mo · ≤1 miLoading sold comps…