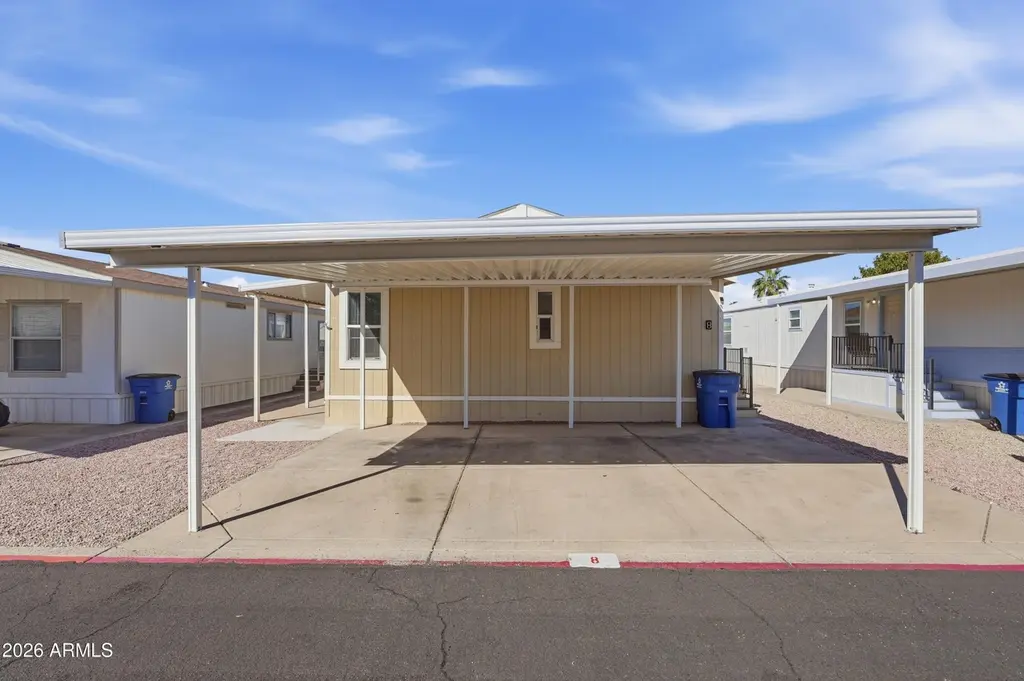
2140 E Michigan Ave #8 · Phoenix, AZ
Flood risk No data
- FEMA flood zone
- —
- Chance of flooding over 30 yrs
- —
- Est. flood insurance / yr
- —
Fire risk No data
- Est. fire insurance / yr
- —
Heat risk No data
- Hot days now (above threshold)
- —
- Hot days in 30 yrs
- —
Wind risk No data
- Chance of severe wind over 30 yrs
- —
Air-quality risk No data
- Unhealthy air days now
- —
- Unhealthy air days in 30 yrs
- —
Risk factors via First Street. Map © Google.
Why this score? — see what drove the C+ grade
The composite is a weighted blend of 9 inputs, each scored 0–100. Each bar is that input's sub-score; the figure is the points it added to the 100-point composite (weight × sub-score).
- Cash flow +30.0/30.0
- DSCR +10.0/10.0
- 1% rule +9.6/10.0
- Condition / age +4.0/5.0
- Schools +3.8/10.0
- Livability +3.8/5.0
- Rent growth +2.2/5.0
- ARV discount +0.0/15.0
- Appreciation +0.0/10.0
$150,000
🖨 Deal sheet 📄 Offer letter ✓ Due diligence
Listing remarks MLS
MOTIVATED SELLERS!! Step into your new home in Buffalo Rideg! This property offers a fantastic layout along with a great community and amenities!
Key facts
- 4 parking spots
- Community pool
- Built 2017
Neighborhood map
What this means for you Summary
Snapshot
- This is a 4-bed/2.0-bath manufactured listed at $150k. Condition is rated good.
Deal economics
- At list price, monthly cash flow is $699 ($8k/yr) — positive.
- The deal already cash-flows at list — no discount required.
- Meets the 1% rule at list price ($2k rent vs $150k).
- Recommended offer: $136k (9.0% below list) — sets the bar for market timing.
- Cap rate 11.9% vs local median 3.3% in Phoenix — top-decile yield for the area; either an underpriced asset or a hidden risk that comps aren't pricing in. Stress-test before assuming the spread holds.
Location & tenants
- Location reads 75/100 on livability (#16 in AZ, #3,924 nationally) — a middle-class / working-renter tenant base. Strengths: amenities A+, commute A+, housing A+; Watch: health & safety C-, crime F.
- Paradise Valley Unified District (4241) (urban): math 39% / reading 46% proficiency, ranked #56 of 249 in AZ (top 22%) — families likely to look elsewhere, expect single-tenant / working-renter base with shorter leases.
- Market conditions: Rents soft (-1.2%/yr); 282 active listings in the ZIP; 40 comparable units currently listed for rent nearby; rentals at typical pace (median 15d on market — plan ~3-4 weeks tenant-placement turnaround); 36,011 units permitted in Maricopa County in 2024 (12,801 in 5+ unit buildings).
- This rent runs 38% of the median local income ($70k/yr) — at the standard rent-burdened threshold; future hikes will face affordability resistance.
Forward outlook
- Local home prices are declining (-3.0%/yr); year-one equity from $1k of loan paydown is wiped out by about $4k of value loss. Plan a longer hold.
- Maricopa County population projected at +38% by 2050 — long-run rental-demand tailwind backs the buy-and-hold thesis.
- At projected returns (-3.0% appreciation + 0.0% rent growth), your $42k cash investment doubles in ~8 years — after that, you're playing with house money.
Negotiation context
- It's been on market 92 days — a 9% lower offer ($136k) is reasonable based on typical stale-listing flexibility.
Questions for the listing agent
- It's been on market 92 days. Have you received any prior offers? Is the seller open to a 9% concession, seller financing, or rate buy-down credit?
- Why hasn't it sold? Are there any deal-killer items the seller is aware of (foundation, flood, title, zoning, code violations)?
- Is there a deadline driving the sale (1031 exchange, divorce, estate, relocation)? That informs how much negotiation room exists.
- Crime grade is F in this area — have there been break-ins, vandalism, or insurance claims at this property in the last 3 years? What carrier currently insures it and at what premium?
- What's the average days-on-market for RENTAL listings here right now (not sales)? A rising rental-DOM trend means longer vacancies and softer asking-rent achievability than the comps imply.
- What's the recent tenant-quality profile in this submarket — average credit score on applications, eviction rate, late-payment / NSF rate, and stable-employment percentage? A property-management company in the area should have these aggregated.
- How much new for-sale + rental construction is in the pipeline within 1–3 miles? Heavy new supply typically softens prices + rents 12–24 months out; constrained supply supports both.
Investment metrics
- 1% rule
- 1.46% ✓
- Cap rate
- 11.88%
- Cash-on-cash
- 19.97%
- DSCR
- 1.89
- GRM
- 5.7
CMA / ARV
- ARV (median comp)
- $101,694
- List price
- $150,000
- Delta
- 47.50%
- Verdict
- OVERPRICED
- Comps
- 20 within 1.0 mi
Show comp detail 12 sales within ~0.75 mi
| Address | Dist | Beds/Ba | Sqft | Sold | Price | $/sf | Match |
|---|---|---|---|---|---|---|---|
| 18240 N 21st St #100 | 0.07mi | 3/2.0 (-1) | 1,568 (0%) | 7mo | $145,000 | $92 | 86 |
| 2087 E Michelle Dr | 0.13mi | 3/2.0 (-1) | 1,643 (+5%) | 0mo | $302,000 | $184 | 80 |
| 1955 E Grovers Ave #10 | 0.38mi | 3/2.0 (-1) | 1,568 (0%) | 4mo | $55,500 | $35 | 74 |
| 2140 E Michigan Ave #5 | 0.09mi | 3/2.0 (-1) | 1,456 (-7%) | 9mo | $111,200 | $76 | 72 |
| 2120 E Bluefield Ave #123 | 0.22mi | 4/2.0 | 1,664 (+6%) | 12mo | $135,000 | $81 | 70 |
| 18223 N 21st Pl #52 | 0.04mi | 3/2.0 (-1) | 1,344 (-14%) | 1mo | $93,000 | $69 | 68 |
| 1634 E Michelle Dr | 0.63mi | 3/2.0 (-1) | 1,568 (0%) | 1mo | $75,000 | $48 | 65 |
| 2140 E Michigan Ave #42 | 0.00mi | 3/2.0 (-1) | 1,344 (-14%) | 9mo | $100,000 | $74 | 64 |
| 18221 N 21st St #75 | 0.07mi | 3/2.0 (-1) | 1,344 (-14%) | 10mo | $135,000 | $100 | 60 |
| 1820 E Grovers Ave | 0.46mi | 3/2.0 (-1) | 1,440 (-8%) | 3mo | $284,000 | $197 | 57 |
| 1955 E Grovers Ave #8 | 0.40mi | 3/2.0 (-1) | 1,456 (-7%) | 12mo | $124,000 | $85 | 55 |
| 1955 E Grovers Ave #18 | 0.40mi | 3/2.0 (-1) | 1,344 (-14%) | 9mo | $69,900 | $52 | 45 |
Match score weights: distance 35% · size 25% · config 20% · recency 20%. Top-matched comps best support the ARV.
Projected returns pro-forma
-3.0% appreciation · 0.0% rent growth · sell at horizon
- IRR
- 8.7%
- Equity multiple
- 1.33×
- Total profit
- $13,795
- Equity at exit
- $22,365
- IRR
- 15.2%
- Equity multiple
- 2.06×
- Total profit
- $44,576
- Equity at exit
- $12,969
Cash invested: $42,000 (down + closing). Projections, not guarantees.
Landlord ↔ Tenant lean methodology
- Overall (STATE)
- 87 Strongly Landlord-Friendly
- State Arizona
- 87 Strongly Landlord-Friendly · R+3
- County
- — inherits STATE
- City
- — inherits STATE
ZIP-level market 85022
- Rents YoY
- -1.2%
- Active inventory
- 282
- Price-to-rent
- 5.7×
Monthly cashflow live
- Estimated rent
- $2,197 high interval (Pro) →
- Mortgage (P&I)
- −$787
- Tax est. 1.5%
- −$188 /mo · $2,250/yr
- Insurance
- −$62
- HOA
- −$0
- Vacancy / Maint / Mgmt
- −$461
- Net cashflow
- $699
Break-even live
UW: 25.0% down · 7.5% · 30yr · 1.5% tax · 5.0% vac · 8.0% maint · 8.0% mgmt
Financing live
Cash to close
- Down payment
- $37,500
- Closing costs
- $4,500
- Reserves months
- —
- Total cash needed
- —
Loan-product check · same deal, 3 products live
Conventional
25% down · 7.5% · 30yr
- Down + closing
- —
- Monthly P&I
- —
- Monthly cashflow
- —
- DSCR
- —
- Eligible?
- —
Personal DTI + credit; lowest rate.
DSCR
20% down · 8.5% · 30yr
- Down + closing
- —
- Monthly P&I
- —
- Monthly cashflow
- —
- DSCR
- —
- Eligible?
- —
No personal income docs; deal must DSCR.
Hard money
10% down · 12.0% · 12mo
- Down + closing
- —
- Monthly P&I
- —
- Monthly cashflow
- —
- DSCR
- —
- Eligible?
- —
Short-term bridge; refi at stabilization.
Rent comps 40 comps
| Address | Beds | Baths | Sqft | Rent | $/sqft | DOM | Units | Dist |
|---|---|---|---|---|---|---|---|---|
| 2221 E Union Hills Dr #158 Phoenix, AZ | 3.0 | 2.0 | 1332 | $2,100 | $1.58 | 18d | 1 | 0.14mi |
| 18611 N 22nd St #72 Phoenix, AZ | 3.0 | 2.5 | 1851 | $2,200 | $1.19 | 14d | 1 | 0.32mi |
| 18611 N 22nd St Phoenix, AZ | 3.0 | 3.0 | 1851 | $2,200 | $1.19 | 12d | 1 | 0.32mi |
| 18660 N Cave Creek Rd Phoenix, AZ | 1.0–3.0 | 1.0–2.0 | 961 | $1,955 | $2.03 | 1d | 11 | 0.38mi |
| 2239 E Morrow Dr Phoenix, AZ | 3.0 | 3.0 | 1545 | $2,199 | $1.42 | 2d | 1 | 0.43mi |
| 1717 E Union Hills Dr Phoenix, AZ | 2.0–3.0 | 2.0 | 1245 | $4,000 | $3.21 | 21d | 4 | 0.44mi |
| 1717 E Union Hills Dr Phoenix, AZ | 2.0–3.0 | 2.0 | 1169 | $4,000 | $3.42 | 2d | 3 | 0.44mi |
| 17833 N 26th St Phoenix, AZ | 4.0 | 2.0 | 1220 | $2,397 | $1.96 | 1d | 1 | 0.60mi |
| 1935 E Campo Bello Dr Phoenix, AZ | 5.0 | 2.0 | 1904 | $2,395 | $1.26 | 24d | 1 | 0.61mi |
| 2602 E Charleston Ave Phoenix, AZ | 3.0 | 2.0 | 1426 | $2,100 | $1.47 | 24d | 1 | 0.62mi |
| 17606 N 17th Pl Phoenix, AZ | 2.0–3.0 | 2.5 | 1472 | $2,300 | $1.56 | 12d | 3 | 0.66mi |
| 17606 N 17th Pl Phoenix, AZ | 2.0–3.0 | 2.0–2.5 | 1463 | $2,300 | $1.57 | 2d | 3 | 0.66mi |
| 2150 E Bell Rd #1102 Phoenix, AZ | 3.0 | 2.5 | 1462 | $1,945 | $1.33 | 14d | 1 | 0.68mi |
| 17365 N Cave Creek Rd #124 Phoenix, AZ | 3.0 | 2.5 | 1468 | $2,299 | $1.57 | 14d | 1 | 0.71mi |
| 17223 N Cave Creek Rd #7 Phoenix, AZ | 3.0 | 3.0 | 1550 | $1,745 | $1.13 | 24d | 1 | 0.72mi |
| 17223 N Cave Creek Rd #7 Phoenix, AZ | 3.0 | 3.0 | 1550 | $1,645 | $1.06 | 21d | 1 | 0.72mi |
| 2719 E Charleston Ave Phoenix, AZ | 3.0 | 1.5 | 1670 | $1,891 | $1.13 | 21d | 1 | 0.74mi |
| 2335 E Utopia Rd Unit 16 Phoenix, AZ | 3.0 | 2.5 | 1426 | $2,550 | $1.79 | 18d | 1 | 0.77mi |
| 2755 E Michigan Ave Phoenix, AZ | 3.0 | 2.0 | 1316 | $2,700 | $2.05 | 17d | 1 | 0.77mi |
| 17435 N 16th Pl Phoenix, AZ | 3.0 | 2.5 | 1614 | $2,280 | $1.41 | 20d | 1 | 0.80mi |
| 2336 E Utopia Rd Phoenix, AZ | 2.0–3.0 | 2.5 | 1327 | $2,395 | $1.80 | 5d | 1 | 0.80mi |
| 1920 E Bell Rd Phoenix, AZ | 2.0–3.0 | 2.0–2.5 | 1391 | $2,149 | $1.54 | 13d | 5 | 0.84mi |
| 1920 E Bell Rd Phoenix, AZ | 2.0–3.0 | 2.0–2.5 | 1391 | $2,039 | $1.47 | 2d | 3 | 0.84mi |
| 1920 E Bell Rd Phoenix, AZ | 2.0–3.0 | 2.0–2.5 | 1391 | $2,089 | $1.50 | 7d | 4 | 0.84mi |
| 18633 N 15th St Phoenix, AZ | 3.0 | 2.0 | 1240 | $2,249 | $1.81 | 7d | 1 | 0.84mi |
| 1506 E Wescott Dr Phoenix, AZ | 3.0 | 2.0 | 1136 | $2,045 | $1.80 | 5d | 1 | 0.90mi |
| 1440 E Renee Dr Phoenix, AZ | 3.0 | 2.0 | 1632 | $2,200 | $1.35 | 24d | 1 | 0.90mi |
| 1510 E Taro Ln Phoenix, AZ | 3.0 | 2.0 | 1136 | $2,149 | $1.89 | 24d | 1 | 0.93mi |
| 1702 E Bell Rd #180 Phoenix, AZ | 3.0 | 2.5 | 1358 | $2,000 | $1.47 | 24d | 1 | 0.94mi |
| 2104 E Behrend Dr Phoenix, AZ | 4.0 | 2.5 | 2070 | $2,975 | $1.44 | 2d | 1 | 0.97mi |
| 2737 E Hartford Ave Phoenix, AZ | 3.0 | 2.0 | 1875 | $2,885 | $1.54 | 24d | 1 | 0.99mi |
| 18626 N 29th Pl Phoenix, AZ | 4.0 | 2.0 | 1600 | $2,995 | $1.87 | 7d | 1 | 0.99mi |
| 2214 E Aire Libre Ave Phoenix, AZ | 3.0 | 2.0 | 1284 | $2,080 | $1.62 | 5d | 1 | 1.01mi |
| 16631 N 23rd Pl Phoenix, AZ | 3.0 | 2.0 | 1621 | $2,275 | $1.40 | 24d | 1 | 1.01mi |
| 16631 N 23rd Pl Phoenix, AZ | 3.0 | 2.0 | 1621 | $2,195 | $1.35 | 1d | 1 | 1.01mi |
| 1337 E Charleston Ave Phoenix, AZ | 3.0 | 2.5 | 1860 | $2,600 | $1.40 | 18d | 1 | 1.02mi |
| 1302 E Aire Libre Ave Unit 104 Phoenix, AZ | 3.0 | 2.0 | 1254 | $1,850 | $1.48 | 24d | 1 | 1.02mi |
| 1420 E Topeka Dr Phoenix, AZ | 3.0 | 2.5 | 1464 | $2,215 | $1.51 | 7d | 1 | 1.03mi |
| 19635 N Cave Creek Rd Phoenix, AZ | 3.0 | 1.0–2.0 | 999 | $1,933 | $1.93 | 1d | 22 | 1.04mi |
| 2022 E Wahalla Ln Phoenix, AZ | 5.0 | 3.0 | 2178 | $3,500 | $1.61 | 24d | 1 | 1.04mi |
Listing history 15 events
-
2026-06-18days on market $150,000 Active 92 DOM
-
2026-06-17days on market $150,000 Active 91 DOM
-
2026-06-16days on market $150,000 Active 90 DOM
-
2026-06-15days on market $150,000 Active 89 DOM
-
2026-06-13days on market $150,000 Active 87 DOM
-
2026-06-13days on market $150,000 Active 86 DOM
-
2026-06-09days on market $150,000 Active 83 DOM
-
2026-06-08days on market $150,000 Active 82 DOM
-
2026-06-07days on market $150,000 Active 81 DOM
-
2026-06-04days on market $150,000 Active 78 DOM
-
2026-06-03days on market $150,000 Active 77 DOM
-
2026-06-02days on market $150,000 Active 76 DOM
-
2026-06-01days on market $150,000 Active 75 DOM
-
2026-05-31days on market $150,000 Active 74 DOM
-
2026-03-17$150,000 Active 145-char remark
Show marketing remark (145 chars)
MOTIVATED SELLERS!! Step into your new home in Buffalo Rideg! This property offers a fantastic layout along with a great community and amenities!
ⓘ Source: listings_history table (triggers on properties + properties_extension) + one-shot
backfill from property_details.listing_events for pre-trigger history.
Nearby sold comps map
Loading sold comps map…
Walkable amenities ~0.75 mi
Loading nearby amenities…
Taxation est. · year 1
- Rental income
- $26,361
- − Mortgage interest
- −$8,402
- − Property taxes
- −$2,250
- − Insurance
- −$750
- − Repairs & maintenance
- −$2,109
- − Management
- −$2,109
- − Depreciation
- −$4,364
- Taxable income
- $6,377
- Est. tax owed @ 24.0%
- −$1,530
- After-tax cash flow
- $6,855/yr
For passive investors: Depreciation is non-cash, so a rental often shows a tax loss while cash-flowing — sheltering income. Rental losses are passive: they offset passive income freely, and up to $25,000/yr can offset ordinary (W-2) income if you actively participate and your MAGI is under $100k (phasing out to $0 by $150k); unused losses carry forward. On sale, claimed depreciation is recaptured at up to 25%, and gains may owe capital-gains tax (a 1031 exchange can defer both). Figures are a year-1 estimate at your 24.0% rate — not tax advice; consult a CPA.
Condition & rehab AI · 12 photos
This home is in good condition with a good layout and a great community. It has potential for further updates to increase its value.
Value-add opportunities
- Both Painting the exterior and interior walls — Fresh paint can enhance the curb appeal and interior aesthetics.
- Both Updating the flooring — New flooring can improve the overall look and feel of the home.
- Both Upgrading the kitchen appliances — Modern appliances can increase the home's appeal and value.
- Both Updating the bathrooms — Fresh bathrooms can improve the home's overall appeal and value.
- Both Landscaping improvements — A well-maintained landscape can enhance the home's curb appeal and value.
- Both HVAC system maintenance — A well-maintained HVAC system can improve comfort and energy efficiency, increasing the home's value.
- Both Interior lighting upgrades — Upgrading the lighting can improve the home's ambiance and value.
- Both Exterior lighting upgrades — Upgrading the exterior lighting can improve the home's curb appeal and safety.
Renovation cost estimate screening
Value-add ROI direction
- Both Painting the exterior and interior walls — Fresh paint can enhance the curb appeal and interior aesthetics. ↑
- Both Updating the flooring — New flooring can improve the overall look and feel of the home. ↑
- Both Upgrading the kitchen appliances — Modern appliances can increase the home's appeal and value. ↑
- Both Updating the bathrooms — Fresh bathrooms can improve the home's overall appeal and value. ↑
- Both Landscaping improvements — A well-maintained landscape can enhance the home's curb appeal and value. ↑
- Both HVAC system maintenance — A well-maintained HVAC system can improve comfort and energy efficiency, increasing the home's value. ↑
- Both Interior lighting upgrades — Upgrading the lighting can improve the home's ambiance and value. ↑
- Both Exterior lighting upgrades — Upgrading the exterior lighting can improve the home's curb appeal and safety. ↑
ⓘ Cost ranges are severity-bucket heuristics (US national rule-of-thumb). Get contractor quotes + a written scope before underwriting a rehab budget.
Schools (NCES district)
- District
- Paradise Valley Unified District (4241)
- NCES district ID
- 0405930
- Math proficiency
- 39% ▼ -11.00%
- Reading proficiency
- 46% ▼ -7.00%
- Median HH income
- $64,106
- Composite
- 37.89/100
- National rank
- #4316
- State rank
- #56 of 249 in AZ
Livability — Phoenix
- Score
- 75/100
- State rank
- #16
- US rank
- #3924
Category grades
Schools grade is shown separately in the Schools card above.
Census & demographics
- Census place
- Phoenix, AZ
- County
- Maricopa County · 4,537,380 people
- City population
- 1,500,198
- Metro
- Phoenix-Mesa-Chandler, AZ
- Population (ZIP)
- 53,811
- Household income
- $69,927
- Rent vs Own
- Severe rent burden
- 2976.0
Population outlook (Maricopa County) Hauer SSP2
- Today (2025)
- 4,979,203 people
- By 2030
- 5,378,229 · +8.0%
- By 2040
- 6,156,598 · +23.6%
- By 2050
- 6,872,376 · +38.0%
- By 2075
- 8,401,270 · +68.7%
- By 2100
- 9,247,439 · +85.7%
Race, ethnicity, and origin ACS 2023
- Neighborhood character
- Diverse neighborhood (Simpson 0.59)
- Race & ethnicity
- White 59% Hispanic / Latino 22% Two or more races 11% Black 10% Asian 3% Native American 3%
- Hispanic origin (detail)
- Mexican 18%
- Common ancestry
- Romanian 3% Lithuanian 2% Italian 1%
- Foreign-born
- 14% · Canada, China, Vietnam
- Languages at home
- 79% English-only · Spanish 13% Other Indo-European 2% Russian/Polish/Slavic 1%
Political lean MEDSL · Maricopa
- 2024 margin
- Toss-up / Even · D 47.7% · R 51.2% · Other 1.1%
- 2008→2024 swing
- +7.1pp toward D · 2008: -10.6pp · 2024: -3.5pp
- All cycles
- 2024: R+3.5 2020: D+2.2 2016: R+3.5 2012: R+12.0 2008: R+10.6
Not yet ingested
- Civics
- —
Market trends
- HPI YoY
- ▼ -329.75%
- Current HPI
- 313.5085
- Rent YoY
- ▼ -1.21%
- Metro
- Phoenix-Mesa-Chandler, AZ
- State GDP YoY
- ▲ 4.54%
- F500 in state
- 20
Industry mix (Fortune 500 HQ in AZ)
| Industry | F500 HQs | Revenue |
|---|---|---|
| Technology | 2 | $13B |
|
||
| Mining / Metals | 1 | $23B |
|
||
| Environmental Services | 1 | $16B |
|
||
| Metals / Steel | 1 | $14B |
|
||
| Technology Distribution | 1 | $9B |
|
||
| Homebuilding | 1 | $8B |
|
||
Price history
1 event — show timeline
- 2026-03-17 Listed $150,000 ARMLS
Cash-flow waterfall
monthlySold comps — $/sqft
last 12 mo · ≤1 miLoading sold comps…