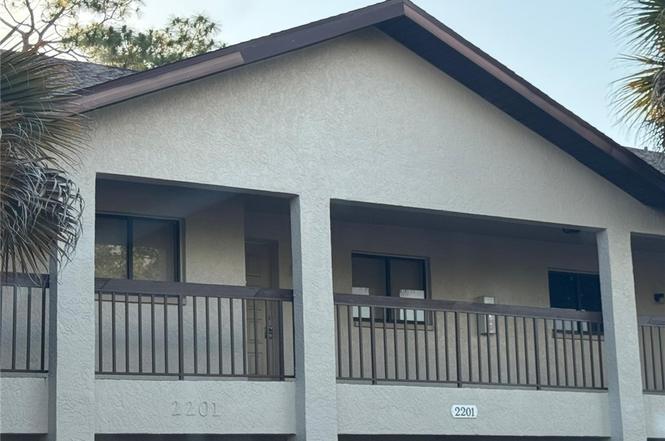
2201 E 5th St #23 · Lehigh Acres, FL
Flood risk 1/10 · Minimal
- FEMA flood zone
- X (unshaded)
- Chance of flooding over 30 yrs
- 0.0%
- Est. flood insurance / yr
- $507 – $1,088
Fire risk 1/10 · Minimal
- Est. fire insurance / yr
- $947 – $1,759
Heat risk 10/10 · Severe
- Hot days now (above 108°F)
- 7 days/yr
- Hot days in 30 yrs
- 29 days/yr
Wind risk 10/10 · Severe
- Chance of severe wind over 30 yrs
- 99.0%
Air-quality risk 2/10 · Minimal
- Unhealthy air days now
- 1 days/yr
- Unhealthy air days in 30 yrs
- 2 days/yr
Risk factors via First Street. Map © Google.
Why this score? — see what drove the D grade
The composite is a weighted blend of 9 inputs, each scored 0–100. Each bar is that input's sub-score; the figure is the points it added to the 100-point composite (weight × sub-score).
- Cash flow +11.7/30.0
- ARV discount +7.5/15.0
- 1% rule +6.2/10.0
- Schools +4.1/10.0
- DSCR +3.4/10.0
- Livability +3.0/5.0
- Condition / age +2.5/5.0
- Rent growth +2.3/5.0
- Appreciation +0.0/10.0
$130,000
🖨 Deal sheet (PDF) 📄 Offer letter ✓ Due diligence
Listing remarks MLS
Condo, unit on the second floor, 2 bedrooms and 2 baths tile floors, screened-in lanai with view to the Admiral Lehigh Golf Club and Resort, also features a swimming pool, and much more.
Key facts
- Assigned park
- Screened-in lanai
- Great view
Tags
Property features AI
Finance
- Financial info: Pets not allowed
- HOA & community: Homeowners association with quarterly fee; Association fee includes grounds maintenance, street lights and security; Community amenities: golf course, pool, management; Community of 30 units; Non-gated community with street lights
Exterior
- Parking: Assigned parking; Driveway; Guest parking; Paved parking; One assigned space
- Security: Smoke detector(s); Association provides security
- Utilities: Public water; Public sewer; Cable available
- Home design: 2-story property; Entry level: 2; Resale property; Faces east
- Construction: Block and concrete construction; Shingle roof
- Exterior features: Lanai; Porch; Screened porch; Community pool; West exposure; Has view
Interior
- Kitchen: Microwave; Range
- Bedrooms: Den; Screened porch
- Flooring: Tile
- Bathrooms: 2 full bathrooms
- Heating & cooling: Central heating (electric); Central air (electric)
- Interior features: Family/Dining room; Living/Dining room; Shower only; Separate shower; Walk-in closet(s); Split bedrooms; Unfurnished
- Laundry & utility: Inside laundry
Neighborhood map
What this means for you Summary
Snapshot
- This is a 2-bed/2.0-bath condo listed at $130k.
Deal economics
- At list price, monthly cash flow is $-38 ($-457/yr) — negative.
- To cash-flow at today's rent, offer at most $123k (5.2% below list).
- Meets the 1% rule at list price ($1k rent vs $130k).
- Recommended offer: $123k (5.2% below list) — sets the bar for cash-flow.
- Cap rate 5.9% vs local median 4.7% in Lehigh Acres — meaningfully above typical; check what's discounted (condition, days-on-market, listing class) to confirm the premium yield is real.
Location & tenants
- Location reads 59/100 on livability (#826 in FL) — a working-class tenant base; expect higher turnover. Strengths: cost of living A+, housing A+; Watch: crime C-, employment D+, amenities F.
- Lee (suburban): math 47% / reading 50% proficiency, ranked #42 of 73 in FL (top 58%) — families likely to look elsewhere, expect single-tenant / working-renter base with shorter leases.
- Zoned schools: Veterans Park Academy For The Arts (math 41% / reading 45%, grade F, #1,366 of 2,144 statewide, top 64%, 2,133 students, 36% FRL); Oak Hammock Middle School (math 43% / reading 41%, grade D-, #340 of 571 statewide, top 61%, 1,563 students, 56% FRL); Lehigh Senior High School (math 23% / reading 45%, grade F, #394 of 667 statewide, top 60%, 2,476 students, 57% FRL).
- Market conditions: Rents soft (-0.8%/yr); 644 active listings in the ZIP; 21 comparable units currently listed for rent nearby; rentals at typical pace (median 26d on market — plan ~3-4 weeks tenant-placement turnaround); 15,411 units permitted in Lee County in 2024 (4,686 in 5+ unit buildings).
- This rent runs 34% of the median local income ($51k/yr) — at the standard rent-burdened threshold; future hikes will face affordability resistance.
Forward outlook
- Local home prices are declining (-3.0%/yr); year-one equity from $899 of loan paydown is wiped out by about $4k of value loss. Plan a longer hold.
- Lee County population projected at +44% by 2050 — long-run rental-demand tailwind backs the buy-and-hold thesis.
Negotiation context
- Only 4 days on market — expect competitive offers; lowballing is unlikely to land.
- 12 sale attempts since 19y ago with the ask held roughly flat each time — persistent listings suggest the price (not the market) is what's stuck; bring a comps-based counter.
- Current owner paid $100k; 30% above their basis — modest negotiation headroom, anchor on the comps not their cost.
Risks & watch-outs
- Climate carrying-cost: severe wind risk, 99% chance of damaging wind over 30y; extreme-heat days projected 7→29/yr by 2055 (HVAC capex compounding) — expect insurance premiums to compound above CPI over the hold.
Questions for the listing agent
- What do current leases actually rent for vs. the listed asking? Can we see a recent rent roll and the last 12 months of T-12 income?
- What does the HOA fee cover, when was the last increase, and are there any pending special assessments or reserve-fund shortfalls?
- Any open or pending special assessments — roof, HVAC, plumbing, elevator, façade? What's the per-unit balance and payoff schedule, and is the seller paying it off at close or rolling it to the buyer?
- Is there a deadline driving the sale (1031 exchange, divorce, estate, relocation)? That informs how much negotiation room exists.
- Schools are D-rated, which usually means shorter tenancies and higher turnover. Who's the typical renter profile here, and what's been the actual vacancy rate?
- The area grade is low — what's the realistic commute time and amenity access for the typical tenant pool here? Any planned neighborhood developments (good or bad) we should know about?
- What's the average days-on-market for RENTAL listings here right now (not sales)? A rising rental-DOM trend means longer vacancies and softer asking-rent achievability than the comps imply.
- What's the recent tenant-quality profile in this submarket — average credit score on applications, eviction rate, late-payment / NSF rate, and stable-employment percentage? A property-management company in the area should have these aggregated.
- How much new apartment / multifamily construction is in the pipeline within 1–3 miles? Heavy new supply (>2% of stock underway) typically softens rents 12–24 months out; light construction supports rent growth.
Investment metrics
- 1% rule
- 1.12% ✓
- Cap rate
- 5.94%
- Cash-on-cash
- -1.26%
- DSCR
- 0.94
- GRM
- 7.5
CMA / ARV
No comps found within radius.
Projected returns pro-forma
-3.0% appreciation · 0.0% rent growth · sell at horizon
- IRR
- -22.8%
- Equity multiple
- 0.24×
- Total profit
- $-27,545
- Equity at exit
- $19,383
- IRR
- -33.1%
- Equity multiple
- -0.17×
- Total profit
- $-42,732
- Equity at exit
- $11,240
Cash invested: $36,400 (down + closing). Projections, not guarantees.
Landlord ↔ Tenant lean methodology
- Overall (STATE)
- 87 Strongly Landlord-Friendly
- State Florida
- 87 Strongly Landlord-Friendly · R+3
- County
- — inherits STATE
- City
- — inherits STATE
ZIP-level market 33936
- Home prices YoY
- -19.9%
- Rents YoY
- -0.8%
- Active inventory
- 644
- Price-to-rent
- 7.5×
Monthly cashflow live
- Estimated rent
- $1,450 high interval (Pro) →
- Mortgage (P&I)
- −$682
- Tax from tax record
- −$178 /mo · $2,131/yr
- Insurance
- −$54
- HOA
- −$270
- Vacancy / Maint / Mgmt
- −$304
- Net cashflow
- $-38
Break-even live
Sensitivity live
| Price | -10% $35 | -5% $-1 | +0% $-38 | +5% $-75 | +10% $-112 |
|---|---|---|---|---|---|
| Rent | -10% $-153 | -5% $-95 | +0% $-38 | +5% $19 | +10% $76 |
| Rate | -1.0pp $27 | -0.5pp $-5 | base $-38 | +0.5pp $-72 | +1.0pp $-106 |
UW: 25.0% down · 7.5% · 30yr · 1.5% tax · 5.0% vac · 8.0% maint · 8.0% mgmt
Financing live
Cash to close
- Down payment
- $32,500
- Closing costs
- $3,900
- Reserves months
- —
- Total cash needed
- —
Loan-product check · same deal, 3 products live
Conventional
25% down · 7.5% · 30yr
- Down + closing
- —
- Monthly P&I
- —
- Monthly cashflow
- —
- DSCR
- —
- Eligible?
- —
Personal DTI + credit; lowest rate.
DSCR
20% down · 8.5% · 30yr
- Down + closing
- —
- Monthly P&I
- —
- Monthly cashflow
- —
- DSCR
- —
- Eligible?
- —
No personal income docs; deal must DSCR.
Hard money
10% down · 12.0% · 12mo
- Down + closing
- —
- Monthly P&I
- —
- Monthly cashflow
- —
- DSCR
- —
- Eligible?
- —
Short-term bridge; refi at stabilization.
Rent comps 21 comps
| Address | Beds | Baths | Sqft | Rent | $/sqft | DOM | Units | Dist |
|---|---|---|---|---|---|---|---|---|
| 2201 E 5th St #23 Lehigh Acres, FL | 2.0 | 2.0 | 1011 | $1,300 | $1.29 | 5d | 1 | 0.03mi |
| 322 Edward Ave Lehigh Acres, FL | 2.0 | 2.0 | 1347 | $1,400 | $1.04 | 5d | 1 | 0.17mi |
| 2213 Gardenia Way Lehigh Acres, FL | 2.0 | 1.5 | 900 | $1,740 | $1.93 | 25d | 1 | 0.19mi |
| 525 Glendale Ave Unit 529 Lehigh Acres, FL | 3.0 | 2.0 | 1459 | $1,695 | $1.16 | 25d | 1 | 0.24mi |
| 343 Joel Blvd #111 Lehigh Acres, FL | 2.0 | 2.0 | 921 | $900 | $0.98 | 25d | 1 | 0.25mi |
| 333 Joel Blvd Lehigh Acres, FL | 2.0 | 1.0–2.0 | 877 | $1,048 | $1.19 | 18d | 2 | 0.33mi |
| 321 Dania St Lehigh Acres, FL | 2.0 | 2.0 | 915 | $1,800 | $1.97 | 25d | 1 | 0.56mi |
| 621 Joel Blvd Unit 102 Lehigh Acres, FL | 2.0 | 2.0 | 1200 | $1,300 | $1.08 | 25d | 1 | 0.60mi |
| 426 Hamilton Ave Lehigh Acres, FL | 3.0 | 2.0 | 1354 | $1,800 | $1.33 | 16d | 1 | 0.63mi |
| 732 Joel Blvd Lehigh Acres, FL | 2.0 | 2.0 | 788 | $1,200 | $1.52 | 25d | 1 | 0.81mi |
| 738 Joel Blvd Lehigh Acres, FL | 2.0 | 2.0 | 968 | $1,050 | $1.08 | 25d | 1 | 0.81mi |
| 198 Joel Blvd #6 Lehigh Acres, FL | 2.0 | 2.0 | 1036 | $1,200 | $1.16 | 5d | 1 | 0.86mi |
| 1601 E 7th St Lehigh Acres, FL | 3.0 | 2.0 | 1197 | $1,650 | $1.38 | 25d | 1 | 0.88mi |
| 704 Broadway Ave Unit 1 Lehigh Acres, FL | 3.0 | 2.0 | 1197 | $1,650 | $1.38 | 18d | 1 | 0.90mi |
| 1204 E 6th St Lehigh Acres, FL | 3.0 | 2.0 | 1196 | $1,825 | $1.53 | 5d | 1 | 0.98mi |
| 347 Richland Rd Lehigh Acres, FL | 2.0 | 2.0 | 1040 | $1,150 | $1.11 | 25d | 1 | 1.05mi |
| 241 Thistle Ct Lehigh Acres, FL | 2.0 | 2.0 | 1376 | $1,195 | $0.87 | 25d | 1 | 1.15mi |
| 609 Maple Ave N Lehigh Acres, FL | 3.0 | 2.0 | 1497 | $2,050 | $1.37 | 25d | 1 | 1.25mi |
| 1101 Leeland Heights Blvd E Lehigh Acres, FL | 3.0 | 2.0 | 1250 | $1,350 | $1.08 | 18d | 1 | 1.35mi |
| 3803 E 6th St Lehigh Acres, FL | 3.0 | 2.0 | 1100 | $1,485 | $1.35 | 25d | 1 | 1.38mi |
| 913 Canton Ave Lehigh Acres, FL | 3.0 | 2.0 | 1180 | $1,600 | $1.36 | 23d | 1 | 1.47mi |
HOA detail condo
- Monthly dues
- $270 · $3,240/yr
- Likely covers
- pool
- Assessments
- None detected in remarks — confirm with the listing agent.
Listing history 3 events
-
2026-06-22days on market $130,000 Active 4 DOM
-
2026-06-17remarks 340-char remark
-
2026-06-17$130,000 Active 1 DOM
ⓘ Source: listings_history table (triggers on properties + properties_extension) + one-shot
backfill from property_details.listing_events for pre-trigger history.
Tax reassessment forecast FL · Resets to sale price
- Current annual tax
- $2,131 · $178/mo
- Projected year-2 tax
- $2,131 · $178/mo
- Expected delta
- $0/yr ($0/mo · 0.0%)
ⓘ Screening estimate from a state-policy table — verify with the county assessor before closing.
Climate risk First Street
- Flood 1/10 Low FEMA zone X (unshaded) · 0% chance over 30 yrs
- Wildfire 1/10 Low
- Heat 10/10 Extreme 7 d/yr ≥108°F today · 29 d/yr by 30 yrs out
- Wind 10/10 Extreme 99% chance of damaging wind over 30 yrs
- Air quality 2/10 Low 1 unhealthy d/yr today · 2 by 30 yrs out
Nearby sold comps map
Loading sold comps map…
Walkable amenities ~0.75 mi
Loading nearby amenities…
Taxation est. · year 1
- Rental income
- $17,397
- − Mortgage interest
- −$7,282
- − Property taxes
- −$2,131
- − Insurance
- −$650
- − Repairs & maintenance
- −$1,392
- − Management
- −$1,392
- − HOA
- −$3,240
- − Depreciation
- −$3,782
- Taxable loss
- −$2,471
- Est. tax savings @ 24.0%
- +$593
- After-tax cash flow
- $135/yr
For passive investors: Depreciation is non-cash, so a rental often shows a tax loss while cash-flowing — sheltering income. Rental losses are passive: they offset passive income freely, and up to $25,000/yr can offset ordinary (W-2) income if you actively participate and your MAGI is under $100k (phasing out to $0 by $150k); unused losses carry forward. On sale, claimed depreciation is recaptured at up to 25%, and gains may owe capital-gains tax (a 1031 exchange can defer both). Figures are a year-1 estimate at your 24.0% rate — not tax advice; consult a CPA.
Schools (NCES district)
- District
- Lee
- NCES district ID
- 1201080
- Math proficiency
- 47% ▼ -11.00%
- Reading proficiency
- 50% ▼ -4.00%
- Median HH income
- $49,518
- Composite
- 41.49/100
- National rank
- #3458
- State rank
- #42 of 73 in FL
Livability — Lehigh Acres
- Score
- 59/100
- State rank
- #826
- US rank
- #20055
Category grades
Schools grade is shown separately in the Schools card above.
Census & demographics
- Census place
- Lehigh Acres, FL
- County
- Lee County · 788,662 people
- City population
- 130,638
- Metro
- Cape Coral-Fort Myers, FL
- Population (ZIP)
- 27,967
- Household income
- $51,417
- Rent vs Own
- Severe rent burden
- 1027.0
Population outlook (Lee County) Hauer SSP2
- Today (2025)
- 871,946 people
- By 2030
- 955,468 · +9.6%
- By 2040
- 1,113,587 · +27.7%
- By 2050
- 1,256,891 · +44.1%
- By 2075
- 1,560,270 · +78.9%
- By 2100
- 1,726,848 · +98.0%
Race, ethnicity, and origin ACS 2023
- Neighborhood character
- Diverse neighborhood (Simpson 0.63)
- Race & ethnicity
- Hispanic / Latino 44% White 41% Two or more races 21% Black 9% Asian 1%
- Hispanic origin (detail)
- Mexican 7% Puerto Rican 9% Cuban 18% Dominican 2%
- Common ancestry
- Hispanic 3% Romanian 2% Lithuanian 1%
- Foreign-born
- 28% · Canada, Jamaica
- Languages at home
- 59% English-only · Spanish 36% French/Haitian/Cajun 3% Tagalog/Filipino 1%
Political lean MEDSL · Lee
- 2024 margin
- Strong R (+28.4) · D 35.5% · R 63.9%
- 2008→2024 swing
- -18.0pp toward R · 2008: -10.4pp · 2024: -28.4pp
- All cycles
- 2024: R+28.4 2020: R+19.2 2016: R+20.4 2012: R+16.6 2008: R+10.4
Not yet ingested
- Civics
- —
Market trends
- HPI YoY
- ▼ -86.78%
- Current HPI
- 348.8631
- Rent YoY
- ▼ -0.77%
- Metro
- Cape Coral-Fort Myers, FL
- State GDP YoY
- ▲ 3.28%
- F500 in state
- 36
Industry mix (Fortune 500 HQ in FL)
| Industry | F500 HQs | Revenue |
|---|---|---|
| Industrial Technology | 2 | $29B |
|
||
| Insurance | 2 | $17B |
|
||
| Retail | 1 | $60B |
|
||
| Technology Distribution | 1 | $58B |
|
||
| Homebuilding | 1 | $35B |
|
||
| Technology Manufacturing | 1 | $35B |
|
||
Price history
-90.0% since first listed37 events — show timeline
- 2026-06-17 Listed $130,000 FORTMLS
- 2026-06-12 Price Changed $1,300 NAPLESMLS
- 2026-06-07 Price Changed $1,350 NAPLESMLS
- 2026-06-03 Price Changed $1,300 NAPLESMLS
- 2026-05-31 Rental Removed $1,270 FORTMLS
- 2026-05-30 Listed for Rent $1,270 FORTMLS
- 2026-05-28 Price Changed $1,200 NAPLESMLS
- 2026-05-20 Rental Removed $1,350 FGCMLS
- 2026-05-20 Listed for Rent $1,350 FGCMLS
- 2026-05-20 Sold (Public Records) $100,000 Public Records
- 2026-05-15 Listed for Rent $1,350 NAPLESMLS
- 2026-05-14 Sold (MLS) $100,000 FORTMLS
- 2026-04-21 Pending — FORTMLS
- 2026-04-15 Listed $119,900 FORTMLS
- 2021-09-16 Listing Removed — FORTMLS
- 2021-08-02 Relisted — FORTMLS
- 2021-08-02 Price Changed $91,000 FORTMLS
- 2021-07-18 Pending — FORTMLS
- 2020-08-20 Listed $86,000 FORTMLS
- 2020-07-31 Listing Removed — FORTMLS
- 2020-03-25 Listed $86,000 FORTMLS
- 2020-01-31 Listing Removed — FORTMLS
- 2019-12-12 Price Changed $99,000 FORTMLS
- 2019-11-14 Relisted — FORTMLS
- 2019-11-08 Listing Removed — FORTMLS
- 2019-10-20 Listed $115,000 FORTMLS
- 2019-06-30 Listing Removed — FORTMLS
- 2019-02-07 Listed $109,900 FORTMLS
- 2010-05-27 Price Changed $19,900 FORTMLS
- 2010-05-26 Sold (MLS) $18,500 FORTMLS
- 2007-07-11 Listing Removed — FORTMLS
- 2007-04-11 Listed $134,900 FORTMLS
- 2005-10-12 Sold (Public Records) $116,000 Public Records
- 2003-07-18 Sold (Public Records) $76,000 Public Records
- 2003-06-23 Sold (MLS) $76,000 FORTMLS
- 2003-06-22 Price Changed $79,900 FORTMLS
- 2002-02-21 Sold (Public Records) $1,300,000 Public Records
Property tax history
+14.4%/yrLatest (2025): $2,131 · +10.9% YoY. Source: county tax records.
Cash-flow waterfall
monthlySold comps — $/sqft
last 12 mo · ≤1 miLoading sold comps…