 Multi-family
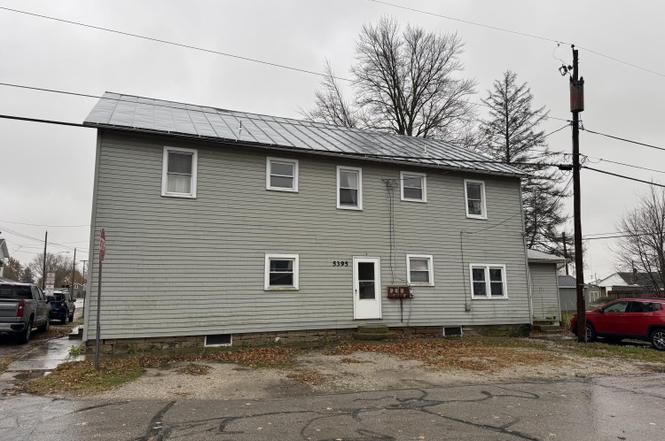
5395 Bucyrus St · North Robinson, OH
Flood risk 1/10 · Minimal
- FEMA flood zone
- X (unshaded)
- Chance of flooding over 30 yrs
- 0.0%
- Est. flood insurance / yr
- $507 – $1,088
Fire risk 1/10 · Minimal
- Est. fire insurance / yr
- $713 – $1,323
Heat risk 3/10 · Minor
- Hot days now (above 98°F)
- 7 days/yr
- Hot days in 30 yrs
- 17 days/yr
Wind risk 2/10 · Minimal
- Chance of severe wind over 30 yrs
- —
Air-quality risk 2/10 · Minimal
- Unhealthy air days now
- 1 days/yr
- Unhealthy air days in 30 yrs
- 1 days/yr
Risk factors via First Street. Map © Google.
Why this score? — see what drove the C+ grade
The composite is a weighted blend of 9 inputs, each scored 0–100. Each bar is that input's sub-score; the figure is the points it added to the 100-point composite (weight × sub-score).
- Cash flow +25.8/30.0
- DSCR +8.6/10.0
- ARV discount +7.5/15.0
- 1% rule +6.4/10.0
- Schools +5.2/10.0
- Livability +3.1/5.0
- Rent growth +2.5/5.0
- Condition / age +2.5/5.0
- Appreciation +0.0/10.0
$124,900
🖨 Deal sheet 📄 Offer letter ✓ Due diligence
Multi-family units
County records classify this as Multi-Family (5+ Unit). Listing-text estimate: 1 unit. estimate disagrees with records
5+ unit building — per-unit beds/baths from public records are typically unavailable; the breakdown below (if shown) is an estimate from the listing text.
Key facts
- Gas forced-air heat
- Separate utilities
- Quadplex
Tags
Neighborhood map
What this means for you Summary
Snapshot
- This is a 7-bed/7.5-bath multifamily listed at $125k.
Deal economics
- At list price, monthly cash flow is $304 ($4k/yr) — positive.
- The deal already cash-flows at list — no discount required.
- Meets the 1% rule at list price ($1k rent vs $125k).
- Recommended offer: $121k (3.0% below list) — sets the bar for market timing.
Location & tenants
- Location reads 62/100 on livability (#906 in OH) — a middle-class / working-renter tenant base. Strengths: cost of living A+, housing A+; Watch: crime D, amenities F, commute F.
- Colonel Crawford Local (rural): math 52% / reading 70% proficiency, ranked #273 of 656 in OH (top 42%) — acceptable for families but not a draw, mixed tenant base, ~2y average lease.
- Market conditions: 21 active listings in the ZIP; 8 units permitted in Crawford County in 2024 (0 in 5+ unit buildings).
- This rent runs 32% of the median local income ($53k/yr) — at the standard rent-burdened threshold; future hikes will face affordability resistance.
Forward outlook
- Local home prices are declining (-3.0%/yr); year-one equity from $864 of loan paydown is wiped out by about $4k of value loss. Plan a longer hold.
- Crawford County population projected at -22% by 2050 — secular population decline; favor cash flow + early exit over multi-decade hold.
Negotiation context
- It's been on market 60 days — a 3% lower offer ($121k) is reasonable based on typical stale-listing flexibility.
- 2 sale attempts; this cycle's ask is 738% above the opening price — seller raised mid-cycle; expect resistance to lowballs.
- Current owner paid $72k; list at $125k implies a 73% gain — meaningful room to come down on a strong offer.
Risks & watch-outs
- Watch-outs: built in 1920 — expect roof / HVAC / electrical / plumbing capex.
Questions for the listing agent
- It's been on market 60 days. Have you received any prior offers? Is the seller open to a 3% concession, seller financing, or rate buy-down credit?
- Built in 1920 — when were the roof, HVAC, electrical panel, plumbing, and water heater last replaced?
- Is there a deadline driving the sale (1031 exchange, divorce, estate, relocation)? That informs how much negotiation room exists.
- Crime grade is D in this area — have there been break-ins, vandalism, or insurance claims at this property in the last 3 years? What carrier currently insures it and at what premium?
- What's the average days-on-market for RENTAL listings here right now (not sales)? A rising rental-DOM trend means longer vacancies and softer asking-rent achievability than the comps imply.
- What's the recent tenant-quality profile in this submarket — average credit score on applications, eviction rate, late-payment / NSF rate, and stable-employment percentage? A property-management company in the area should have these aggregated.
- How much new apartment / multifamily construction is in the pipeline within 1–3 miles? Heavy new supply (>2% of stock underway) typically softens rents 12–24 months out; light construction supports rent growth.
Investment metrics
- 1% rule
- 1.14% ✓
- Cap rate
- 9.21%
- Cash-on-cash
- 10.44%
- DSCR
- 1.46
- GRM
- 7.3
CMA / ARV
No comps found within radius.
Projected returns pro-forma
-3.0% appreciation · 3.0% rent growth · sell at horizon
- IRR
- -0.7%
- Equity multiple
- 0.98×
- Total profit
- $-872
- Equity at exit
- $18,623
- IRR
- 9.0%
- Equity multiple
- 1.69×
- Total profit
- $24,168
- Equity at exit
- $10,799
Cash invested: $34,972 (down + closing). Projections, not guarantees.
Landlord ↔ Tenant lean methodology
- Overall (STATE)
- 73 Landlord-Friendly
- State Ohio
- 73 Landlord-Friendly · R+6
- County
- — inherits STATE
- City
- — inherits STATE
ZIP-level market 44827
- Home prices YoY
- -23.6%
- Active inventory
- 21
- Price-to-rent
- 7.3×
Monthly cashflow live
- Estimated rent
- $1,425 medium interval (Pro) →
- Mortgage (P&I)
- −$655
- Tax from tax record
- −$115 /mo · $1,379/yr
- Insurance
- −$52
- HOA
- −$0
- Vacancy / Maint / Mgmt
- −$299
- Net cashflow
- $304
Break-even live
UW: 25.0% down · 7.5% · 30yr · 1.5% tax · 5.0% vac · 8.0% maint · 8.0% mgmt
Financing live
Cash to close
- Down payment
- $31,225
- Closing costs
- $3,747
- Reserves months
- —
- Total cash needed
- —
Loan-product check · same deal, 3 products live
Conventional
25% down · 7.5% · 30yr
- Down + closing
- —
- Monthly P&I
- —
- Monthly cashflow
- —
- DSCR
- —
- Eligible?
- —
Personal DTI + credit; lowest rate.
DSCR
20% down · 8.5% · 30yr
- Down + closing
- —
- Monthly P&I
- —
- Monthly cashflow
- —
- DSCR
- —
- Eligible?
- —
No personal income docs; deal must DSCR.
Hard money
10% down · 12.0% · 12mo
- Down + closing
- —
- Monthly P&I
- —
- Monthly cashflow
- —
- DSCR
- —
- Eligible?
- —
Short-term bridge; refi at stabilization.
Listing history 7 events
-
2026-02-02soldstatus $72,000
-
2026-01-19status Pending
-
2026-01-06price $124,900
-
2025-12-16status Active
-
2025-12-08status Pending
-
2025-11-12price $149,900
-
2025-11-12$14,900 Active
ⓘ Source: listings_history table (triggers on properties + properties_extension) + one-shot
backfill from property_details.listing_events for pre-trigger history.
Tax reassessment forecast OH · Partial reset (capped growth)
- Current annual tax
- $1,379 · $115/mo
- Projected year-2 tax
- $1,664 · $139/mo
- Expected delta
- +$285/yr (+$24/mo · 20.6%)
ⓘ Screening estimate from a state-policy table — verify with the county assessor before closing.
Climate risk First Street
- Flood 1/10 Low FEMA zone X (unshaded) · 0% chance over 30 yrs
- Wildfire 1/10 Low
- Heat 3/10 Moderate 7 d/yr ≥98°F today · 17 d/yr by 30 yrs out
- Wind 2/10 Low
- Air quality 2/10 Low 1 unhealthy d/yr today · 1 by 30 yrs out
Nearby sold comps map
Loading sold comps map…
Walkable amenities ~0.75 mi
Loading nearby amenities…
Taxation est. · year 1
- Rental income
- $17,105
- − Mortgage interest
- −$6,996
- − Property taxes
- −$1,379
- − Insurance
- −$624
- − Repairs & maintenance
- −$1,368
- − Management
- −$1,368
- − Depreciation
- −$3,633
- Taxable income
- $1,735
- Est. tax owed @ 24.0%
- −$416
- After-tax cash flow
- $3,233/yr
For passive investors: Depreciation is non-cash, so a rental often shows a tax loss while cash-flowing — sheltering income. Rental losses are passive: they offset passive income freely, and up to $25,000/yr can offset ordinary (W-2) income if you actively participate and your MAGI is under $100k (phasing out to $0 by $150k); unused losses carry forward. On sale, claimed depreciation is recaptured at up to 25%, and gains may owe capital-gains tax (a 1031 exchange can defer both). Figures are a year-1 estimate at your 24.0% rate — not tax advice; consult a CPA.
Schools (NCES district)
- District
- Colonel Crawford Local
- NCES district ID
- 3904651
- Math proficiency
- 52% ▼ -17.00%
- Reading proficiency
- 70% ▼ -1.00%
- Median HH income
- $52,712
- Composite
- 52.09/100
- National rank
- #1628
- State rank
- #273 of 656 in OH
Livability — North Robinson
- Score
- 62/100
- State rank
- #906
- US rank
- #17128
Category grades
Schools grade is shown separately in the Schools card above.
Census & demographics
- Census place
- North Robinson, OH
- County
- Crawford · 26,873 people
- City population
- 123
- Population (ZIP)
- 7,009
- Household income
- $53,089
- Rent vs Own
- Severe rent burden
- 17.0
Population outlook (Crawford County) Hauer SSP2
- Today (2025)
- 39,421 people
- By 2030
- 37,656 · -4.5%
- By 2040
- 34,043 · -13.6%
- By 2050
- 30,617 · -22.3%
- By 2075
- 23,652 · -40.0%
- By 2100
- 17,786 · -54.9%
Race, ethnicity, and origin ACS 2023
- Neighborhood character
- Predominantly White (93%)
- Race & ethnicity
- White 93% Two or more races 4% Hispanic / Latino 2%
- Common ancestry
- Slovak 2% English 2% Romanian 2%
- Foreign-born
- 2% · China, Vietnam
Political lean MEDSL · Crawford
- 2024 margin
- Solid R (+53.0) · D 23.1% · R 76.1%
- 2008→2024 swing
- -33.9pp toward R · 2008: -19.0pp · 2024: -53.0pp
- All cycles
- 2024: R+53.0 2020: R+50.9 2016: R+46.8 2012: R+22.7 2008: R+19.0
Not yet ingested
- Civics
- —
Market trends
- HPI YoY
- ▼ -82.15%
- Current HPI
- 265.55
- Rent YoY
- —
- Metro
- —
- State GDP YoY
- ▲ 1.98%
- F500 in state
- 48
Industry mix (Fortune 500 HQ in OH)
| Industry | F500 HQs | Revenue |
|---|---|---|
| Insurance | 3 | $145B |
|
||
| Industrial Machinery | 3 | $49B |
|
||
| Financial Services | 3 | $24B |
|
||
| Consumer Goods | 2 | $93B |
|
||
| Aerospace / Defense | 2 | $47B |
|
||
| Utilities | 2 | $33B |
|
||
Price history
+383.2% since first listed7 events — show timeline
- 2026-02-02 Sold (Public Records) $72,000 Public Records
- 2026-01-19 Pending — NORIS
- 2026-01-06 Price Changed $124,900 NORIS
- 2025-12-16 Relisted — NORIS
- 2025-12-08 Pending — NORIS
- 2025-11-12 Price Changed $149,900 NORIS
- 2025-11-12 Listed $14,900 NORIS
Property tax history
+2.6%/yrLatest (2025): $1,379 · -0.6% YoY. Source: county tax records.
Cash-flow waterfall
monthlySold comps — $/sqft
last 12 mo · ≤1 miLoading sold comps…