 Triplex
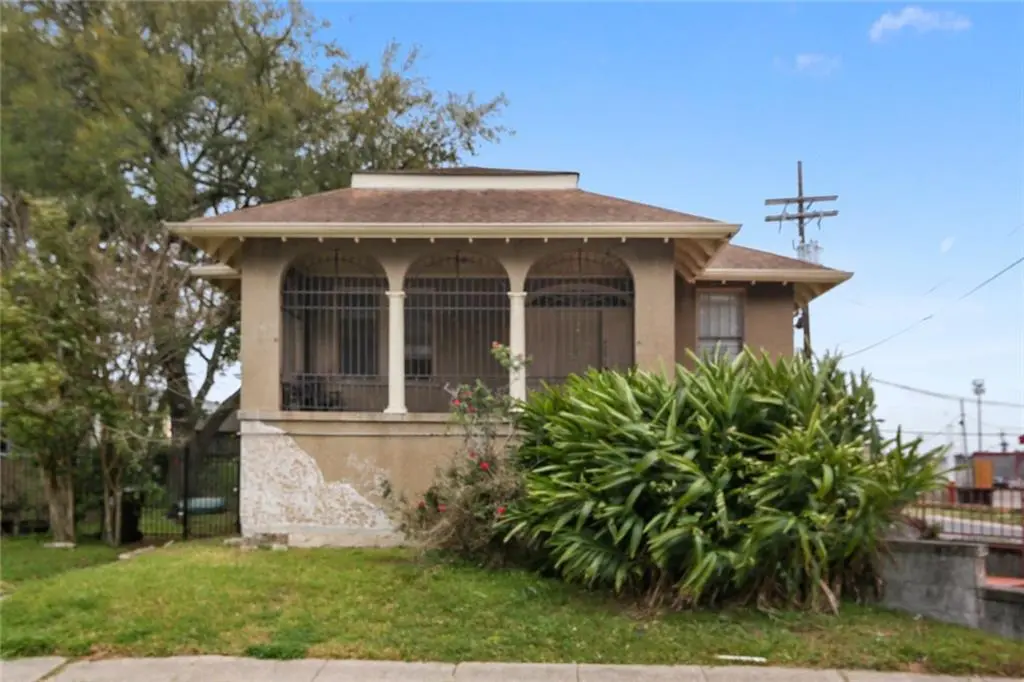
4001 Elba St · New Orleans, LA
Flood risk 8/10 · Major
- FEMA flood zone
- AE
- Chance of flooding over 30 yrs
- 0.78%
- Est. flood insurance / yr
- $1,737 – $8,500
Fire risk 1/10 · Minimal
- Est. fire insurance / yr
- $1,269 – $2,357
Heat risk 10/10 · Severe
- Hot days now (above 108°F)
- 7 days/yr
- Hot days in 30 yrs
- 21 days/yr
Wind risk 10/10 · Severe
- Chance of severe wind over 30 yrs
- 99.0%
Air-quality risk 4/10 · Minor
- Unhealthy air days now
- 4 days/yr
- Unhealthy air days in 30 yrs
- 4 days/yr
Risk factors via First Street. Map © Google.
Why this score? — see what drove the B+ grade
The composite is a weighted blend of 9 inputs, each scored 0–100. Each bar is that input's sub-score; the figure is the points it added to the 100-point composite (weight × sub-score).
- Cash flow +30.0/30.0
- ARV discount +15.0/15.0
- 1% rule +10.0/10.0
- DSCR +10.0/10.0
- Livability +4.0/5.0
- Rent growth +2.7/5.0
- Condition / age +2.5/5.0
- Schools +1.6/10.0
- Appreciation +0.0/10.0
$239,000
🖨 Deal sheet (PDF) 📄 Offer letter ✓ Due diligence
Multi-family units
County records classify this as Multi-Family (2-4 Unit). Listing-text estimate: 3 units. confirmed
Listing remarks MLS
Rare opportunity to own a large TRIPLEX located in Broadmoor on a CORNER lot with PARKING! Charming FRONT PORCH has arches, wrought iron & original basket weave pattern tiles. 1st floor with 9-1/2 ft CEILINGS & 7 ft down. INCLUDES driveway, storage & garage with side & rear yards. SPACIOUS apartments with stoves, refrigerators and indoor washers & dryers for EACH apartment (Seller does not warranty any of the appliances/sold as is & will not repair nor replace.). UNIT C is rented thru March 1st with some repairs needed, the other 2 units are vacant & partially gutted. See attached HISTORIC TAX CREDIT Pre-approval letter for renovation option. Assumable flood insurance @ $1,843. UTILITIES: 3 independent electric meters, 1 water meter, 1 gas meter (gas billed to Apt B). Apt B & C share 1 HWH. Apt A: all electric with CENTRAL AC/heat. Apt B & C window units with gas: wall heaters, stoves & HWHs. All info to be verified. Ai VIRTUAL renovated & staged images are attached in photo gallery - photos are for examples only. Property sold AS IS.
Key facts
- Central ac
- Large triplex
- Front porch
Tags
Neighborhood map
What this means for you Summary
Snapshot
- This is a 3 × 2-bed/1.3-bath units multifamily listed at $239k.
Deal economics
- At list price, monthly cash flow is $2k ($24k/yr) — positive. Per door: $657/mo.
- The deal already cash-flows at list — no discount required.
- Meets the 1% rule at list price ($5k rent vs $239k).
- Recommended offer: $210k (12.0% below list) — sets the bar for market timing.
- Cap rate 18.3% vs local median 4.4% in New Orleans — top-decile yield for the area; either an underpriced asset or a hidden risk that comps aren't pricing in. Stress-test before assuming the spread holds.
Location & tenants
- Location reads 81/100 on livability (#3 in LA, #1,383 nationally) — a professional / high-income tenant draw. Strengths: amenities A+, commute A+, health & safety A+; Watch: crime C-, employment D.
- Orleans Parish (urban): math 11% / reading 27% proficiency, ranked #69 of 98 in LA (top 70%) — low school quality limits family demand, transient renter base, plan for 1-2y turnover; 68% free/reduced lunch — lower-income household profile, screen leases tightly.
- Zoned schools: Benjamin Franklin Elem. Math And Science (math 12% / reading 23%, grade F, #479 of 646 statewide, top 75%, 747 students, 98% FRL, charter) — zoned schools average 98% FRL vs 68% district-wide (30 pts higher); higher-poverty schools than district average — tighter screening recommended.
- Market conditions: Rents flat; 219 active listings in the ZIP; 10 comparable units currently listed for rent nearby; rentals at typical pace (median 25d on market — plan ~3-4 weeks tenant-placement turnaround); 40% of comp listings sitting > 30 days — soft ceiling on asking rent; 710 units permitted in Orleans Parish in 2024 (244 in 5+ unit buildings).
Forward outlook
- Local home prices are declining (-3.0%/yr); year-one equity from $2k of loan paydown is wiped out by about $7k of value loss. Plan a longer hold.
- Orleans County population projected at +61% by 2050 — long-run rental-demand tailwind backs the buy-and-hold thesis.
- At projected returns (-3.0% appreciation + 0.7% rent growth), your $67k cash investment doubles in ~4 years — after that, you're playing with house money.
Negotiation context
- It's been on market 159 days — a 12% lower offer ($210k) is reasonable based on typical stale-listing flexibility.
- 5 sale attempts since 4y ago with the ask held roughly flat each time — persistent listings suggest the price (not the market) is what's stuck; bring a comps-based counter.
- Current owner paid $50k; list at $239k implies a 378% gain — meaningful room to come down on a strong offer.
Risks & watch-outs
- Watch-outs: flood insurance adds $427/mo; built in 1950 — expect roof / HVAC / electrical / plumbing capex.
- Climate carrying-cost: in FEMA flood zone AE (mandatory federal flood insurance); severe wind risk, 99% chance of damaging wind over 30y; extreme-heat days projected 7→21/yr by 2055 (HVAC capex compounding) — expect insurance premiums to compound above CPI over the hold.
Questions for the listing agent
- It's been on market 159 days. Have you received any prior offers? Is the seller open to a 12% concession, seller financing, or rate buy-down credit?
- Can we see the unit-by-unit rent roll, current vacancy, and any below-market leases? What's the average tenancy length?
- What capital expenditures (roof, boiler, parking lot, exteriors) have been made in the last 5 years, and what's planned in the next 2?
- Built in 1950 — when were the roof, HVAC, electrical panel, plumbing, and water heater last replaced?
- What's the actual annual flood-insurance premium (NFIP or private), and is the property in a SFHA with mandatory coverage?
- Why hasn't it sold? Are there any deal-killer items the seller is aware of (foundation, flood, title, zoning, code violations)?
- Is there a deadline driving the sale (1031 exchange, divorce, estate, relocation)? That informs how much negotiation room exists.
- What's the average days-on-market for RENTAL listings here right now (not sales)? A rising rental-DOM trend means longer vacancies and softer asking-rent achievability than the comps imply.
- What's the recent tenant-quality profile in this submarket — average credit score on applications, eviction rate, late-payment / NSF rate, and stable-employment percentage? A property-management company in the area should have these aggregated.
- How much new apartment / multifamily construction is in the pipeline within 1–3 miles? Heavy new supply (>2% of stock underway) typically softens rents 12–24 months out; light construction supports rent growth.
Investment metrics
- 1% rule
- 2.14% ✓
- Cap rate
- 18.33%
- Cash-on-cash
- 43.01%
- DSCR
- 2.91
- GRM
- 3.9
CMA / ARV
- ARV (median comp)
- $411,092
- List price
- $239,000
- Delta
- -41.86%
- Verdict
- UNDERPRICED
- Comps
- 20 within 1.0 mi
Show comp detail 3 sales within ~0.75 mi
| Address | Dist | Beds/Ba | Sqft | Sold | Price | $/sf | Match |
|---|---|---|---|---|---|---|---|
| 3214 16 Washington St | 0.56mi | 4/3.0 | 4,488 (+10%) | 3mo | $106,000 | $24 | 55 |
| 4536 38 S Miro St | 0.48mi | 5/4.0 (+1) | 3,746 (-8%) | 4mo | $450,000 | $120 | 52 |
| 3109 11 Jefferson Ave | 0.72mi | 4/2.0 | 3,561 (-13%) | 5mo | $427,000 | $120 | 37 |
Match score weights: distance 35% · size 25% · config 20% · recency 20%. Top-matched comps best support the ARV.
Projected returns pro-forma
-3.0% appreciation · 0.73% rent growth · sell at horizon
- IRR
- 28.1%
- Equity multiple
- 2.13×
- Total profit
- $75,778
- Equity at exit
- $35,636
- IRR
- 34.1%
- Equity multiple
- 3.75×
- Total profit
- $184,321
- Equity at exit
- $20,664
Cash invested: $66,920 (down + closing). Projections, not guarantees.
Landlord ↔ Tenant lean methodology
- Overall (STATE)
- 90 Strongly Landlord-Friendly
- State Louisiana
- 90 Strongly Landlord-Friendly · R+12
- County
- — inherits STATE
- City
- — inherits STATE
ZIP-level market 70125
- Home prices YoY
- -16.3%
- Rents YoY
- 0.7%
- Active inventory
- 219
- Price-to-rent
- 11.7×
Monthly cashflow live
- Estimated rent
- $5,105 high interval (Pro) →
- Mortgage (P&I)
- −$1,253
- Tax from tax record
- −$282 /mo · $3,381/yr
- Insurance
- −$100
- Flood insurance flood zone
- −$427 /mo · $5,118/yr
- HOA
- −$0
- Vacancy / Maint / Mgmt
- −$1,072
- Net cashflow
- $1,972
Break-even live
Sensitivity live
| Price | -10% $2,107 | -5% $2,039 | +0% $1,972 | +5% $1,904 | +10% $1,836 |
|---|---|---|---|---|---|
| Rent | -10% $1,568 | -5% $1,770 | +0% $1,972 | +5% $2,173 | +10% $2,375 |
| Rate | -1.0pp $2,092 | -0.5pp $2,033 | base $1,972 | +0.5pp $1,910 | +1.0pp $1,847 |
3-unit breakdown (identical units grouped — click to expand)
| Units | Beds | Baths | Est. rent |
|---|---|---|---|
| 3× units | 2 | 1.3 | $5,106 |
| #1 | 2 | 1.3 | $1,702 |
| #2 | 2 | 1.3 | $1,702 |
| #3 | 2 | 1.3 | $1,702 |
| Total (3 units) | $5,105 | ||
UW: 25.0% down · 7.5% · 30yr · 1.5% tax · 5.0% vac · 8.0% maint · 8.0% mgmt
Financing live
Cash to close
- Down payment
- $59,750
- Closing costs
- $7,170
- Reserves months
- —
- Total cash needed
- —
Loan-product check · same deal, 3 products live
Conventional
25% down · 7.5% · 30yr
- Down + closing
- —
- Monthly P&I
- —
- Monthly cashflow
- —
- DSCR
- —
- Eligible?
- —
Personal DTI + credit; lowest rate.
DSCR
20% down · 8.5% · 30yr
- Down + closing
- —
- Monthly P&I
- —
- Monthly cashflow
- —
- DSCR
- —
- Eligible?
- —
No personal income docs; deal must DSCR.
Hard money
10% down · 12.0% · 12mo
- Down + closing
- —
- Monthly P&I
- —
- Monthly cashflow
- —
- DSCR
- —
- Eligible?
- —
Short-term bridge; refi at stabilization.
Rent comps 10 comps
| Address | Beds | Baths | Sqft | Rent | $/sqft | DOM | Units | Dist |
|---|---|---|---|---|---|---|---|---|
| 4442 S Johnson St Unit 4442 New Orleans, LA | 4.0 | 4.5 | 3000 | $4,500 | $1.50 | 13d | 1 | 0.54mi |
| 5533 S Tonti St New Orleans, LA | 4.0 | 4.0 | 3000 | $3,000 | $1.00 | 16d | 1 | 0.58mi |
| 4027 S Derbigny St New Orleans, LA | 3.0 | 2.0 | 2950 | $1,950 | $0.66 | 25d | 1 | 0.64mi |
| 3112 Upperline St New Orleans, LA | 5.0 | 3.5 | 2800 | $3,650 | $1.30 | 25d | 1 | 0.69mi |
| 2616 Calhoun St New Orleans, LA | 4.0 | 2.5 | 2850 | $2,500 | $0.88 | 45d | 1 | 1.04mi |
| 2432 Calhoun St New Orleans, LA | 4.0 | 2.0 | 3300 | $4,400 | $1.33 | 18d | 1 | 1.14mi |
| 5516 S Robertson St Unit A New Orleans, LA | 3.0 | 2.5 | 3614 | $2,800 | $0.77 | 45d | 1 | 1.20mi |
| 1519 Pine St New Orleans, LA | 5.0 | 3.0 | 3000 | $4,000 | $1.33 | 25d | 1 | 1.22mi |
| 2107 Calhoun St New Orleans, LA | 3.0 | 2.0 | 3300 | $2,790 | $0.85 | 45d | 1 | 1.34mi |
| 1927 Napoleon Ave New Orleans, LA | 5.0 | 2.0 | 3350 | $3,600 | $1.07 | 45d | 1 | 1.44mi |
Listing history 32 events
-
2026-06-21days on market $239,000 Active 159 DOM
-
2026-06-18days on market $239,000 Active 156 DOM
-
2026-06-17days on market $239,000 Active 155 DOM
-
2026-06-16days on market $239,000 Active 154 DOM
-
2026-06-15days on market $239,000 Active 153 DOM
-
2026-06-13days on market $239,000 Active 151 DOM
-
2026-06-10days on market $239,000 Active 148 DOM
-
2026-06-09days on market $239,000 Active 147 DOM
-
2026-06-08days on market $239,000 Active 146 DOM
-
2026-06-07days on market $239,000 Active 145 DOM
-
2026-06-05days on market $239,000 Active 142 DOM
-
2026-06-03days on market $239,000 Active 141 DOM
-
2026-06-02days on market $239,000 Active 140 DOM
-
2026-06-01days on market $239,000 Active 139 DOM
-
2026-05-31days on market $239,000 Active 138 DOM
-
2026-01-13$239,000 Active 1094-char remark
Show marketing remark (1117 chars)
Rare opportunity to own a large TRIPLEX located in Broadmoor on a CORNER lot with PARKING! Charming FRONT PORCH has arches, wrought iron & original basket weave pattern tiles. 1st floor with 9-1/2 ft CEILINGS & 7 ft down. INCLUDES driveway, storage & garage with side & rear yards. SPACIOUS apartments with stoves, refrigerators and indoor washers & dryers for EACH apartment (Seller does not warranty any of the appliances/sold as is & will not repair nor replace. ). UNIT C is rented thru March 1st with some repairs needed, the other 2 units are vacant & partially gutted. See attached HISTORIC TAX CREDIT Pre-approval letter for renovation option. Assumable flood insurance @ $1,843. UTILITIES: 3 independent electric meters, 1 water meter, 1 gas meter (gas billed to Apt B). Apt B & C share 1 HWH. Apt A: all electric with CENTRAL AC/heat. Apt B & C window units with gas: wall heaters, stoves & HWHs. All info to be verified. Ai VIRTUAL renovated & staged images are attached in photo gallery - photos are for examples only. Property sold AS IS.
-
2026-01-13$239,000 Active 1117-char remark
Show marketing remark (1117 chars)
Rare opportunity to own a large TRIPLEX located in Broadmoor on a CORNER lot with PARKING! Charming FRONT PORCH has arches, wrought iron & original basket weave pattern tiles. 1st floor with 9-1/2 ft CEILINGS & 7 ft down. INCLUDES driveway, storage & garage with side & rear yards. SPACIOUS apartments with stoves, refrigerators and indoor washers & dryers for EACH apartment (Seller does not warranty any of the appliances/sold as is & will not repair nor replace. ). UNIT C is rented thru March 1st with some repairs needed, the other 2 units are vacant & partially gutted. See attached HISTORIC TAX CREDIT Pre-approval letter for renovation option. Assumable flood insurance @ $1,843. UTILITIES: 3 independent electric meters, 1 water meter, 1 gas meter (gas billed to Apt B). Apt B & C share 1 HWH. Apt A: all electric with CENTRAL AC/heat. Apt B & C window units with gas: wall heaters, stoves & HWHs. All info to be verified. Ai VIRTUAL renovated & staged images are attached in photo gallery - photos are for examples only. Property sold AS IS.
-
2025-10-25price $249,000
-
2025-10-25price $249,000
-
2025-04-08price $269,000
-
2025-04-08price $269,000
-
2025-03-12price $289,000
-
2025-03-12price $289,000
-
2024-08-15price $299,000
-
2024-05-22$299,000 Active
-
2023-10-04price $344,900
-
2023-05-17price $369,000
-
2023-01-16$344,900
-
2022-06-10price $449,000
-
2022-05-05price $499,000
-
2022-04-15$449,000
-
1977-11-18soldstatus $50,000
ⓘ Source: listings_history table (triggers on properties + properties_extension) + one-shot
backfill from property_details.listing_events for pre-trigger history.
Tax reassessment forecast LA · Resets to sale price
- Current annual tax
- $3,381 · $282/mo
- Projected year-2 tax
- $3,381 · $282/mo
- Expected delta
- $0/yr ($0/mo · 0.0%)
ⓘ Screening estimate from a state-policy table — verify with the county assessor before closing.
Climate risk First Street
- Flood 8/10 Severe FEMA zone AE · 78% chance over 30 yrs
- Wildfire 1/10 Low
- Heat 10/10 Extreme 7 d/yr ≥108°F today · 21 d/yr by 30 yrs out
- Wind 10/10 Extreme 99% chance of damaging wind over 30 yrs
- Air quality 4/10 Moderate 4 unhealthy d/yr today · 4 by 30 yrs out
Nearby sold comps map
Loading sold comps map…
Walkable amenities ~0.75 mi
Loading nearby amenities…
Taxation est. · year 1
- Rental income
- $61,260
- − Mortgage interest
- −$13,388
- − Property taxes
- −$3,381
- − Insurance
- −$6,314
- − Repairs & maintenance
- −$4,901
- − Management
- −$4,901
- − Depreciation
- −$6,953
- Taxable income
- $21,423
- Est. tax owed @ 24.0%
- −$5,142
- After-tax cash flow
- $18,519/yr
For passive investors: Depreciation is non-cash, so a rental often shows a tax loss while cash-flowing — sheltering income. Rental losses are passive: they offset passive income freely, and up to $25,000/yr can offset ordinary (W-2) income if you actively participate and your MAGI is under $100k (phasing out to $0 by $150k); unused losses carry forward. On sale, claimed depreciation is recaptured at up to 25%, and gains may owe capital-gains tax (a 1031 exchange can defer both). Figures are a year-1 estimate at your 24.0% rate — not tax advice; consult a CPA.
Schools (NCES district)
- District
- Orleans Parish
- NCES district ID
- 2201170
- Math proficiency
- 11% ▼ -52.00%
- Reading proficiency
- 27% ▼ -46.00%
- Median HH income
- $37,011
- Composite
- 15.78/100
- National rank
- #9271
- State rank
- #69 of 98 in LA
Livability — New Orleans
- Score
- 81/100
- State rank
- #3
- US rank
- #1383
Category grades
Schools grade is shown separately in the Schools card above.
Census & demographics
- Census place
- New Orleans, LA
- County
- Orleans Parish · 338,817 people
- City population
- 338,817
- Metro
- New Orleans-Metairie, LA
- Population (ZIP)
- 17,821
- Household income
- $61,174
- Rent vs Own
- Severe rent burden
- 1270.0
Population outlook (Orleans County) Hauer SSP2
- Today (2025)
- 513,025 people
- By 2030
- 575,781 · +12.2%
- By 2040
- 700,174 · +36.5%
- By 2050
- 826,541 · +61.1%
- By 2075
- 1,123,374 · +119.0%
- By 2100
- 1,355,609 · +164.2%
Race, ethnicity, and origin ACS 2023
- Neighborhood character
- Diverse neighborhood (Simpson 0.63)
- Race & ethnicity
- Black 51% White 32% Hispanic / Latino 9% Two or more races 9% Asian 2% Native American 1%
- Hispanic origin (detail)
- Mexican 2%
- Common ancestry
- Lithuanian 8% Romanian 1% Slovak 1%
- Foreign-born
- 7% · Canada, China
- Languages at home
- 90% English-only · Spanish 6% French/Haitian/Cajun 1% Chinese 1%
Political lean MEDSL · Orleans
- 2024 margin
- Solid D (+67.0) · D 82.2% · R 15.2% · Other 2.7%
- 2008→2024 swing
- +6.7pp toward D · 2008: 60.3pp · 2024: 67.0pp
- All cycles
- 2024: D+67.0 2020: D+68.2 2016: D+66.2 2012: D+62.5 2008: D+60.3
Not yet ingested
- Civics
- —
Market trends
- HPI YoY
- ▼ -49.68%
- Current HPI
- 255.5998
- Rent YoY
- ▲ 0.73%
- Metro
- New Orleans-Metairie, LA
- State GDP YoY
- ▲ 3.29%
- F500 in state
- 10
Industry mix (Fortune 500 HQ in LA)
| Industry | F500 HQs | Revenue |
|---|---|---|
| Telecommunications | 2 | $23B |
|
||
| Utilities | 1 | $12B |
|
||
| Wholesale / Distribution | 1 | $5B |
|
||
| Advertising | 1 | $2B |
|
||
Price history
+378.0% since first listed17 events — show timeline
- 2026-01-13 Listed $239,000 GSREIN
- 2026-01-13 Listed $239,000 AcadianaMLS
- 2025-10-25 Price Changed $249,000 AcadianaMLS
- 2025-10-25 Price Changed $249,000 GSREIN
- 2025-04-08 Price Changed $269,000 AcadianaMLS
- 2025-04-08 Price Changed $269,000 GSREIN
- 2025-03-12 Price Changed $289,000 AcadianaMLS
- 2025-03-12 Price Changed $289,000 GSREIN
- 2024-08-15 Price Changed $299,000 GSREIN
- 2024-05-22 Listed $299,000 AcadianaMLS
- 2023-10-04 Price Changed $344,900 GSREIN
- 2023-05-17 Price Changed $369,000 GSREIN
- 2023-01-16 Listed $344,900 AcadianaMLS
- 2022-06-10 Price Changed $449,000 GSREIN
- 2022-05-05 Price Changed $499,000 GSREIN
- 2022-04-15 Listed $449,000 AcadianaMLS
- 1977-11-18 Sold (Public Records) $50,000 Public Records
Property tax history
+7.1%/yrLatest (2026): $3,381 · +3.4% YoY. Source: county tax records.
Cash-flow waterfall
monthlySold comps — $/sqft
last 12 mo · ≤1 miLoading sold comps…