355 Grandview Ave · Black Point-Green Point, CA
Flood risk 1/10 · Minimal
- FEMA flood zone
- X (unshaded)
- Chance of flooding over 30 yrs
- 0.0%
- Est. flood insurance / yr
- $507 – $1,088
Fire risk 3/10 · Minor
- Est. fire insurance / yr
- $659 – $1,223
Heat risk 3/10 · Minor
- Hot days now (above 88°F)
- 6 days/yr
- Hot days in 30 yrs
- 13 days/yr
Wind risk 1/10 · Minimal
- Chance of severe wind over 30 yrs
- —
Air-quality risk 8/10 · Major
- Unhealthy air days now
- 13 days/yr
- Unhealthy air days in 30 yrs
- 13 days/yr
Risk factors via First Street. Map © Google.
Why this score? — see what drove the C- grade
The composite is a weighted blend of 9 inputs, each scored 0–100. Each bar is that input's sub-score; the figure is the points it added to the 100-point composite (weight × sub-score).
- Cash flow +20.6/30.0
- ARV discount +7.5/15.0
- 1% rule +6.8/10.0
- DSCR +6.5/10.0
- Schools +4.1/10.0
- Rent growth +2.5/5.0
- Livability +2.5/5.0
- Condition / age +2.5/5.0
- Appreciation +0.0/10.0
$385,900
🖨 Deal sheet 📄 Offer letter ✓ Due diligence
Listing remarks MLS
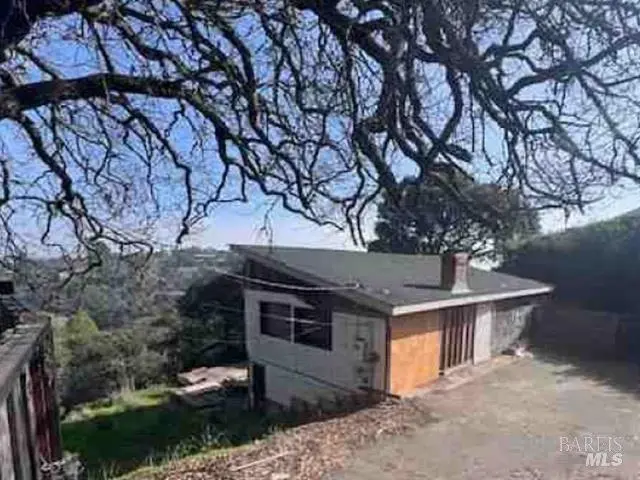
Great project home in Novato, CA. Property has some great views of the bay and woods. Property is boarded up and could be red tagged with violations. Buyers check with City, County, Zoning, Tax, and other records to their satisfaction. AS-IS SALE property. Any violations will be at buyer's expense.
Key facts
- Views of the bay
- Views of woods
- 0.23 acre lot
Tags
Neighborhood map
What this means for you Summary
Snapshot
- This is a 3-bed/1.0-bath single-family listed at $386k.
Deal economics
- At list price, monthly cash flow is $514 ($6k/yr) — positive.
- The deal already cash-flows at list — no discount required.
- Meets the 1% rule at list price ($5k rent vs $386k).
- Recommended offer: $351k (9.0% below list) — sets the bar for market timing.
Location & tenants
- Location reads: area grade C — affects rentability + tenant quality, not the cash-flow math above.
- Novato Unified (suburban): math 38% / reading 50% proficiency, ranked #160 of 517 in CA (top 31%) — families likely to look elsewhere, expect single-tenant / working-renter base with shorter leases.
- Market conditions: 60 active listings in the ZIP; solid renter incomes; 149 units permitted in Marin County in 2024 (5 in 5+ unit buildings).
- At $4,569/mo this rent would consume 51% of the median local household income ($108k/yr) (locally 357% of renters already pay >50% of income on rent) — very limited rent-growth headroom before tenants either downsize or default.
Forward outlook
- Local home prices are declining (-3.0%/yr); year-one equity from $3k of loan paydown is wiped out by about $12k of value loss. Plan a longer hold.
- Marin County population projected at +9% by 2050 — modest demand growth; plan on rents tracking national, not racing it.
Negotiation context
- It's been on market 115 days — a 9% lower offer ($351k) is reasonable based on typical stale-listing flexibility.
- 2 sale attempts; this cycle's ask has dropped $64k (14%) from the opening price — seller is motivated, your offer sets the floor, not the list.
Risks & watch-outs
- Watch-outs: property tax is 2.8% of price; built in 1935 — expect roof / HVAC / electrical / plumbing capex.
Questions for the listing agent
- It's been on market 115 days. Have you received any prior offers? Is the seller open to a 9% concession, seller financing, or rate buy-down credit?
- Built in 1935 — when were the roof, HVAC, electrical panel, plumbing, and water heater last replaced?
- Property tax is high relative to price — has the assessment been appealed recently, and will the sale trigger a re-assessment?
- Why hasn't it sold? Are there any deal-killer items the seller is aware of (foundation, flood, title, zoning, code violations)?
- Is there a deadline driving the sale (1031 exchange, divorce, estate, relocation)? That informs how much negotiation room exists.
- What's the average days-on-market for RENTAL listings here right now (not sales)? A rising rental-DOM trend means longer vacancies and softer asking-rent achievability than the comps imply.
- What's the recent tenant-quality profile in this submarket — average credit score on applications, eviction rate, late-payment / NSF rate, and stable-employment percentage? A property-management company in the area should have these aggregated.
- How much new for-sale + rental construction is in the pipeline within 1–3 miles? Heavy new supply typically softens prices + rents 12–24 months out; constrained supply supports both.
Investment metrics
- 1% rule
- 1.18% ✓
- Cap rate
- 7.89%
- Cash-on-cash
- 5.70%
- DSCR
- 1.25
- GRM
- 7.0
CMA / ARV
- ARV (median comp)
- $1,094,748
- List price
- $385,900
- Delta
- -64.75%
- Verdict
- UNDERPRICED
- Comps
- 12 within 1.0 mi
Show comp detail 4 sales within ~0.75 mi
| Address | Dist | Beds/Ba | Sqft | Sold | Price | $/sf | Match |
|---|---|---|---|---|---|---|---|
| 50 Oak Ave | 0.19mi | 3/2.0 | 1,919 (+0%) | 5mo | $820,000 | $427 | 83 |
| 352 Laurel Ave | 0.15mi | 4/2.5 (+1) | 1,965 (+3%) | 8mo | $1,150,000 | $585 | 71 |
| 54 Manzanita Ave | 0.27mi | 3/2.0 | 1,774 (-7%) | 1mo | $845,000 | $476 | 70 |
| 327 Grandview Ave | 0.08mi | 3/2.5 | 2,080 (+9%) | 14mo | $950,000 | $457 | 65 |
Match score weights: distance 35% · size 25% · config 20% · recency 20%. Top-matched comps best support the ARV.
Projected returns pro-forma
-3.0% appreciation · 3.0% rent growth · sell at horizon
- IRR
- -7.4%
- Equity multiple
- 0.73×
- Total profit
- $-29,492
- Equity at exit
- $57,539
- IRR
- 2.3%
- Equity multiple
- 1.16×
- Total profit
- $17,786
- Equity at exit
- $33,366
Cash invested: $108,052 (down + closing). Projections, not guarantees.
Landlord ↔ Tenant lean methodology
- Overall (STATE)
- 18 Strongly Tenant-Friendly
- State California
- 18 Strongly Tenant-Friendly · D+13
- County
- — inherits STATE
- City
- — inherits STATE
ZIP-level market 94945
- Active inventory
- 60
- Price-to-rent
- 7.0×
Monthly cashflow live
- Estimated rent
- $4,569 medium interval (Pro) →
- Mortgage (P&I)
- −$2,024
- Tax from tax record
- −$912 /mo · $10,940/yr
- Insurance
- −$161
- HOA
- −$0
- Vacancy / Maint / Mgmt
- −$960
- Net cashflow
- $514
Break-even live
UW: 25.0% down · 7.5% · 30yr · 1.5% tax · 5.0% vac · 8.0% maint · 8.0% mgmt
Financing live
Cash to close
- Down payment
- $96,475
- Closing costs
- $11,577
- Reserves months
- —
- Total cash needed
- —
Loan-product check · same deal, 3 products live
Conventional
25% down · 7.5% · 30yr
- Down + closing
- —
- Monthly P&I
- —
- Monthly cashflow
- —
- DSCR
- —
- Eligible?
- —
Personal DTI + credit; lowest rate.
DSCR
20% down · 8.5% · 30yr
- Down + closing
- —
- Monthly P&I
- —
- Monthly cashflow
- —
- DSCR
- —
- Eligible?
- —
No personal income docs; deal must DSCR.
Hard money
10% down · 12.0% · 12mo
- Down + closing
- —
- Monthly P&I
- —
- Monthly cashflow
- —
- DSCR
- —
- Eligible?
- —
Short-term bridge; refi at stabilization.
Listing history 24 events
-
2026-06-18days on market $385,900 Active 115 DOM
-
2026-06-17days on market $385,900 Active 114 DOM
-
2026-06-16days on market $385,900 Active 113 DOM
-
2026-06-15days on market $385,900 Active 112 DOM
-
2026-06-13days on market $385,900 Active 110 DOM
-
2026-06-13days on market $385,900 Active 109 DOM
-
2026-06-09days on market $385,900 Active 106 DOM
-
2026-06-08days on market $385,900 Active 105 DOM
-
2026-06-07days on market $385,900 Active 104 DOM
-
2026-06-04days on market $385,900 Active 101 DOM
-
2026-06-03days on market $385,900 Active 100 DOM
-
2026-06-02days on market $385,900 Active 99 DOM
-
2026-06-01days on market $385,900 Active 98 DOM
-
2026-05-31days on market $385,900 Active 97 DOM
-
2026-04-30price $406,200 299-char remark
Show marketing remark (299 chars)
Great project home in Novato, CA. Property has some great views of the bay and woods. Property is boarded up and could be red tagged with violations. Buyers check with City, County, Zoning, Tax, and other records to their satisfaction. AS-IS SALE property. Any violations will be at buyer's expense.
-
2026-03-26price $427,500 299-char remark
Show marketing remark (299 chars)
Great project home in Novato, CA. Property has some great views of the bay and woods. Property is boarded up and could be red tagged with violations. Buyers check with City, County, Zoning, Tax, and other records to their satisfaction. AS-IS SALE property. Any violations will be at buyer's expense.
-
2026-02-23$450,000 Active 299-char remark
Show marketing remark (299 chars)
Great project home in Novato, CA. Property has some great views of the bay and woods. Property is boarded up and could be red tagged with violations. Buyers check with City, County, Zoning, Tax, and other records to their satisfaction. AS-IS SALE property. Any violations will be at buyer's expense.
-
2025-07-25price $549,000
-
2025-07-25$649,000 Active
-
2022-08-09price $799,000
-
2022-07-24price $840,000
-
2005-03-17soldstatus $645,000
-
2003-03-06soldstatus $505,000
-
1986-11-19soldstatus $140,000
ⓘ Source: listings_history table (triggers on properties + properties_extension) + one-shot
backfill from property_details.listing_events for pre-trigger history.
Tax reassessment forecast CA · Resets to sale price
- Current annual tax
- $10,940 · $912/mo
- Projected year-2 tax
- $10,940 · $912/mo
- Expected delta
- $0/yr ($0/mo · 0.0%)
ⓘ Screening estimate from a state-policy table — verify with the county assessor before closing.
Climate risk First Street
- Flood 1/10 Low FEMA zone X (unshaded) · 0% chance over 30 yrs
- Wildfire 3/10 Moderate
- Heat 3/10 Moderate 6 d/yr ≥88°F today · 13 d/yr by 30 yrs out
- Wind 1/10 Low
- Air quality 8/10 Severe 13 unhealthy d/yr today · 13 by 30 yrs out
Nearby sold comps map
Loading sold comps map…
Walkable amenities ~0.75 mi
Loading nearby amenities…
Taxation est. · year 1
- Rental income
- $54,830
- − Mortgage interest
- −$21,616
- − Property taxes
- −$10,940
- − Insurance
- −$1,930
- − Repairs & maintenance
- −$4,386
- − Management
- −$4,386
- − Depreciation
- −$11,226
- Taxable income
- $346
- Est. tax owed @ 24.0%
- −$83
- After-tax cash flow
- $6,079/yr
For passive investors: Depreciation is non-cash, so a rental often shows a tax loss while cash-flowing — sheltering income. Rental losses are passive: they offset passive income freely, and up to $25,000/yr can offset ordinary (W-2) income if you actively participate and your MAGI is under $100k (phasing out to $0 by $150k); unused losses carry forward. On sale, claimed depreciation is recaptured at up to 25%, and gains may owe capital-gains tax (a 1031 exchange can defer both). Figures are a year-1 estimate at your 24.0% rate — not tax advice; consult a CPA.
Schools (NCES district)
- District
- Novato Unified
- NCES district ID
- 0627720
- Math proficiency
- 38% ▼ -11.00%
- Reading proficiency
- 50% ▼ -5.00%
- Median HH income
- $84,396
- Composite
- 41.06/100
- National rank
- #3576
- State rank
- #160 of 517 in CA
Livability — Black Point-Green Point
No livability data for this city. (Only ~50 U.S. cities are tracked.)
Census & demographics
- Census place
- Black Point-Green Point, CA
- County
- Marin County · 243,328 people
- Metro
- San Francisco-Oakland-Berkeley, CA
- Population (ZIP)
- 17,635
- Household income
- $107,790
- Rent vs Own
- Severe rent burden
- 357.0
Population outlook (Marin County) Hauer SSP2
- Today (2025)
- 276,379 people
- By 2030
- 282,942 · +2.4%
- By 2040
- 292,937 · +6.0%
- By 2050
- 300,449 · +8.7%
- By 2075
- 316,946 · +14.7%
- By 2100
- 303,948 · +10.0%
Race, ethnicity, and origin ACS 2023
- Neighborhood character
- Diverse neighborhood (Simpson 0.59)
- Race & ethnicity
- White 59% Hispanic / Latino 23% Two or more races 9% Asian 8% Black 3%
- Hispanic origin (detail)
- Mexican 7%
- Common ancestry
- Slovak 3% Scotch-Irish 3% Lithuanian 3%
- Foreign-born
- 22% · Canada, China, Vietnam
- Languages at home
- 72% English-only · Spanish 16% Other Indo-European 3% Chinese 2%
Political lean MEDSL · Marin
- 2024 margin
- Solid D (+63.9) · D 80.6% · R 16.7% · Other 2.7%
- 2008→2024 swing
- +6.2pp toward D · 2008: 57.7pp · 2024: 63.9pp
- All cycles
- 2024: D+63.9 2020: D+66.5 2016: D+62.9 2012: D+50.5 2008: D+57.7
Not yet ingested
- Civics
- —
Market trends
- HPI YoY
- ▼ -725.83%
- Current HPI
- 266.2049
- Rent YoY
- —
- Metro
- San Francisco-Oakland-Berkeley, CA
- State GDP YoY
- ▲ 3.21%
- F500 in state
- 116
Industry mix (Fortune 500 HQ in CA)
| Industry | F500 HQs | Revenue |
|---|---|---|
| Technology | 27 | $1,492B |
|
||
| Financial Services | 3 | $174B |
|
||
| Retail | 3 | $44B |
|
||
| Insurance | 3 | $26B |
|
||
| Media / Entertainment | 2 | $115B |
|
||
| Pharmaceuticals / Biotech | 2 | $62B |
|
||
Price history
+190.1% since first listed10 events — show timeline
- 2026-04-30 Price Changed $406,200 San Francisco MLS
- 2026-03-26 Price Changed $427,500 San Francisco MLS
- 2026-02-23 Listed $450,000 San Francisco MLS
- 2025-07-25 Price Changed $549,000 BAREIS
- 2025-07-25 Listed $649,000 BAREIS
- 2022-08-09 Price Changed $799,000 BAREIS
- 2022-07-24 Price Changed $840,000 BAREIS
- 2005-03-17 Sold (Public Records) $645,000 Public Records
- 2003-03-06 Sold (Public Records) $505,000 Public Records
- 1986-11-19 Sold (Public Records) $140,000 Public Records
Property tax history
+2.2%/yrLatest (2025): $10,940 · +1.4% YoY. Source: county tax records.
Cash-flow waterfall
monthlySold comps — $/sqft
last 12 mo · ≤1 miLoading sold comps…