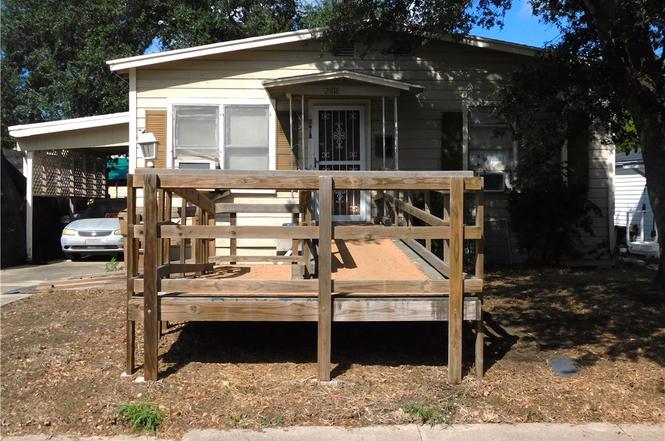
2618 Wainwright St · Corpus Christi, TX
Flood risk 4/10 · Minor
- FEMA flood zone
- X (unshaded)
- Chance of flooding over 30 yrs
- 0.22%
- Est. flood insurance / yr
- $507 – $1,088
Fire risk 1/10 · Minimal
- Est. fire insurance / yr
- $1,222 – $2,270
Heat risk 10/10 · Severe
- Hot days now (above 107°F)
- 7 days/yr
- Hot days in 30 yrs
- 26 days/yr
Wind risk 9/10 · Severe
- Chance of severe wind over 30 yrs
- 99.0%
Air-quality risk 1/10 · Minimal
- Unhealthy air days now
- 0 days/yr
- Unhealthy air days in 30 yrs
- 0 days/yr
Risk factors via First Street. Map © Google.
Why this score? — see what drove the B+ grade
The composite is a weighted blend of 9 inputs, each scored 0–100. Each bar is that input's sub-score; the figure is the points it added to the 100-point composite (weight × sub-score).
- Cash flow +30.0/30.0
- ARV discount +12.1/15.0
- 1% rule +10.0/10.0
- DSCR +10.0/10.0
- Appreciation +5.7/10.0
- Livability +3.9/5.0
- Schools +2.8/10.0
- Rent growth +2.5/5.0
- Condition / age +2.5/5.0
$68,000
🖨 Deal sheet 📄 Offer letter ✓ Due diligence
Listing remarks
TLC 2-Bedroom home with accessibility features with convenient location. Home was converted from a three bedroom into a spacious two-bedroom layout. Such layout might be reversed back to a 3-bedroom. Features one full bath, a functional kitchen, and a comfortable living area. Accessibility is built right in for anyone seeking easy entry and mobility-friendly features. Located minutes from restaurants, local meat markets, and grocery stores. Home being sold "AS IS" "NO Repairs". No Seller Financing. No Survey. Non- Realty items sell with property. CASH purchase only. No Water or Electrical on and Seller will not turn on services.
Key facts
- Functional kitchen
- Easy entry
- Grocery stores
Tags
Property features AI
Exterior
- Parking: Carport; Gravel parking; Total 2 parking spaces (1 covered); 1-car garage
- Utilities: Public water; Public sewer; Utilities available
- Home design: Single-story; Pillar/post/pier foundation; Shingle roof; Wood siding
- Construction: Wood siding construction; Built on pillar/post/pier foundation; Shingle roof
- Exterior features: Handicap accessible; Interior lot; Chain link and wood fencing
Interior
- Kitchen: Free-standing range
- Flooring: Carpet; Vinyl
- Bathrooms: 1 full bathroom
- Heating & cooling: Window heating unit; Window cooling unit
- Interior features: Window coverings / treatments
Neighborhood map
What this means for you Summary
Snapshot
- This is a 2-bed/1.0-bath single-family listed at $68k.
Deal economics
- At list price, monthly cash flow is $325 ($4k/yr) — positive.
- The deal already cash-flows at list — no discount required.
- Meets the 1% rule at list price ($1k rent vs $68k).
- Recommended offer: $67k (1.5% below list) — sets the bar for market timing.
- Cap rate 12.0% vs local median 3.6% in Corpus Christi — top-decile yield for the area; either an underpriced asset or a hidden risk that comps aren't pricing in. Stress-test before assuming the spread holds.
Location & tenants
- Location reads 78/100 on livability (#66 in TX, #2,404 nationally) — a middle-class / working-renter tenant base. Strengths: commute A+, cost of living A+, housing A+; Watch: crime F.
- Corpus Christi ISD (urban): math 31% / reading 35% proficiency, ranked #562 of 826 in TX (top 68%) — families likely to look elsewhere, expect single-tenant / working-renter base with shorter leases; 63% free/reduced lunch — lower-income household profile, screen leases tightly.
- Market conditions: 74 active listings in the ZIP; 24 comparable units currently listed for rent nearby; rentals lingering (median 44d on market — plan ~5-8 weeks vacancy on turnover, expect pricing pressure); 62% of comp listings sitting > 30 days — soft ceiling on asking rent; lower-income renter base — watch delinquency; 1,397 units permitted in Nueces County in 2024 (47 in 5+ unit buildings).
- This rent runs 34% of the median local income ($38k/yr) — at the standard rent-burdened threshold; future hikes will face affordability resistance.
Forward outlook
- In year one you build about $1k of equity ($470 loan paydown + $966 appreciation (1.4% local appreciation)).
- Nueces County population projected at +36% by 2050 — long-run rental-demand tailwind backs the buy-and-hold thesis.
- At projected returns (1.4% appreciation + 3.0% rent growth), your $19k cash investment doubles in ~4 years — after that, you're playing with house money.
Negotiation context
- It's been on market 19 days — a 2% lower offer ($67k) is reasonable based on typical stale-listing flexibility.
- 3 sale attempts; this cycle's ask is 5% above the opening price — seller raised mid-cycle; expect resistance to lowballs.
Risks & watch-outs
- Watch-outs: property tax is 2.6% of price; built in 1959 — expect roof / HVAC / electrical / plumbing capex.
- Climate carrying-cost: severe wind risk, 99% chance of damaging wind over 30y; extreme-heat days projected 7→26/yr by 2055 (HVAC capex compounding) — expect insurance premiums to compound above CPI over the hold.
Questions for the listing agent
- Built in 1959 — when were the roof, HVAC, electrical panel, plumbing, and water heater last replaced?
- Property tax is high relative to price — has the assessment been appealed recently, and will the sale trigger a re-assessment?
- Is there a deadline driving the sale (1031 exchange, divorce, estate, relocation)? That informs how much negotiation room exists.
- Crime grade is F in this area — have there been break-ins, vandalism, or insurance claims at this property in the last 3 years? What carrier currently insures it and at what premium?
- What's the average days-on-market for RENTAL listings here right now (not sales)? A rising rental-DOM trend means longer vacancies and softer asking-rent achievability than the comps imply.
- What's the recent tenant-quality profile in this submarket — average credit score on applications, eviction rate, late-payment / NSF rate, and stable-employment percentage? A property-management company in the area should have these aggregated.
- How much new for-sale + rental construction is in the pipeline within 1–3 miles? Heavy new supply typically softens prices + rents 12–24 months out; constrained supply supports both.
Investment metrics
- 1% rule
- 1.60% ✓
- Cap rate
- 12.02%
- Cash-on-cash
- 20.46%
- DSCR
- 1.91
- GRM
- 5.2
CMA / ARV
- ARV (on-the-fly)
- $75,654
- Comps found
- 12
Show comp detail 12 sales within ~0.75 mi
| Address | Dist | Beds/Ba | Sqft | Sold | Price | $/sf | Match |
|---|---|---|---|---|---|---|---|
| 3037 Macarthur St | 0.12mi | 2/1.0 | 960 (+3%) | 0mo | $50,000 | $52 | 89 |
| 2225 Presa St | 0.35mi | 2/1.0 | 924 (-1%) | 8mo | $53,500 | $58 | 76 |
| 2530 Dunbar St | 0.11mi | 3/2.0 (+1) | 992 (+6%) | 2mo | $79,900 | $81 | 74 |
| 3306 Elgin St | 0.35mi | 3/1.0 (+1) | 901 (-4%) | 4mo | $133,500 | $148 | 70 |
| 2921 Sabinas St | 0.27mi | 2/1.0 | 1,044 (+12%) | 2mo | $69,999 | $67 | 66 |
| 3033 Elgin St | 0.17mi | 3/1.0 (+1) | 1,058 (+13%) | 5mo | $149,900 | $142 | 60 |
| 2838 Greenwood Dr | 0.25mi | 2/2.0 | 1,058 (+13%) | 3mo | $158,000 | $149 | 60 |
| 2506 Crews St | 0.60mi | 2/1.0 | 904 (-3%) | 10mo | $58,000 | $64 | 59 |
| 2624 Sonora St | 0.33mi | 2/1.0 | 808 (-14%) | 10mo | $39,900 | $49 | 54 |
| 3650 Braniff St | 0.70mi | 3/1.0 (+1) | 986 (+6%) | 2mo | $69,900 | $71 | 51 |
| 2705 Elizabeth St | 0.62mi | 3/1.0 (+1) | 1,026 (+10%) | 3mo | $165,000 | $161 | 47 |
| 3073 Reyna St | 0.56mi | 3/2.0 (+1) | 1,036 (+11%) | 8mo | $110,000 | $106 | 40 |
Match score weights: distance 35% · size 25% · config 20% · recency 20%. Top-matched comps best support the ARV.
Projected returns pro-forma
1.42% appreciation · 3.0% rent growth · sell at horizon
- IRR
- 23.5%
- Equity multiple
- 2.23×
- Total profit
- $23,411
- Equity at exit
- $24,715
- IRR
- 25.9%
- Equity multiple
- 4.24×
- Total profit
- $61,766
- Equity at exit
- $34,037
Cash invested: $19,040 (down + closing). Projections, not guarantees.
Landlord ↔ Tenant lean methodology
- Overall (STATE)
- 87 Strongly Landlord-Friendly
- State Texas
- 87 Strongly Landlord-Friendly · R+5
- County
- — inherits STATE
- City
- — inherits STATE
ZIP-level market 78405
- Home prices YoY
- 1.3%
- Active inventory
- 74
- Price-to-rent
- 5.2×
Monthly cashflow live
- Estimated rent
- $1,085 high interval (Pro) →
- Mortgage (P&I)
- −$357
- Tax from tax record
- −$147 /mo · $1,769/yr
- Insurance
- −$28
- HOA
- −$0
- Vacancy / Maint / Mgmt
- −$228
- Net cashflow
- $325
Break-even live
UW: 25.0% down · 7.5% · 30yr · 1.5% tax · 5.0% vac · 8.0% maint · 8.0% mgmt
Financing live
Cash to close
- Down payment
- $17,000
- Closing costs
- $2,040
- Reserves months
- —
- Total cash needed
- —
Loan-product check · same deal, 3 products live
Conventional
25% down · 7.5% · 30yr
- Down + closing
- —
- Monthly P&I
- —
- Monthly cashflow
- —
- DSCR
- —
- Eligible?
- —
Personal DTI + credit; lowest rate.
DSCR
20% down · 8.5% · 30yr
- Down + closing
- —
- Monthly P&I
- —
- Monthly cashflow
- —
- DSCR
- —
- Eligible?
- —
No personal income docs; deal must DSCR.
Hard money
10% down · 12.0% · 12mo
- Down + closing
- —
- Monthly P&I
- —
- Monthly cashflow
- —
- DSCR
- —
- Eligible?
- —
Short-term bridge; refi at stabilization.
Rent comps 24 comps
| Address | Beds | Baths | Sqft | Rent | $/sqft | DOM | Units | Dist |
|---|---|---|---|---|---|---|---|---|
| 3150 Elgin St Corpus Christi, TX | 2.0 | 1.0 | 616 | $925 | $1.50 | 43d | 1 | 0.21mi |
| 2522 Cleo St Corpus Christi, TX | 3.0 | 1.0 | 992 | $1,350 | $1.36 | 13d | 1 | 0.57mi |
| 2402 Segrest St Corpus Christi, TX | 2.0 | 1.0 | 1120 | $825 | $0.74 | 21d | 1 | 0.68mi |
| 2333 Riggan St Corpus Christi, TX | 2.0 | 1.0 | 856 | $1,250 | $1.46 | 43d | 1 | 0.83mi |
| 1114 25th St Corpus Christi, TX | 1.0–2.0 | 1.0 | 712 | $1,050 | $1.47 | 13d | 6 | 0.89mi |
| 1525 S 19th St Unit B Corpus Christi, TX | 3.0 | 2.0 | 1062 | $2,100 | $1.98 | 13d | 1 | 0.91mi |
| 2937 Ruth St Corpus Christi, TX | 2.0 | 1.0 | 676 | $950 | $1.41 | 43d | 1 | 1.00mi |
| 1628 18th St Corpus Christi, TX | 2.0 | 1.0 | 1112 | $1,000 | $0.90 | 43d | 1 | 1.02mi |
| 200 Clemmer St Unit A Corpus Christi, TX | 3.0 | 1.0 | 950 | $1,199 | $1.26 | 43d | 1 | 1.04mi |
| 2106 Harvard St Corpus Christi, TX | 3.0 | 1.0 | 912 | $1,225 | $1.34 | 43d | 1 | 1.12mi |
| 2122 Harvard St Corpus Christi, TX | 2.0 | 1.0 | 858 | $1,250 | $1.46 | 13d | 1 | 1.14mi |
| 1808 Morgan Ave Corpus Christi, TX | 1.0 | 1.0 | 667 | $975 | $1.46 | 43d | 1 | 1.15mi |
| 1802 Morgan Ave Unit 1802 Corpus Christi, TX | 2.0 | 1.0 | 850 | $1,250 | $1.47 | 21d | 1 | 1.16mi |
| 1802 Morgan Ave Unit 1804 Corpus Christi, TX | 1.0 | 1.0 | 667 | $695 | $1.04 | 43d | 1 | 1.16mi |
| 1201 York Ave Corpus Christi, TX | 3.0 | 1.0 | 888 | $1,550 | $1.75 | 21d | 1 | 1.17mi |
| 3115 Agnes St Corpus Christi, TX | 2.0 | 1.0 | 428 | $828 | $1.93 | 43d | 3 | 1.27mi |
| 1634 14th St Corpus Christi, TX | 2.0 | 1.5 | 980 | $1,090 | $1.11 | 43d | 1 | 1.28mi |
| 801 18th St Corpus Christi, TX | 1.0 | 1.0 | 600 | $895 | $1.49 | 21d | 1 | 1.28mi |
| 4326 Vestal St Corpus Christi, TX | 3.0 | 1.0 | 984 | $1,125 | $1.14 | 13d | 1 | 1.29mi |
| 1433 12th St Corpus Christi, TX | 2.0 | 1.0 | 768 | $1,050 | $1.37 | 43d | 1 | 1.32mi |
| 1800 S Staples St Corpus Christi, TX | 1.0 | 1.0 | 585 | $1,015 | $1.74 | 43d | 1 | 1.38mi |
| 616 16th St Unit A Corpus Christi, TX | 3.0 | 1.0 | 1040 | $1,050 | $1.01 | 43d | 1 | 1.43mi |
| 815 Ohio Ave Unit 3 Corpus Christi, TX | 2.0 | 1.0 | 748 | $985 | $1.32 | 43d | 1 | 1.45mi |
| 4702 Old Brownsville Rd Corpus Christi, TX | 1.0 | 1.0 | 700 | $764 | $1.09 | 43d | 1 | 1.48mi |
Listing history 10 events
-
2026-06-18days on market $68,000 Active 19 DOM
-
2026-06-17days on market $68,000 Active 18 DOM
-
2026-06-16days on market $68,000 Active 17 DOM
-
2026-06-15days on market $68,000 Active 16 DOM
-
2026-06-14days on market $68,000 Active 14 DOM
-
2026-06-10days on market $68,000 Active 11 DOM
-
2026-06-09days on market $68,000 Active 10 DOM
-
2026-06-08days on market $68,000 Active 9 DOM
-
2026-06-07remarks 638-char remark
-
2026-06-07$68,000 Active 8 DOM
ⓘ Source: listings_history table (triggers on properties + properties_extension) + one-shot
backfill from property_details.listing_events for pre-trigger history.
Tax reassessment forecast TX · Resets to sale price
- Current annual tax
- $1,769 · $147/mo
- Projected year-2 tax
- $1,769 · $147/mo
- Expected delta
- $0/yr ($0/mo · 0.0%)
ⓘ Screening estimate from a state-policy table — verify with the county assessor before closing.
Climate risk First Street
- Flood 4/10 Moderate FEMA zone X (unshaded) · 22% chance over 30 yrs
- Wildfire 1/10 Low
- Heat 10/10 Extreme 7 d/yr ≥107°F today · 26 d/yr by 30 yrs out
- Wind 9/10 Extreme 99% chance of damaging wind over 30 yrs
- Air quality 1/10 Low 0 unhealthy d/yr today · 0 by 30 yrs out
Nearby sold comps map
Loading sold comps map…
Walkable amenities ~0.75 mi
Loading nearby amenities…
Taxation est. · year 1
- Rental income
- $13,017
- − Mortgage interest
- −$3,809
- − Property taxes
- −$1,769
- − Insurance
- −$340
- − Repairs & maintenance
- −$1,041
- − Management
- −$1,041
- − Depreciation
- −$1,978
- Taxable income
- $3,038
- Est. tax owed @ 24.0%
- −$729
- After-tax cash flow
- $3,166/yr
For passive investors: Depreciation is non-cash, so a rental often shows a tax loss while cash-flowing — sheltering income. Rental losses are passive: they offset passive income freely, and up to $25,000/yr can offset ordinary (W-2) income if you actively participate and your MAGI is under $100k (phasing out to $0 by $150k); unused losses carry forward. On sale, claimed depreciation is recaptured at up to 25%, and gains may owe capital-gains tax (a 1031 exchange can defer both). Figures are a year-1 estimate at your 24.0% rate — not tax advice; consult a CPA.
Schools (NCES district)
- District
- Corpus Christi ISD
- NCES district ID
- 4815270
- Math proficiency
- 31% ▼ -18.00%
- Reading proficiency
- 35% ▼ -7.00%
- Median HH income
- $45,672
- Composite
- 28.27/100
- National rank
- #6793
- State rank
- #562 of 826 in TX
Livability — Corpus Christi
- Score
- 78/100
- State rank
- #66
- US rank
- #2404
Category grades
Schools grade is shown separately in the Schools card above.
Census & demographics
- Census place
- Corpus Christi, TX
- County
- Nueces County · 296,836 people
- City population
- 296,836
- Metro
- Corpus Christi, TX
- Population (ZIP)
- 14,602
- Household income
- $38,294
- Rent vs Own
- Severe rent burden
- 867.0
Population outlook (Nueces County) Hauer SSP2
- Today (2025)
- 418,037 people
- By 2030
- 447,123 · +7.0%
- By 2040
- 505,911 · +21.0%
- By 2050
- 567,522 · +35.8%
- By 2075
- 729,686 · +74.6%
- By 2100
- 847,087 · +102.6%
Race, ethnicity, and origin ACS 2023
- Neighborhood character
- Predominantly Hispanic (91%)
- Race & ethnicity
- Hispanic / Latino 91% Two or more races 48% Black 4% White 4%
- Hispanic origin (detail)
- Mexican 83%
- Foreign-born
- 18% · Canada
- Languages at home
- 52% English-only · Spanish 48%
Political lean MEDSL · Nueces
- 2024 margin
- R (+11.5) · D 43.8% · R 55.3%
- 2008→2024 swing
- -7.1pp toward R · 2008: -4.4pp · 2024: -11.5pp
- All cycles
- 2024: R+11.5 2020: R+2.9 2016: R+1.5 2012: R+3.2 2008: R+4.4
Not yet ingested
- Civics
- —
Market trends
- HPI YoY
- ▲ 1.42%
- Current HPI
- 113.2227
- Rent YoY
- —
- Metro
- Corpus Christi, TX
- State GDP YoY
- ▲ 3.95%
- F500 in state
- 110
Industry mix (Fortune 500 HQ in TX)
| Industry | F500 HQs | Revenue |
|---|---|---|
| Energy | 16 | $1,198B |
|
||
| Technology | 5 | $198B |
|
||
| Engineering / Construction | 4 | $72B |
|
||
| Energy Services | 3 | $60B |
|
||
| Utilities | 3 | $41B |
|
||
| Healthcare | 2 | $330B |
|
||
Price history
+4.6% since first listed5 events — show timeline
- 2026-06-05 Relisted — CBMLS
- 2026-06-05 Price Changed $68,000 CBMLS
- 2026-03-16 Relisted — CBMLS
- 2025-09-28 Pending — CBMLS
- 2025-09-24 Listed $65,000 CBMLS
Property tax history
+6.2%/yrLatest (2025): $1,769 · +31.4% YoY. Source: county tax records.
Cash-flow waterfall
monthlySold comps — $/sqft
last 12 mo · ≤1 miLoading sold comps…