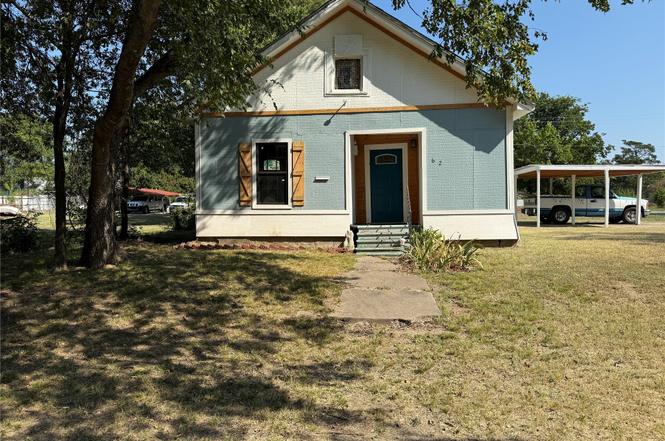
629 E Broadway · Ardmore, OK
Flood risk 1/10 · Minimal
- FEMA flood zone
- X (unshaded)
- Chance of flooding over 30 yrs
- 0.0%
- Est. flood insurance / yr
- $507 – $1,088
Fire risk 5/10 · Moderate
- Est. fire insurance / yr
- $2,463 – $4,575
Heat risk 6/10 · Moderate
- Hot days now (above 112°F)
- 7 days/yr
- Hot days in 30 yrs
- 20 days/yr
Wind risk 4/10 · Minor
- Chance of severe wind over 30 yrs
- 11.0%
Air-quality risk 3/10 · Minor
- Unhealthy air days now
- 2 days/yr
- Unhealthy air days in 30 yrs
- 3 days/yr
Risk factors via First Street. Map © Google.
Why this score? — see what drove the B- grade
The composite is a weighted blend of 9 inputs, each scored 0–100. Each bar is that input's sub-score; the figure is the points it added to the 100-point composite (weight × sub-score).
- Cash flow +30.0/30.0
- 1% rule +10.0/10.0
- DSCR +10.0/10.0
- ARV discount +6.6/15.0
- Rent growth +4.3/5.0
- Livability +2.9/5.0
- Condition / age +2.5/5.0
- Schools +1.1/10.0
- Appreciation +0.0/10.0
$90,000
🖨 Deal sheet (PDF) 📄 Offer letter ✓ Due diligence
Listing remarks
Introducing a charming 3-bedroom, 1-bath home nestled on a corner lot. This well-maintained property features a roof that’s just two years old, ensuring durability and peace of mind for years to come. Enjoy the comfort of a new gas hot water tank, providing efficient and reliable service. The home also boasts brand-new windows, enhancing energy efficiency and allowing natural light to flood the living spaces. With a spacious layout, this house is perfect for families or anyone looking for a cozy retreat. Don’t miss the opportunity to make this lovely home yours!
Key facts
- Brand-new windows
- Corner lot
- 0.3 acre lot
Tags
Property features AI
Exterior
- Parking: 2-car garage; Carport
- Security: No safety shelter
- Utilities: Electricity available; Natural gas available; Public water; Public sewer
- Home design: Single-story; Faces south; Crawlspace foundation
- Construction: Block and HardiPlank-type exterior; Asphalt/fiberglass roof; Built (year per public records)
- Exterior features: Corner lot; Satellite dish; No additional exterior features listed
Interior
- Flooring: Vinyl flooring
- Bathrooms: 1 full bathroom
- Heating & cooling: Floor furnace (gas); Window cooling unit(s)
- Interior features: Laminate counters; Cable TV ready; Ceiling fan(s); Vinyl windows, insulated and storm
- Laundry & utility: Gas water heater
Neighborhood map
What this means for you Summary
Snapshot
- This is a 3-bed/1.0-bath single-family listed at $90k.
Deal economics
- At list price, monthly cash flow is $512 ($6k/yr) — positive.
- The deal already cash-flows at list — no discount required.
- Meets the 1% rule at list price ($1k rent vs $90k).
- Recommended offer: $79k (12.0% below list) — sets the bar for market timing.
- Cap rate 13.1% vs local median 4.6% in Ardmore — top-decile yield for the area; either an underpriced asset or a hidden risk that comps aren't pricing in. Stress-test before assuming the spread holds.
Location & tenants
- Location reads 58/100 on livability (#447 in OK) — a working-class tenant base; expect higher turnover. Strengths: cost of living A+, housing A+; Watch: schools F, crime F, amenities F.
- Ardmore (town): math 12% / reading 15% proficiency, ranked #241 of 270 in OK (top 89%) — low school quality limits family demand, transient renter base, plan for 1-2y turnover; 73% free/reduced lunch — lower-income household profile, screen leases tightly.
- Market conditions: Rents rising fast (+7.4%/yr); 379 active listings in the ZIP; 73 units permitted in Carter County in 2024 (0 in 5+ unit buildings).
Forward outlook
- Local home prices are declining (-3.0%/yr); year-one equity from $622 of loan paydown is wiped out by about $3k of value loss. Plan a longer hold.
- Carter County population projected at +9% by 2050 — modest demand growth; plan on rents tracking national, not racing it.
- At projected returns (-3.0% appreciation + 7.4% rent growth), your $25k cash investment doubles in ~5 years — after that, you're playing with house money.
Negotiation context
- It's been on market 271 days — a 12% lower offer ($79k) is reasonable based on typical stale-listing flexibility.
Risks & watch-outs
- Watch-outs: built in 1932 — expect roof / HVAC / electrical / plumbing capex.
- Climate carrying-cost: moderate wildfire risk; extreme-heat days projected 7→20/yr by 2055 (HVAC capex compounding) — expect insurance premiums to compound above CPI over the hold.
Questions for the listing agent
- It's been on market 271 days. Have you received any prior offers? Is the seller open to a 12% concession, seller financing, or rate buy-down credit?
- Built in 1932 — when were the roof, HVAC, electrical panel, plumbing, and water heater last replaced?
- Why hasn't it sold? Are there any deal-killer items the seller is aware of (foundation, flood, title, zoning, code violations)?
- Is there a deadline driving the sale (1031 exchange, divorce, estate, relocation)? That informs how much negotiation room exists.
- Schools are F-rated, which usually means shorter tenancies and higher turnover. Who's the typical renter profile here, and what's been the actual vacancy rate?
- Crime grade is F in this area — have there been break-ins, vandalism, or insurance claims at this property in the last 3 years? What carrier currently insures it and at what premium?
- What's the average days-on-market for RENTAL listings here right now (not sales)? A rising rental-DOM trend means longer vacancies and softer asking-rent achievability than the comps imply.
- What's the recent tenant-quality profile in this submarket — average credit score on applications, eviction rate, late-payment / NSF rate, and stable-employment percentage? A property-management company in the area should have these aggregated.
- How much new for-sale + rental construction is in the pipeline within 1–3 miles? Heavy new supply typically softens prices + rents 12–24 months out; constrained supply supports both.
Investment metrics
- 1% rule
- 1.54% ✓
- Cap rate
- 13.12%
- Cash-on-cash
- 24.40%
- DSCR
- 2.09
- GRM
- 5.4
CMA / ARV
- ARV (on-the-fly)
- $88,209
- Comps found
- 12
Show comp detail 12 sales within ~0.75 mi
| Address | Dist | Beds/Ba | Sqft | Sold | Price | $/sf | Match |
|---|---|---|---|---|---|---|---|
| 41 G SE | 0.23mi | 3/1.0 | 1,156 (+6%) | 1mo | $50,000 | $43 | 78 |
| 1212 Martin Luther King Blvd | 0.53mi | 2/1.0 (-1) | 1,104 (+1%) | 3mo | $30,000 | $27 | 65 |
| 915 Martin Luther King Dr | 0.37mi | 3/1.0 | 1,223 (+12%) | 3mo | $41,000 | $34 | 60 |
| 306 G St SE | 0.50mi | 3/2.0 | 1,032 (-5%) | 9mo | $129,000 | $125 | 57 |
| 20 8th NW | 0.69mi | 3/1.0 | 1,109 (+2%) | 10mo | $80,000 | $72 | 56 |
| 206 I St NE | 0.23mi | 2/1.0 (-1) | 936 (-14%) | 10mo | $98,000 | $105 | 52 |
| 426 E St SE | 0.67mi | 2/1.0 (-1) | 1,044 (-4%) | 6mo | $85,000 | $81 | 52 |
| 1003 NE 8th Ave | 0.54mi | 3/1.5 | 997 (-8%) | 12mo | $19,500 | $20 | 49 |
| 441 Carter St SE | 0.74mi | 2/1.0 (-1) | 1,025 (-6%) | 3mo | $92,000 | $90 | 48 |
| 402 E St NW | 0.61mi | 2/1.0 (-1) | 996 (-8%) | 5mo | $102,000 | $102 | 48 |
| 701 4th Ave SE | 0.57mi | 3/1.0 | 1,235 (+13%) | 10mo | $35,000 | $28 | 43 |
| 113 10th Ave NE | 0.69mi | 2/1.0 (-1) | 938 (-14%) | 3mo | $83,000 | $88 | 37 |
Match score weights: distance 35% · size 25% · config 20% · recency 20%. Top-matched comps best support the ARV.
Projected returns pro-forma
-3.0% appreciation · 7.38% rent growth · sell at horizon
- IRR
- 22.4%
- Equity multiple
- 1.97×
- Total profit
- $24,426
- Equity at exit
- $13,419
- IRR
- 33.1%
- Equity multiple
- 4.65×
- Total profit
- $91,941
- Equity at exit
- $7,782
Cash invested: $25,200 (down + closing). Projections, not guarantees.
Landlord ↔ Tenant lean methodology
- Overall (STATE)
- 83 Strongly Landlord-Friendly
- State Oklahoma
- 83 Strongly Landlord-Friendly · R+20
- County
- — inherits STATE
- City
- — inherits STATE
ZIP-level market 73401
- Home prices YoY
- -21.7%
- Rents YoY
- 7.4%
- Active inventory
- 379
- Price-to-rent
- 5.4×
Monthly cashflow live
- Estimated rent
- $1,387 medium interval (Pro) →
- Mortgage (P&I)
- −$472
- Tax from tax record
- −$74 /mo · $884/yr
- Insurance
- −$38
- HOA
- −$0
- Vacancy / Maint / Mgmt
- −$291
- Net cashflow
- $512
Break-even live
Sensitivity live
| Price | -10% $563 | -5% $538 | +0% $512 | +5% $487 | +10% $461 |
|---|---|---|---|---|---|
| Rent | -10% $403 | -5% $458 | +0% $512 | +5% $567 | +10% $622 |
| Rate | -1.0pp $558 | -0.5pp $535 | base $512 | +0.5pp $489 | +1.0pp $465 |
UW: 25.0% down · 7.5% · 30yr · 1.5% tax · 5.0% vac · 8.0% maint · 8.0% mgmt
Financing live
Cash to close
- Down payment
- $22,500
- Closing costs
- $2,700
- Reserves months
- —
- Total cash needed
- —
Loan-product check · same deal, 3 products live
Conventional
25% down · 7.5% · 30yr
- Down + closing
- —
- Monthly P&I
- —
- Monthly cashflow
- —
- DSCR
- —
- Eligible?
- —
Personal DTI + credit; lowest rate.
DSCR
20% down · 8.5% · 30yr
- Down + closing
- —
- Monthly P&I
- —
- Monthly cashflow
- —
- DSCR
- —
- Eligible?
- —
No personal income docs; deal must DSCR.
Hard money
10% down · 12.0% · 12mo
- Down + closing
- —
- Monthly P&I
- —
- Monthly cashflow
- —
- DSCR
- —
- Eligible?
- —
Short-term bridge; refi at stabilization.
Listing history 20 events
-
2026-06-19days on market $90,000 Active 271 DOM
-
2026-06-18days on market $90,000 Active 270 DOM
-
2026-06-17days on market $90,000 Active 269 DOM
-
2026-06-16days on market $90,000 Active 268 DOM
-
2026-06-15days on market $90,000 Active 267 DOM
-
2026-06-14days on market $90,000 Active 265 DOM
-
2026-06-12days on market $90,000 Active 264 DOM
-
2026-06-09days on market $90,000 Active 261 DOM
-
2026-06-08days on market $90,000 Active 260 DOM
-
2026-06-07days on market $90,000 Active 259 DOM
-
2026-06-05days on market $90,000 Active 256 DOM
-
2026-06-03days on market $90,000 Active 255 DOM
-
2026-06-02days on market $90,000 Active 254 DOM
-
2026-06-01days on market $90,000 Active 253 DOM
-
2026-05-31days on market $90,000 Active 252 DOM
-
2026-05-30days on market $90,000 Active 251 DOM
-
2026-05-19price $90,000
-
2026-01-26price $100,000
-
2025-11-23price $115,000
-
2025-09-21$125,000 Active
ⓘ Source: listings_history table (triggers on properties + properties_extension) + one-shot
backfill from property_details.listing_events for pre-trigger history.
Tax reassessment forecast OK · Resets to sale price
- Current annual tax
- $884 · $74/mo
- Projected year-2 tax
- $884 · $74/mo
- Expected delta
- $0/yr ($0/mo · 0.0%)
ⓘ Screening estimate from a state-policy table — verify with the county assessor before closing.
Climate risk First Street
- Flood 1/10 Low FEMA zone X (unshaded) · 0% chance over 30 yrs
- Wildfire 5/10 Major
- Heat 6/10 Major 7 d/yr ≥112°F today · 20 d/yr by 30 yrs out
- Wind 4/10 Moderate 11% chance of damaging wind over 30 yrs
- Air quality 3/10 Moderate 2 unhealthy d/yr today · 3 by 30 yrs out
Nearby sold comps map
Loading sold comps map…
Walkable amenities ~0.75 mi
Loading nearby amenities…
Taxation est. · year 1
- Rental income
- $16,640
- − Mortgage interest
- −$5,041
- − Property taxes
- −$884
- − Insurance
- −$450
- − Repairs & maintenance
- −$1,331
- − Management
- −$1,331
- − Depreciation
- −$2,618
- Taxable income
- $4,984
- Est. tax owed @ 24.0%
- −$1,196
- After-tax cash flow
- $4,952/yr
For passive investors: Depreciation is non-cash, so a rental often shows a tax loss while cash-flowing — sheltering income. Rental losses are passive: they offset passive income freely, and up to $25,000/yr can offset ordinary (W-2) income if you actively participate and your MAGI is under $100k (phasing out to $0 by $150k); unused losses carry forward. On sale, claimed depreciation is recaptured at up to 25%, and gains may owe capital-gains tax (a 1031 exchange can defer both). Figures are a year-1 estimate at your 24.0% rate — not tax advice; consult a CPA.
Schools (NCES district)
- District
- Ardmore
- NCES district ID
- 4003180
- Math proficiency
- 12% ▼ -7.00%
- Reading proficiency
- 15% ▼ -6.00%
- Median HH income
- $35,194
- Composite
- 11.1/100
- National rank
- #9733
- State rank
- #241 of 270 in OK
Livability — Ardmore
- Score
- 58/100
- State rank
- #447
- US rank
- #21387
Category grades
Schools grade is shown separately in the Schools card above.
Census & demographics
- Census place
- Ardmore, OK
- County
- Carter County · 36,833 people
- City population
- 36,833
- Metro
- Ardmore, OK
- Population (ZIP)
- 36,833
- Household income
- $61,989
- Rent vs Own
- Severe rent burden
- 1026.0
Population outlook (Carter County) Hauer SSP2
- Today (2025)
- 50,892 people
- By 2030
- 51,913 · +2.0%
- By 2040
- 53,857 · +5.8%
- By 2050
- 55,604 · +9.3%
- By 2075
- 60,670 · +19.2%
- By 2100
- 62,366 · +22.5%
Race, ethnicity, and origin ACS 2023
- Neighborhood character
- Diverse neighborhood (Simpson 0.57)
- Race & ethnicity
- White 65% Two or more races 14% Hispanic / Latino 9% Native American 8% Black 7% Asian 1%
- Hispanic origin (detail)
- Mexican 7%
- Common ancestry
- Slovak 2% Lithuanian 1% Italian 1%
- Foreign-born
- 4% · Canada
- Languages at home
- 92% English-only · Spanish 5%
Political lean MEDSL · Carter
- 2024 margin
- Solid R (+54.7) · D 21.9% · R 76.7% · Other 1.4%
- 2008→2024 swing
- -14.2pp toward R · 2008: -40.5pp · 2024: -54.7pp
- All cycles
- 2024: R+54.7 2020: R+52.5 2016: R+52.6 2012: R+42.7 2008: R+40.5
Not yet ingested
- Civics
- —
Market trends
- HPI YoY
- ▼ -74.93%
- Current HPI
- 269.7381
- Rent YoY
- ▲ 7.38%
- Metro
- Ardmore, OK
- State GDP YoY
- ▲ 1.55%
- F500 in state
- 6
Industry mix (Fortune 500 HQ in OK)
| Industry | F500 HQs | Revenue |
|---|---|---|
| Energy | 3 | $48B |
|
||
Price history
-28.0% since first listed4 events — show timeline
- 2026-05-19 Price Changed $90,000 MLS Technology, Inc.
- 2026-01-26 Price Changed $100,000 MLS Technology, Inc.
- 2025-11-23 Price Changed $115,000 MLS Technology, Inc.
- 2025-09-21 Listed $125,000 MLS Technology, Inc.
Property tax history
+8.1%/yrLatest (2025): $884 · +9.8% YoY. Source: county tax records.
Cash-flow waterfall
monthlySold comps — $/sqft
last 12 mo · ≤1 miLoading sold comps…