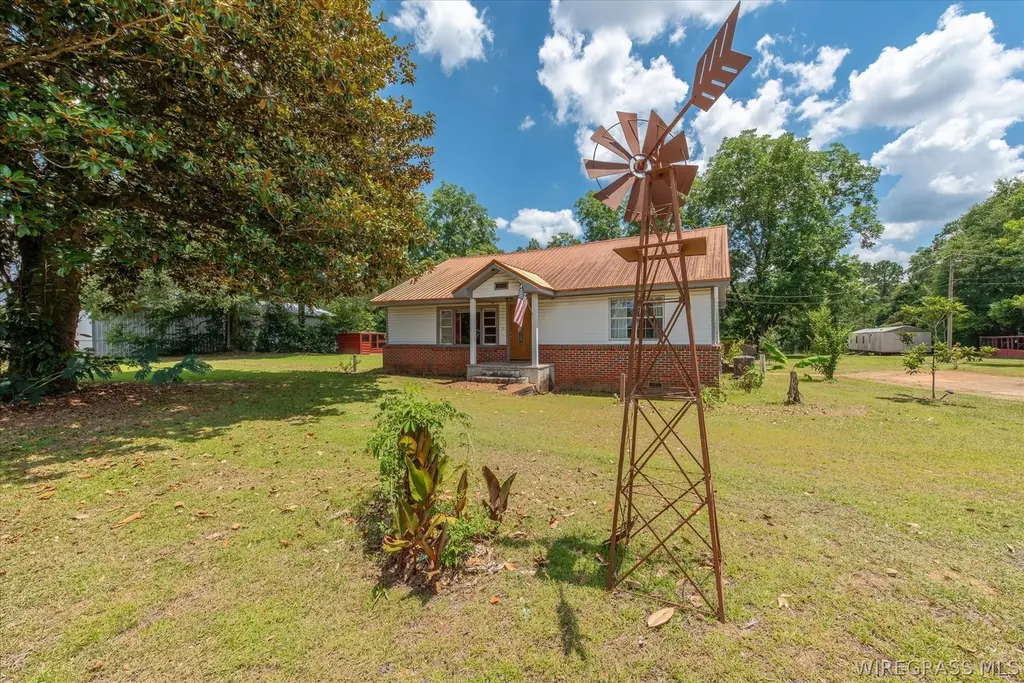
3950 Rucker Blvd · Enterprise, AL
Flood risk 1/10 · Minimal
- FEMA flood zone
- X (unshaded)
- Chance of flooding over 30 yrs
- 0.0%
- Est. flood insurance / yr
- $507 – $1,088
Fire risk 3/10 · Minor
- Est. fire insurance / yr
- $916 – $1,700
Heat risk 8/10 · Major
- Hot days now (above 106°F)
- 7 days/yr
- Hot days in 30 yrs
- 19 days/yr
Wind risk 8/10 · Major
- Chance of severe wind over 30 yrs
- 99.0%
Air-quality risk 2/10 · Minimal
- Unhealthy air days now
- 0 days/yr
- Unhealthy air days in 30 yrs
- 1 days/yr
Risk factors via First Street. Map © Google.
Why this score? — see what drove the C+ grade
The composite is a weighted blend of 9 inputs, each scored 0–100. Each bar is that input's sub-score; the figure is the points it added to the 100-point composite (weight × sub-score).
- Cash flow +25.0/30.0
- ARV discount +15.0/15.0
- DSCR +8.2/10.0
- 1% rule +5.2/10.0
- Rent growth +3.5/5.0
- Livability +3.2/5.0
- Condition / age +2.5/5.0
- Schools +2.0/10.0
- Appreciation +0.0/10.0
$155,000
🖨 Deal sheet 📄 Offer letter ✓ Due diligence
Listing remarks
Rare opportunity on approximately 2 acres with prime frontage along highly visible Rucker Boulevard! This 3-bedroom, 1.5-bath home offers a true value-add opportunity for investors, renovators, or buyers looking for space, flexibility, and long-term potential. The property features a greenhouse, chicken coops, and multiple outbuildings, reflecting its past use as a productive homestead or possible nursery setup. With open acreage and excellent road visibility, the site offers endless possibilities—whether you envision a renovation project, hobby farm, small business use, storage/workshop space, or future investment hold. Conveniently located near Enterprise, Fort Novosel, shopping, di
Key facts
- Chicken coops
- Greenhouse
- Open acreage
Tags
Property features AI
Exterior
- Parking: Driveway
- Utilities: Public water; Public sewer
- Home design: Single family residence; One story
- Construction: Brick and vinyl siding construction
- Exterior features: Covered patio; Patio; Partial fencing; Fenced
Interior
- Kitchen: Microwave
- Flooring: Carpet; Laminate; Vinyl
- Bathrooms: 1 full bathroom; 1 half bathroom
- Heating & cooling: Central heating; Hot water heating; Electric heating; Central air conditioning; Ceiling fan(s); Electric cooling
- Interior features: Electric water heater; Microwave
- Laundry & utility: Washer hookup; Washer included
Neighborhood map
What this means for you Summary
Snapshot
- This is a 3-bed/1.0-bath single-family listed at $155k.
Deal economics
- At list price, monthly cash flow is $339 ($4k/yr) — positive.
- The deal already cash-flows at list — no discount required.
- Meets the 1% rule at list price ($2k rent vs $155k).
- Cap rate 8.9% vs local median 4.2% in Enterprise — top-decile yield for the area; either an underpriced asset or a hidden risk that comps aren't pricing in. Stress-test before assuming the spread holds.
Location & tenants
- Location reads 65/100 on livability (#127 in AL) — a middle-class / working-renter tenant base. Strengths: cost of living A+, housing A+; Watch: health & safety D, crime F, amenities F.
- Daleville City (town): math 9% / reading 37% proficiency, ranked #97 of 129 in AL (top 75%) — low school quality limits family demand, transient renter base, plan for 1-2y turnover; 62% free/reduced lunch — lower-income household profile, screen leases tightly.
- Market conditions: Rents rising (+3.9%/yr); 441 active listings in the ZIP; 6 comparable units currently listed for rent nearby; rentals lingering (median 44d on market — plan ~5-8 weeks vacancy on turnover, expect pricing pressure); 100% of comp listings sitting > 30 days — soft ceiling on asking rent; solid renter incomes; 38 units permitted in Dale County in 2024 (0 in 5+ unit buildings).
Forward outlook
- Local home prices are declining (-3.0%/yr); year-one equity from $1k of loan paydown is wiped out by about $5k of value loss. Plan a longer hold.
- Dale County population projected at -20% by 2050 — secular population decline; favor cash flow + early exit over multi-decade hold.
Negotiation context
- Only 7 days on market — expect competitive offers; lowballing is unlikely to land.
- 3 sale attempts since 19y ago with the ask held roughly flat each time — persistent listings suggest the price (not the market) is what's stuck; bring a comps-based counter.
- Current owner paid $90k; list at $155k implies a 72% gain — meaningful room to come down on a strong offer.
Risks & watch-outs
- Watch-outs: built in 1920 — expect roof / HVAC / electrical / plumbing capex.
- Climate carrying-cost: severe wind risk, 99% chance of damaging wind over 30y; extreme-heat days projected 7→19/yr by 2055 (HVAC capex compounding) — expect insurance premiums to compound above CPI over the hold.
Questions for the listing agent
- Built in 1920 — when were the roof, HVAC, electrical panel, plumbing, and water heater last replaced?
- Is there a deadline driving the sale (1031 exchange, divorce, estate, relocation)? That informs how much negotiation room exists.
- Crime grade is F in this area — have there been break-ins, vandalism, or insurance claims at this property in the last 3 years? What carrier currently insures it and at what premium?
- What's the average days-on-market for RENTAL listings here right now (not sales)? A rising rental-DOM trend means longer vacancies and softer asking-rent achievability than the comps imply.
- What's the recent tenant-quality profile in this submarket — average credit score on applications, eviction rate, late-payment / NSF rate, and stable-employment percentage? A property-management company in the area should have these aggregated.
- How much new for-sale + rental construction is in the pipeline within 1–3 miles? Heavy new supply typically softens prices + rents 12–24 months out; constrained supply supports both.
Investment metrics
- 1% rule
- 1.02% ✓
- Cap rate
- 8.92%
- Cash-on-cash
- 9.37%
- DSCR
- 1.42
- GRM
- 8.2
CMA / ARV
- ARV (on-the-fly)
- $261,330
- Comps found
- 12
Show comp detail 12 sales within ~0.75 mi
| Address | Dist | Beds/Ba | Sqft | Sold | Price | $/sf | Match |
|---|---|---|---|---|---|---|---|
| 212 Clearview Dr | 0.36mi | 3/2.0 | 1,726 (+2%) | 0mo | $335,000 | $194 | 75 |
| 110 Cristy Ln | 0.30mi | 3/2.0 | 1,610 (-4%) | 1mo | $249,000 | $155 | 74 |
| 100 E Pondella | 0.43mi | 3/2.0 | 1,691 (+0%) | 9mo | $200,000 | $118 | 68 |
| 110 Palisades Dr | 0.35mi | 3/2.0 | 1,551 (-8%) | 2mo | $205,000 | $132 | 64 |
| 107 Fountain Crst | 0.52mi | 3/2.0 | 1,720 (+2%) | 5mo | $233,000 | $135 | 64 |
| 102 Remington Way | 0.63mi | 3/2.0 | 1,689 (+0%) | 10mo | $245,000 | $145 | 58 |
| 103 Coral Way | 0.60mi | 3/2.0 | 1,755 (+4%) | 7mo | $170,000 | $97 | 56 |
| 114 Autumn Way | 0.69mi | 3/2.0 | 1,737 (+3%) | 7mo | $235,000 | $135 | 53 |
| 103 Fountain Crest Dr | 0.51mi | 3/2.0 | 1,533 (-9%) | 6mo | $270,000 | $176 | 52 |
| 101 Fountain Crest Dr | 0.51mi | 4/2.0 (+1) | 1,823 (+8%) | 2mo | $315,000 | $173 | 51 |
| 115 Cristy Ln | 0.35mi | 4/3.0 (+1) | 1,890 (+12%) | 10mo | $299,000 | $158 | 43 |
| 178 Dale Ave | 0.72mi | 3/2.0 | 1,436 (-15%) | 0mo | $245,000 | $171 | 38 |
Match score weights: distance 35% · size 25% · config 20% · recency 20%. Top-matched comps best support the ARV.
Projected returns pro-forma
-3.0% appreciation · 3.92% rent growth · sell at horizon
- IRR
- -1.3%
- Equity multiple
- 0.95×
- Total profit
- $-2,116
- Equity at exit
- $23,111
- IRR
- 9.2%
- Equity multiple
- 1.73×
- Total profit
- $31,851
- Equity at exit
- $13,402
Cash invested: $43,400 (down + closing). Projections, not guarantees.
Landlord ↔ Tenant lean methodology
- Overall (STATE)
- 90 Strongly Landlord-Friendly
- State Alabama
- 90 Strongly Landlord-Friendly · R+15
- County
- — inherits STATE
- City
- — inherits STATE
ZIP-level market 36330
- Home prices YoY
- -19.4%
- Rents YoY
- 3.9%
- Active inventory
- 441
- Price-to-rent
- 8.2×
Monthly cashflow live
- Estimated rent
- $1,584 high interval (Pro) →
- Mortgage (P&I)
- −$813
- Tax from tax record
- −$35 /mo · $421/yr
- Insurance
- −$65
- HOA
- −$0
- Vacancy / Maint / Mgmt
- −$333
- Net cashflow
- $339
Break-even live
UW: 25.0% down · 7.5% · 30yr · 1.5% tax · 5.0% vac · 8.0% maint · 8.0% mgmt
Financing live
Cash to close
- Down payment
- $38,750
- Closing costs
- $4,650
- Reserves months
- —
- Total cash needed
- —
Loan-product check · same deal, 3 products live
Conventional
25% down · 7.5% · 30yr
- Down + closing
- —
- Monthly P&I
- —
- Monthly cashflow
- —
- DSCR
- —
- Eligible?
- —
Personal DTI + credit; lowest rate.
DSCR
20% down · 8.5% · 30yr
- Down + closing
- —
- Monthly P&I
- —
- Monthly cashflow
- —
- DSCR
- —
- Eligible?
- —
No personal income docs; deal must DSCR.
Hard money
10% down · 12.0% · 12mo
- Down + closing
- —
- Monthly P&I
- —
- Monthly cashflow
- —
- DSCR
- —
- Eligible?
- —
Short-term bridge; refi at stabilization.
Rent comps 6 comps
| Address | Beds | Baths | Sqft | Rent | $/sqft | DOM | Units | Dist |
|---|---|---|---|---|---|---|---|---|
| 3830 Rucker Blvd Enterprise, AL | 3.0 | 2.0 | 1216 | $1,200 | $0.99 | 43d | 4 | 0.23mi |
| 203 Coral Way Enterprise, AL | 4.0 | 2.0 | 1583 | $1,950 | $1.23 | 43d | 1 | 0.63mi |
| 212 Dale Ave Enterprise, AL | 3.0 | 2.0 | 1432 | $1,700 | $1.19 | 43d | 1 | 0.69mi |
| 85 Courtyard Way Enterprise, AL | 3.0 | 2.5 | 1460 | $1,375 | $0.94 | 43d | 1 | 1.45mi |
| 203 Winthrope Ln Enterprise, AL | 2.0 | 2.5 | 1365 | $1,325 | $0.97 | 43d | 1 | 1.47mi |
| 155 Wingate Ave Enterprise, AL | 2.0 | 2.0 | 1600 | $1,450 | $0.91 | 43d | 1 | 1.50mi |
Listing history 7 events
-
2026-06-19days on market $155,000 Active 7 DOM
-
2026-06-18days on market $155,000 Active 6 DOM
-
2026-06-17days on market $155,000 Active 5 DOM
-
2026-06-16days on market $155,000 Active 4 DOM
-
2026-06-15days on market $155,000 Active 3 DOM
-
2026-06-12remarks 693-char remark
-
2026-06-12$155,000 Active 1 DOM
ⓘ Source: listings_history table (triggers on properties + properties_extension) + one-shot
backfill from property_details.listing_events for pre-trigger history.
Tax reassessment forecast AL · Resets to sale price
- Current annual tax
- $421 · $35/mo
- Projected year-2 tax
- $636 · $53/mo
- Expected delta
- +$214/yr (+$18/mo · 50.9%)
ⓘ Screening estimate from a state-policy table — verify with the county assessor before closing.
Climate risk First Street
- Flood 1/10 Low FEMA zone X (unshaded) · 0% chance over 30 yrs
- Wildfire 3/10 Moderate
- Heat 8/10 Severe 7 d/yr ≥106°F today · 19 d/yr by 30 yrs out
- Wind 8/10 Severe 99% chance of damaging wind over 30 yrs
- Air quality 2/10 Low 0 unhealthy d/yr today · 1 by 30 yrs out
Nearby sold comps map
Loading sold comps map…
Walkable amenities ~0.75 mi
Loading nearby amenities…
Taxation est. · year 1
- Rental income
- $19,011
- − Mortgage interest
- −$8,682
- − Property taxes
- −$421
- − Insurance
- −$775
- − Repairs & maintenance
- −$1,521
- − Management
- −$1,521
- − Depreciation
- −$4,509
- Taxable income
- $1,582
- Est. tax owed @ 24.0%
- −$380
- After-tax cash flow
- $3,689/yr
For passive investors: Depreciation is non-cash, so a rental often shows a tax loss while cash-flowing — sheltering income. Rental losses are passive: they offset passive income freely, and up to $25,000/yr can offset ordinary (W-2) income if you actively participate and your MAGI is under $100k (phasing out to $0 by $150k); unused losses carry forward. On sale, claimed depreciation is recaptured at up to 25%, and gains may owe capital-gains tax (a 1031 exchange can defer both). Figures are a year-1 estimate at your 24.0% rate — not tax advice; consult a CPA.
Schools (NCES district)
- District
- Daleville City
- NCES district ID
- 0101080
- Math proficiency
- 9% ▼ -18.00%
- Reading proficiency
- 37% ▲ 1.00%
- Median HH income
- $45,865
- Composite
- 19.89/100
- National rank
- #8687
- State rank
- #97 of 129 in AL
Livability — Enterprise
- Score
- 65/100
- State rank
- #127
- US rank
- #12953
Category grades
Schools grade is shown separately in the Schools card above.
Census & demographics
- County
- Coffee County · 39,557 people
- City population
- 39,557
- Metro
- Enterprise, AL
- Population (ZIP)
- 39,557
- Household income
- $75,765
- Rent vs Own
- Severe rent burden
- 1126.0
Population outlook (Dale County) Hauer SSP2
- Today (2025)
- 46,805 people
- By 2030
- 45,176 · -3.5%
- By 2040
- 41,523 · -11.3%
- By 2050
- 37,575 · -19.7%
- By 2075
- 28,931 · -38.2%
- By 2100
- 22,172 · -52.6%
Race, ethnicity, and origin ACS 2023
- Neighborhood character
- Diverse neighborhood (Simpson 0.56)
- Race & ethnicity
- White 63% Black 17% Hispanic / Latino 13% Two or more races 9% Asian 1%
- Hispanic origin (detail)
- Mexican 6% Puerto Rican 3%
- Common ancestry
- Italian 3% Lithuanian 2% Serbian 2%
- Foreign-born
- 6% · Canada, Vietnam, South Korea
- Languages at home
- 89% English-only · Spanish 8% German/W. Germanic 2%
Political lean MEDSL · Dale
- 2024 margin
- Solid R (+52.3) · D 23.5% · R 75.8%
- 2008→2024 swing
- -7.7pp toward R · 2008: -44.6pp · 2024: -52.3pp
- All cycles
- 2024: R+52.3 2020: R+46.3 2016: R+50.4 2012: R+42.2 2008: R+44.6
Not yet ingested
- Civics
- —
Market trends
- HPI YoY
- ▼ -44.44%
- Current HPI
- 184.0163
- Rent YoY
- ▲ 3.92%
- Metro
- Enterprise, AL
- State GDP YoY
- ▲ 2.94%
- F500 in state
- 4
Industry mix (Fortune 500 HQ in AL)
| Industry | F500 HQs | Revenue |
|---|---|---|
| Financial Services | 1 | $8B |
|
||
| Healthcare | 1 | $5B |
|
||
Price history
+9.3% since first listed4 events — show timeline
- 2026-06-12 Listed $155,000 WBR
- 2021-03-02 Sold (Public Records) $90,000 Public Records
- 2007-03-29 Listed $141,750 WBR
- 2007-03-29 Listed $141,750 MAAR
Property tax history
-3.1%/yrLatest (2025): $421 · +5.8% YoY. Source: county tax records.
Cash-flow waterfall
monthlySold comps — $/sqft
last 12 mo · ≤1 miLoading sold comps…