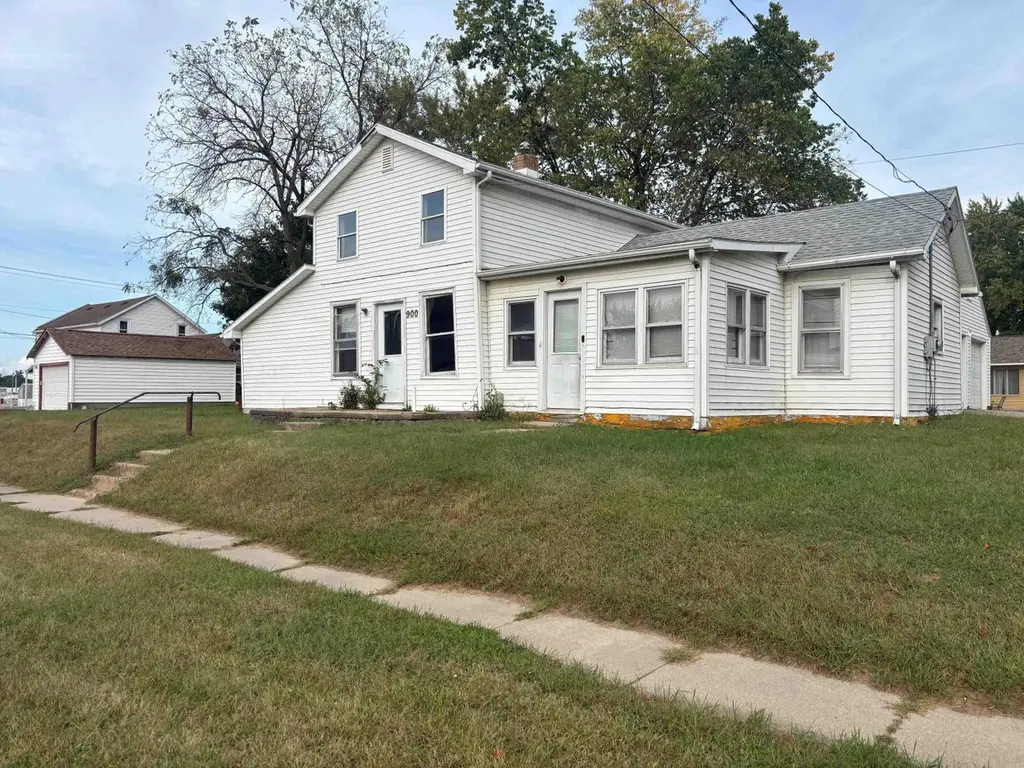
900 NE 2nd Ave · Independence, IA
Flood risk 1/10 · Minimal
- FEMA flood zone
- X (unshaded)
- Chance of flooding over 30 yrs
- 0.0%
- Est. flood insurance / yr
- $473 – $860
Fire risk 4/10 · Minor
- Est. fire insurance / yr
- $902 – $1,676
Heat risk 3/10 · Minor
- Hot days now (above 101°F)
- 7 days/yr
- Hot days in 30 yrs
- 15 days/yr
Wind risk 2/10 · Minimal
- Chance of severe wind over 30 yrs
- —
Air-quality risk 1/10 · Minimal
- Unhealthy air days now
- 0 days/yr
- Unhealthy air days in 30 yrs
- 0 days/yr
Risk factors via First Street. Map © Google.
Why this score? — see what drove the B grade
The composite is a weighted blend of 9 inputs, each scored 0–100. Each bar is that input's sub-score; the figure is the points it added to the 100-point composite (weight × sub-score).
- Cash flow +30.0/30.0
- 1% rule +10.0/10.0
- DSCR +10.0/10.0
- ARV discount +7.5/15.0
- Schools +6.3/10.0
- Livability +3.8/5.0
- Rent growth +2.5/5.0
- Condition / age +2.5/5.0
- Appreciation +0.0/10.0
$64,900
🖨 Deal sheet 📄 Offer letter ✓ Due diligence
Listing remarks MLS
Nice investment or starter home with 3 bedrooms and 1st floor laundry.
Key facts
- 3,872 sq ft lot
- Garage
- Built 1910
Neighborhood map
What this means for you Summary
Snapshot
- This is a 3-bed/1.0-bath single-family listed at $65k.
Deal economics
- At list price, monthly cash flow is $404 ($5k/yr) — positive.
- The deal already cash-flows at list — no discount required.
- Meets the 1% rule at list price ($1k rent vs $65k).
- Recommended offer: $57k (12.0% below list) — sets the bar for market timing.
- Cap rate 13.8% vs local median 3.6% in Independence — top-decile yield for the area; either an underpriced asset or a hidden risk that comps aren't pricing in. Stress-test before assuming the spread holds.
Location & tenants
- Location reads 76/100 on livability (#198 in IA, #3,628 nationally) — a middle-class / working-renter tenant base. Strengths: crime A+, cost of living A+, housing A+; Watch: amenities F, commute F.
- Independence Community School District (rural): math 73% / reading 74% proficiency, ranked #86 of 289 in IA (top 30%) — strong family-tenant draw, lease renewals of 3-5y typical.
- Market conditions: 61 active listings in the ZIP; 6 comparable units currently listed for rent nearby; rentals lingering (median 44d on market — plan ~5-8 weeks vacancy on turnover, expect pricing pressure); 50% of comp listings sitting > 30 days — soft ceiling on asking rent; 19 units permitted in Buchanan County in 2024 (0 in 5+ unit buildings).
Forward outlook
- Local home prices are declining (-3.0%/yr); year-one equity from $449 of loan paydown is wiped out by about $2k of value loss. Plan a longer hold.
- Buchanan County population projected to shrink 9% by 2050 — rents likely to lag national; underwrite the cash flow, not the appreciation.
- At projected returns (-3.0% appreciation + 3.0% rent growth), your $18k cash investment doubles in ~5 years — after that, you're playing with house money.
Negotiation context
- It's been on market 254 days — a 12% lower offer ($57k) is reasonable based on typical stale-listing flexibility.
- 2 sale attempts since 6y ago; this cycle's ask has dropped $10k (13%) from the opening price — seller is motivated, your offer sets the floor, not the list.
- Current owner paid $38k; list at $65k implies a 69% gain — meaningful room to come down on a strong offer.
Risks & watch-outs
- Watch-outs: built in 1910 — expect roof / HVAC / electrical / plumbing capex.
Questions for the listing agent
- It's been on market 254 days. Have you received any prior offers? Is the seller open to a 12% concession, seller financing, or rate buy-down credit?
- Built in 1910 — when were the roof, HVAC, electrical panel, plumbing, and water heater last replaced?
- Why hasn't it sold? Are there any deal-killer items the seller is aware of (foundation, flood, title, zoning, code violations)?
- Is there a deadline driving the sale (1031 exchange, divorce, estate, relocation)? That informs how much negotiation room exists.
- Schools are A-rated — typically a magnet for longer-tenancy family renters. What's the average tenant stay here, and is there a school-zone premium baked into asking?
- What's the average days-on-market for RENTAL listings here right now (not sales)? A rising rental-DOM trend means longer vacancies and softer asking-rent achievability than the comps imply.
- What's the recent tenant-quality profile in this submarket — average credit score on applications, eviction rate, late-payment / NSF rate, and stable-employment percentage? A property-management company in the area should have these aggregated.
- How much new for-sale + rental construction is in the pipeline within 1–3 miles? Heavy new supply typically softens prices + rents 12–24 months out; constrained supply supports both.
Investment metrics
- 1% rule
- 1.65% ✓
- Cap rate
- 13.77%
- Cash-on-cash
- 26.69%
- DSCR
- 2.19
- GRM
- 5.0
CMA / ARV
- ARV (median comp)
- $142,432
- List price
- $64,900
- Delta
- -54.43%
- Verdict
- UNDERPRICED
- Comps
- 20 within 1.0 mi
Show comp detail 12 sales within ~0.75 mi
| Address | Dist | Beds/Ba | Sqft | Sold | Price | $/sf | Match |
|---|---|---|---|---|---|---|---|
| 812 NE 5th Ave. Ave | 0.21mi | 3/1.5 | 1,092 (+4%) | 2mo | $90,000 | $82 | 80 |
| 206 4th St NE | 0.36mi | 2/1.0 (-1) | 1,052 (+0%) | 11mo | $134,000 | $127 | 69 |
| 713 9th Ave NW | 0.59mi | 3/2.0 | 1,040 (-1%) | 5mo | $160,000 | $154 | 63 |
| 903 NE Park Ave | 0.37mi | 2/2.0 (-1) | 1,118 (+7%) | 0mo | $130,000 | $116 | 62 |
| 600 NE 8th Ave Ave | 0.48mi | 2/1.0 (-1) | 984 (-6%) | 3mo | $103,000 | $105 | 60 |
| 707 1st St. East St | 0.68mi | 3/1.0 | 1,125 (+7%) | 6mo | $72,000 | $64 | 51 |
| 615 5th ST St NE | 0.45mi | 2/2.0 (-1) | 960 (-8%) | 9mo | $250,000 | $260 | 48 |
| 505 NE 8th Avenue Ave | 0.50mi | 2/1.0 (-1) | 934 (-11%) | 6mo | $146,000 | $156 | 48 |
| 214 2nd St. S.w. St | 0.63mi | 2/2.0 (-1) | 1,104 (+5%) | 6mo | $65,000 | $59 | 47 |
| 1303 NE 8th Ave | 0.56mi | 2/1.5 (-1) | 1,146 (+9%) | 9mo | $160,000 | $140 | 44 |
| 808 W 1st St | 0.75mi | 3/1.0 | 1,199 (+14%) | 2mo | $42,000 | $35 | 39 |
| 501 2nd ST St NW | 0.60mi | 3/2.0 | 1,204 (+15%) | 9mo | $127,500 | $106 | 36 |
Match score weights: distance 35% · size 25% · config 20% · recency 20%. Top-matched comps best support the ARV.
Projected returns pro-forma
-3.0% appreciation · 3.0% rent growth · sell at horizon
- IRR
- 20.6%
- Equity multiple
- 1.84×
- Total profit
- $15,238
- Equity at exit
- $9,677
- IRR
- 28.8%
- Equity multiple
- 3.56×
- Total profit
- $46,468
- Equity at exit
- $5,611
Cash invested: $18,172 (down + closing). Projections, not guarantees.
Landlord ↔ Tenant lean methodology
- Overall (STATE)
- 83 Strongly Landlord-Friendly
- State Iowa
- 83 Strongly Landlord-Friendly · R+6
- County
- — inherits STATE
- City
- — inherits STATE
ZIP-level market 50644
- Home prices YoY
- -24.3%
- Active inventory
- 61
- Price-to-rent
- 5.0×
Monthly cashflow live
- Estimated rent
- $1,072 high interval (Pro) →
- Mortgage (P&I)
- −$340
- Tax from tax record
- −$75 /mo · $904/yr
- Insurance
- −$27
- HOA
- −$0
- Vacancy / Maint / Mgmt
- −$225
- Net cashflow
- $404
Break-even live
UW: 25.0% down · 7.5% · 30yr · 1.5% tax · 5.0% vac · 8.0% maint · 8.0% mgmt
Financing live
Cash to close
- Down payment
- $16,225
- Closing costs
- $1,947
- Reserves months
- —
- Total cash needed
- —
Loan-product check · same deal, 3 products live
Conventional
25% down · 7.5% · 30yr
- Down + closing
- —
- Monthly P&I
- —
- Monthly cashflow
- —
- DSCR
- —
- Eligible?
- —
Personal DTI + credit; lowest rate.
DSCR
20% down · 8.5% · 30yr
- Down + closing
- —
- Monthly P&I
- —
- Monthly cashflow
- —
- DSCR
- —
- Eligible?
- —
No personal income docs; deal must DSCR.
Hard money
10% down · 12.0% · 12mo
- Down + closing
- —
- Monthly P&I
- —
- Monthly cashflow
- —
- DSCR
- —
- Eligible?
- —
Short-term bridge; refi at stabilization.
Rent comps 6 comps
| Address | Beds | Baths | Sqft | Rent | $/sqft | DOM | Units | Dist |
|---|---|---|---|---|---|---|---|---|
| 608 6th St NW Independence, IA | 3.0 | 1.0 | 840 | $1,350 | $1.61 | 43d | 1 | 0.48mi |
| 309 9th Ave NE Independence, IA | 2.0 | 1.0 | 700 | $1,025 | $1.46 | 16d | 1 | 0.63mi |
| 609 1st St W Apt E Independence, IA | 2.0 | 1.0 | 768 | $875 | $1.14 | 21d | 1 | 0.73mi |
| 609 1st St W Apt D Independence, IA | 2.0 | 1.0 | 768 | $875 | $1.14 | 15d | 1 | 0.73mi |
| 403 9th Ave SW Independence, IA | 2.0 | 1.0 | 750 | $875 | $1.17 | 43d | 1 | 0.96mi |
| 608 8th Ave SW Independence, IA | 3.0 | 1.5 | 1421 | $1,250 | $0.88 | 43d | 1 | 1.02mi |
Listing history 11 events
-
2026-06-07statusdays on market $64,900 Pending 254 DOM
-
2026-06-04days on market $64,900 Active 252 DOM
-
2026-06-02days on market $64,900 Active 251 DOM
-
2026-06-01days on market $64,900 Active 250 DOM
-
2026-05-31days on market $64,900 Active 249 DOM
-
2026-05-31days on market $64,900 Active 248 DOM
-
2026-04-29price $64,900 70-char remark
Show marketing remark (70 chars)
Nice investment or starter home with 3 bedrooms and 1st floor laundry.
-
2026-03-23price $69,900 70-char remark
Show marketing remark (70 chars)
Nice investment or starter home with 3 bedrooms and 1st floor laundry.
-
2025-09-24$74,500 Active 70-char remark
Show marketing remark (70 chars)
Nice investment or starter home with 3 bedrooms and 1st floor laundry.
-
2020-12-15soldstatus $38,500 211-char remark
Show marketing remark (211 chars)
Nice investment or starter home with 3 bedrooms and 1st floor laundry. Newer furnace, breaker box, and a brand new water heater. Newer water line from street to house. Central air. 1 car garage. Appliances stay.
-
2020-11-09$47,500 211-char remark
Show marketing remark (211 chars)
Nice investment or starter home with 3 bedrooms and 1st floor laundry. Newer furnace, breaker box, and a brand new water heater. Newer water line from street to house. Central air. 1 car garage. Appliances stay.
ⓘ Source: listings_history table (triggers on properties + properties_extension) + one-shot
backfill from property_details.listing_events for pre-trigger history.
Tax reassessment forecast IA · Partial reset (capped growth)
- Current annual tax
- $904 · $75/mo
- Projected year-2 tax
- $961 · $80/mo
- Expected delta
- +$57/yr (+$5/mo · 6.4%)
ⓘ Screening estimate from a state-policy table — verify with the county assessor before closing.
Climate risk First Street
- Flood 1/10 Low FEMA zone X (unshaded) · 0% chance over 30 yrs
- Wildfire 4/10 Moderate
- Heat 3/10 Moderate 7 d/yr ≥101°F today · 15 d/yr by 30 yrs out
- Wind 2/10 Low
- Air quality 1/10 Low 0 unhealthy d/yr today · 0 by 30 yrs out
Nearby sold comps map
Loading sold comps map…
Walkable amenities ~0.75 mi
Loading nearby amenities…
Taxation est. · year 1
- Rental income
- $12,864
- − Mortgage interest
- −$3,635
- − Property taxes
- −$904
- − Insurance
- −$324
- − Repairs & maintenance
- −$1,029
- − Management
- −$1,029
- − Depreciation
- −$1,888
- Taxable income
- $4,054
- Est. tax owed @ 24.0%
- −$973
- After-tax cash flow
- $3,877/yr
For passive investors: Depreciation is non-cash, so a rental often shows a tax loss while cash-flowing — sheltering income. Rental losses are passive: they offset passive income freely, and up to $25,000/yr can offset ordinary (W-2) income if you actively participate and your MAGI is under $100k (phasing out to $0 by $150k); unused losses carry forward. On sale, claimed depreciation is recaptured at up to 25%, and gains may owe capital-gains tax (a 1031 exchange can defer both). Figures are a year-1 estimate at your 24.0% rate — not tax advice; consult a CPA.
Schools (NCES district)
- District
- Independence Community School District
- NCES district ID
- 1914580
- Math proficiency
- 73% ▼ -3.00%
- Reading proficiency
- 74% ▲ 4.00%
- Median HH income
- $54,269
- Composite
- 62.68/100
- National rank
- #674
- State rank
- #86 of 289 in IA
Livability — Independence
- Score
- 76/100
- State rank
- #198
- US rank
- #3628
Category grades
Schools grade is shown separately in the Schools card above.
Census & demographics
- Census place
- Independence, IA
- City population
- 8,475
- Population (ZIP)
- 8,475
Population outlook (Buchanan County) Hauer SSP2
- Today (2025)
- 20,892 people
- By 2030
- 20,578 · -1.5%
- By 2040
- 19,906 · -4.7%
- By 2050
- 19,024 · -8.9%
- By 2075
- 16,289 · -22.0%
- By 2100
- 12,561 · -39.9%
Race, ethnicity, and origin ACS 2023
- Neighborhood character
- Predominantly White (95%)
- Race & ethnicity
- White 95% Hispanic / Latino 2% Two or more races 2% Black 1%
- Common ancestry
- Portuguese 5% Iranian 4% Slovak 3%
- Foreign-born
- 2% · Canada
- Languages at home
- 98% English-only · Spanish 1% German/W. Germanic 1%
Political lean MEDSL · Buchanan
- 2024 margin
- Strong R (+28.2) · D 35.1% · R 63.4% · Other 1.5%
- 2008→2024 swing
- -46.7pp toward R · 2008: 18.5pp · 2024: -28.2pp
- All cycles
- 2024: R+28.2 2020: R+20.9 2016: R+15.2 2012: D+13.9 2008: D+18.5
Not yet ingested
- Civics
- —
Market trends
- HPI YoY
- ▼ -61.31%
- Current HPI
- 190.6265
- Rent YoY
- —
- Metro
- —
- State GDP YoY
- ▲ 2.48%
- F500 in state
- 4
Industry mix (Fortune 500 HQ in IA)
| Industry | F500 HQs | Revenue |
|---|---|---|
| Financial Services | 1 | $16B |
|
||
| Retail / Convenience | 1 | $15B |
|
||
Price history
+36.6% since first listed5 events — show timeline
- 2026-04-29 Price Changed $64,900 NEIRBR as distributed by MLS GRID
- 2026-03-23 Price Changed $69,900 NEIRBR as distributed by MLS GRID
- 2025-09-24 Listed $74,500 NEIRBR as distributed by MLS GRID
- 2020-12-15 Sold (MLS) $38,500 NEIRBR as distributed by MLS GRID
- 2020-11-09 Listed $47,500 NEIRBR as distributed by MLS GRID
Property tax history
+1.2%/yrLatest (2025): $904 · +3.0% YoY. Source: county tax records.
Cash-flow waterfall
monthlySold comps — $/sqft
last 12 mo · ≤1 miLoading sold comps…