42 Pierce Rd · Mashantucket, CT
Flood risk No data
- FEMA flood zone
- —
- Chance of flooding over 30 yrs
- —
- Est. flood insurance / yr
- —
Fire risk No data
- Est. fire insurance / yr
- —
Heat risk No data
- Hot days now (above threshold)
- —
- Hot days in 30 yrs
- —
Wind risk No data
- Chance of severe wind over 30 yrs
- —
Air-quality risk No data
- Unhealthy air days now
- —
- Unhealthy air days in 30 yrs
- —
Risk factors via First Street. Map © Google.
Why this score? — see what drove the B grade
The composite is a weighted blend of 9 inputs, each scored 0–100. Each bar is that input's sub-score; the figure is the points it added to the 100-point composite (weight × sub-score).
- Cash flow +30.0/30.0
- 1% rule +10.0/10.0
- DSCR +10.0/10.0
- ARV discount +7.5/15.0
- Schools +4.1/10.0
- Livability +3.6/5.0
- Rent growth +2.5/5.0
- Condition / age +2.5/5.0
- Appreciation +0.0/10.0
$105,000
🖨 Deal sheet 📄 Offer letter ✓ Due diligence
Listing remarks
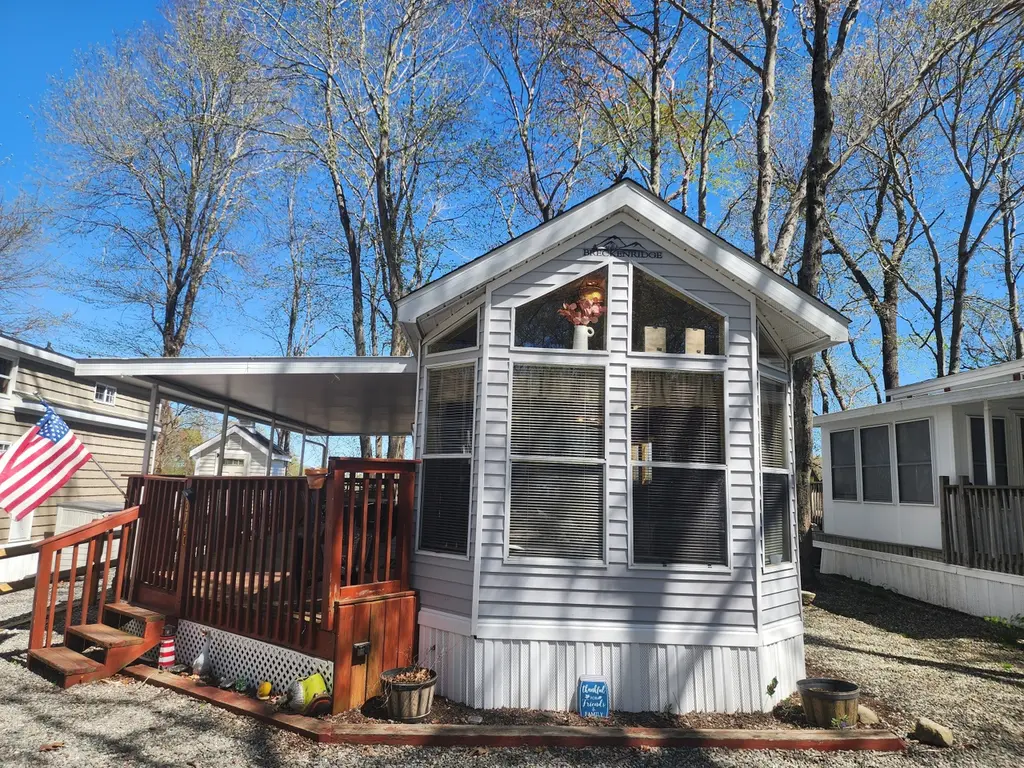
Just come and relax in your own place at Strawberry Park, it has a lot to offer you, gated resort, with lots of amenities like pools, playgrounds, pickleball, dog park, So pet friendly. Sit and enjoy the quietness of the park, in the back where the home is located, your view is the field next door, so watch the deer go by, home is a Breckenridge, has a covered deck to relax under on warm days with tv, vaulted ceilings, sleeps 8 people. All furnished all you have to do is move in. Parking for 2-3 vehicles. Home is tied into shared septic. Close to Foxwoods Casino, Mohegan Casino, shopping and more. Come and View today.
Key facts
- Dog park
- Covered deck
- Playgrounds
Tags
Property features AI
Finance
- Other: Located in New London County, Connecticut; Nearby amenities: park, playground/tot lot, shopping/mall; GPS-friendly directions
- Financial info: Professional on-site property management
- HOA & community: Homeowners association with quarterly fee; HOA services include clubhouse, front desk receptionist, grounds maintenance, snow removal, water, property management, pool service, and road maintenance; Community amenities include clubhouse, park, playground/tot lot, pool, and tennis courts
Exterior
- Utilities: Private or shared well water; Septic sewage; Propane fuel with above-ground tank
- Home design: Single-family home; Located in a gated planned unit development
- Construction: Vinyl siding; Grey exterior; Asphalt shingle roof; Other construction description; No foundation specified
- Exterior features: Rear, level, open lot; In-ground swimming pool
Interior
- Kitchen: Gas cooktop; Refrigerator
- Bedrooms: 1 bedroom
- Bathrooms: 1 full bathroom
- Heating & cooling: Gravity warm air heat (propane fuel); Window unit cooling; Propane hot water
- Interior features: Total of 3 rooms; No basement
Neighborhood map
What this means for you Summary
Snapshot
- This is a 1-bed/1.0-bath single-family listed at $105k.
Deal economics
- At list price, monthly cash flow is $623 ($7k/yr) — positive.
- The deal already cash-flows at list — no discount required.
- Meets the 1% rule at list price ($2k rent vs $105k).
- Recommended offer: $99k (6.0% below list) — sets the bar for market timing.
- Cap rate 13.4% vs local median 3.6% in Mashantucket — top-decile yield for the area; either an underpriced asset or a hidden risk that comps aren't pricing in. Stress-test before assuming the spread holds.
Location & tenants
- Location reads 71/100 on livability (#89 in CT) — a middle-class / working-renter tenant base. Strengths: employment A+, housing A+, health & safety A+; Watch: schools D, amenities F, commute F.
- Preston School District (rural): math 42% / reading 49% proficiency, ranked #88 of 153 in CT (top 58%) — families likely to look elsewhere, expect single-tenant / working-renter base with shorter leases; only 14% free/reduced lunch — higher-income household profile.
- Market conditions: 23 active listings in the ZIP; 487 units permitted in Southeastern Connecticut Planning Region in 2024 (244 in 5+ unit buildings).
Forward outlook
- Local home prices are declining (-3.0%/yr); year-one equity from $726 of loan paydown is wiped out by about $3k of value loss. Plan a longer hold.
- At projected returns (-3.0% appreciation + 3.0% rent growth), your $29k cash investment doubles in ~5 years — after that, you're playing with house money.
Negotiation context
- It's been on market 80 days — a 6% lower offer ($99k) is reasonable based on typical stale-listing flexibility.
- 35 sale attempts since 23y ago with the ask held roughly flat each time — persistent listings suggest the price (not the market) is what's stuck; bring a comps-based counter.
- Current owner paid $40k; list at $105k implies a 162% gain — meaningful room to come down on a strong offer.
Questions for the listing agent
- It's been on market 80 days. Have you received any prior offers? Is the seller open to a 6% concession, seller financing, or rate buy-down credit?
- What does the HOA fee cover, when was the last increase, and are there any pending special assessments or reserve-fund shortfalls?
- Why hasn't it sold? Are there any deal-killer items the seller is aware of (foundation, flood, title, zoning, code violations)?
- Is there a deadline driving the sale (1031 exchange, divorce, estate, relocation)? That informs how much negotiation room exists.
- Schools are D-rated, which usually means shorter tenancies and higher turnover. Who's the typical renter profile here, and what's been the actual vacancy rate?
- What's the average days-on-market for RENTAL listings here right now (not sales)? A rising rental-DOM trend means longer vacancies and softer asking-rent achievability than the comps imply.
- What's the recent tenant-quality profile in this submarket — average credit score on applications, eviction rate, late-payment / NSF rate, and stable-employment percentage? A property-management company in the area should have these aggregated.
- How much new for-sale + rental construction is in the pipeline within 1–3 miles? Heavy new supply typically softens prices + rents 12–24 months out; constrained supply supports both.
Investment metrics
- 1% rule
- 1.87% ✓
- Cap rate
- 13.41%
- Cash-on-cash
- 25.41%
- DSCR
- 2.13
- GRM
- 4.5
CMA / ARV
No comps found within radius.
Projected returns pro-forma
-3.0% appreciation · 3.0% rent growth · sell at horizon
- IRR
- 19.1%
- Equity multiple
- 1.78×
- Total profit
- $22,788
- Equity at exit
- $15,656
- IRR
- 27.5%
- Equity multiple
- 3.43×
- Total profit
- $71,518
- Equity at exit
- $9,078
Cash invested: $29,400 (down + closing). Projections, not guarantees.
Landlord ↔ Tenant lean methodology
- Overall (STATE)
- 27 Tenant-Leaning
- State Connecticut
- 27 Tenant-Leaning · D+7
- County
- — inherits STATE
- City
- — inherits STATE
ZIP-level market 06365
- Home prices YoY
- -14.0%
- Active inventory
- 23
- Price-to-rent
- 4.5×
Monthly cashflow live
- Estimated rent
- $1,960 medium interval (Pro) →
- Mortgage (P&I)
- −$551
- Tax est. 1.5%
- −$131 /mo · $1,575/yr
- Insurance
- −$44
- HOA
- −$200
- Vacancy / Maint / Mgmt
- −$412
- Net cashflow
- $623
Break-even live
UW: 25.0% down · 7.5% · 30yr · 1.5% tax · 5.0% vac · 8.0% maint · 8.0% mgmt
Financing live
Cash to close
- Down payment
- $26,250
- Closing costs
- $3,150
- Reserves months
- —
- Total cash needed
- —
Loan-product check · same deal, 3 products live
Conventional
25% down · 7.5% · 30yr
- Down + closing
- —
- Monthly P&I
- —
- Monthly cashflow
- —
- DSCR
- —
- Eligible?
- —
Personal DTI + credit; lowest rate.
DSCR
20% down · 8.5% · 30yr
- Down + closing
- —
- Monthly P&I
- —
- Monthly cashflow
- —
- DSCR
- —
- Eligible?
- —
No personal income docs; deal must DSCR.
Hard money
10% down · 12.0% · 12mo
- Down + closing
- —
- Monthly P&I
- —
- Monthly cashflow
- —
- DSCR
- —
- Eligible?
- —
Short-term bridge; refi at stabilization.
HOA detail
- Monthly dues
- $200 · $2,400/yr
- Likely covers
- landscapingpoolsecurity
Listing history 50 events
-
2026-06-19days on market $105,000 Active 80 DOM
-
2026-06-18days on market $105,000 Active 79 DOM
-
2026-06-17days on market $105,000 Active 78 DOM
-
2026-06-16days on market $105,000 Active 77 DOM
-
2026-06-15days on market $105,000 Active 76 DOM
-
2026-06-14days on market $105,000 Active 74 DOM
-
2026-06-13days on market $105,000 Active 73 DOM
-
2026-06-10days on market $105,000 Active 71 DOM
-
2026-06-09days on market $105,000 Active 70 DOM
-
2026-06-08days on market $105,000 Active 69 DOM
-
2026-06-07days on market $105,000 Active 68 DOM
-
2026-06-05days on market $105,000 Active 65 DOM
-
2026-06-02days on market $105,000 Active 63 DOM
-
2026-06-01days on market $105,000 Active 62 DOM
-
2026-05-31days on market $105,000 Active 61 DOM
-
2026-05-30days on market $105,000 Active 60 DOM
-
2026-03-31$105,000 Active
-
2025-10-31historical
-
2025-06-26price $99,900
-
2025-04-30$105,000 Active
-
2017-09-30historical
-
2017-09-30historical
-
2016-05-09$32,000
-
2016-05-09$32,000
-
2015-12-31historical
-
2015-12-31historical
-
2015-12-31historical
-
2015-12-31historical
-
2015-11-20soldstatus $40,000 Sold
-
2015-11-20soldstatus $40,000
-
2015-10-01historical
-
2015-09-16historical
-
2015-09-15soldstatus $29,000
-
2015-08-27historical
-
2015-08-26status Pending
-
2015-08-25historical
-
2015-08-12price $50,000
-
2015-06-17$74,900
-
2015-06-07$75,000 Active - New
-
2015-06-03$50,000
-
2015-05-27$94,000
-
2015-05-01historical
-
2015-03-08historical
-
2015-02-16$35,000
-
2014-12-31historical
-
2014-12-31historical
-
2014-12-30historical
-
2014-10-07$44,900
-
2014-10-07$44,900
-
2014-10-01historical
ⓘ Source: listings_history table (triggers on properties + properties_extension) + one-shot
backfill from property_details.listing_events for pre-trigger history.
Nearby sold comps map
Loading sold comps map…
Walkable amenities ~0.75 mi
Loading nearby amenities…
Taxation est. · year 1
- Rental income
- $23,517
- − Mortgage interest
- −$5,882
- − Property taxes
- −$1,575
- − Insurance
- −$525
- − Repairs & maintenance
- −$1,881
- − Management
- −$1,881
- − HOA
- −$2,400
- − Depreciation
- −$3,055
- Taxable income
- $6,318
- Est. tax owed @ 24.0%
- −$1,516
- After-tax cash flow
- $5,954/yr
For passive investors: Depreciation is non-cash, so a rental often shows a tax loss while cash-flowing — sheltering income. Rental losses are passive: they offset passive income freely, and up to $25,000/yr can offset ordinary (W-2) income if you actively participate and your MAGI is under $100k (phasing out to $0 by $150k); unused losses carry forward. On sale, claimed depreciation is recaptured at up to 25%, and gains may owe capital-gains tax (a 1031 exchange can defer both). Figures are a year-1 estimate at your 24.0% rate — not tax advice; consult a CPA.
Schools (NCES district)
- District
- Preston School District
- NCES district ID
- 0903420
- Math proficiency
- 42% ▼ -9.00%
- Reading proficiency
- 49% ▼ -13.00%
- Median HH income
- $71,322
- Composite
- 41.07/100
- National rank
- #3575
- State rank
- #88 of 153 in CT
Livability — Mashantucket
- Score
- 71/100
- State rank
- #89
- US rank
- #6996
Category grades
Schools grade is shown separately in the Schools card above.
Census & demographics
- City population
- 62
- Population (ZIP)
- 4,781
Population outlook (Southeastern Connecticut County) Hauer SSP2
- By 2040
- 293,442
Race, ethnicity, and origin ACS 2023
- Neighborhood character
- Predominantly White (93%)
- Race & ethnicity
- White 93% Hispanic / Latino 3% Two or more races 2% Asian 1% Black 1%
- Common ancestry
- Lithuanian 14% Romanian 14% Slovak 2%
- Foreign-born
- 3% · Canada, Dominican Republic
- Languages at home
- 96% English-only · Spanish 2% Tagalog/Filipino 1%
Political lean MEDSL · Southeastern Connecticut
- 2024 margin
- D (+13.0) · D 55.6% · R 42.6% · Other 1.8%
- All cycles
- 2024: D+13.0
Not yet ingested
- Civics
- —
Market trends
- HPI YoY
- ▼ -31.95%
- Current HPI
- 195.6282
- Rent YoY
- —
- Metro
- —
- State GDP YoY
- ▲ 1.06%
- F500 in state
- 38
Industry mix (Fortune 500 HQ in CT)
| Industry | F500 HQs | Revenue |
|---|---|---|
| Industrial Machinery | 4 | $38B |
|
||
| Insurance | 3 | $71B |
|
||
| Financial Services | 2 | $25B |
|
||
| Transportation / Logistics | 2 | $18B |
|
||
| Healthcare | 1 | $247B |
|
||
| Telecommunications | 1 | $55B |
|
||
Price history
+200.9% since first listed73 events — show timeline
- 2026-03-31 Listed $105,000 Smart MLS
- 2025-10-31 Listing Removed — Smart MLS
- 2025-06-26 Price Changed $99,900 Smart MLS
- 2025-04-30 Listed $105,000 Smart MLS
- 2017-09-30 Listing Removed — Smart MLS
- 2017-09-30 Listing Removed — Smart MLS
- 2016-05-09 Listed $32,000 Smart MLS
- 2016-05-09 Listed $32,000 Smart MLS
- 2015-12-31 Listing Removed — Smart MLS
- 2015-12-31 Listing Removed — Smart MLS
- 2015-12-31 Listing Removed — Smart MLS
- 2015-12-31 Listing Removed — Smart MLS
- 2015-11-20 Sold (MLS) $40,000 Smart MLS
- 2015-11-20 Sold (MLS) $40,000 RIS
- 2015-10-01 Listing Removed — Smart MLS
- 2015-09-16 Listing Removed — Smart MLS
- 2015-09-15 Sold (MLS) $29,000 Smart MLS
- 2015-08-27 Listing Removed — Smart MLS
- 2015-08-26 Pending — RIS
- 2015-08-25 Listing Removed — Smart MLS
- 2015-08-12 Price Changed $50,000 RIS
- 2015-06-17 Listed $74,900 Smart MLS
- 2015-06-07 Listed $75,000 RIS
- 2015-06-03 Listed $50,000 Smart MLS
- 2015-05-27 Listed $94,000 Smart MLS
- 2015-05-01 Listing Removed — Smart MLS
- 2015-03-08 Listing Removed — Smart MLS
- 2015-02-16 Listed $35,000 Smart MLS
- 2014-12-31 Listing Removed — Smart MLS
- 2014-12-31 Listing Removed — Smart MLS
- 2014-12-30 Listing Removed — Smart MLS
- 2014-10-07 Listed $44,900 Smart MLS
- 2014-10-07 Listed $44,900 Smart MLS
- 2014-10-01 Listing Removed — Smart MLS
- 2014-10-01 Listing Removed — Smart MLS
- 2014-09-11 Listed $109,000 Smart MLS
- 2014-09-09 Listed $115,000 Smart MLS
- 2014-08-29 Sold (MLS) $72,500 Smart MLS
- 2014-08-26 Listed $73,000 Smart MLS
- 2014-08-08 Listed $34,900 Smart MLS
- 2014-07-24 Listed $75,000 Smart MLS
- 2014-07-24 Listed $75,000 Smart MLS
- 2014-07-08 Listed $54,900 Smart MLS
- 2014-07-08 Listed $54,900 Smart MLS
- 2014-07-08 Listed $44,900 Smart MLS
- 2014-07-07 Listing Removed — Smart MLS
- 2014-07-07 Listing Removed — Smart MLS
- 2014-07-07 Listing Removed — Smart MLS
- 2014-01-31 Sold (MLS) $50,000 Smart MLS
- 2013-11-05 Sold (MLS) $50,000 Smart MLS
- 2013-09-30 Listing Removed — Smart MLS
- 2013-08-21 Listed $65,000 Smart MLS
- 2013-08-21 Listed $65,000 Smart MLS
- 2013-08-21 Listed $65,000 Smart MLS
- 2013-08-21 Listed $65,000 Smart MLS
- 2013-08-21 Listed $65,000 Smart MLS
- 2013-08-09 Sold (MLS) $50,000 Smart MLS
- 2013-06-30 Listing Removed — Smart MLS
- 2013-05-03 Sold (MLS) $62,000 Smart MLS
- 2013-03-11 Listed $28,500 Smart MLS
- 2012-11-30 Listing Removed — Smart MLS
- 2012-10-25 Listed $85,000 Smart MLS
- 2012-05-16 Listed $79,900 Smart MLS
- 2012-05-05 Listed $60,000 Smart MLS
- 2011-09-19 Listed $65,000 Smart MLS
- 2011-09-19 Listed $49,000 Smart MLS
- 2008-11-20 Listing Removed — Smart MLS
- 2008-10-06 Listed $68,000 Smart MLS
- 2007-11-20 Listed $120,000 Smart MLS
- 2007-10-31 Listing Removed — RIS
- 2007-02-02 Listed $189,900 RIS
- 2004-03-28 Listing Removed — Smart MLS
- 2003-12-28 Listed $34,900 Smart MLS
Cash-flow waterfall
monthlySold comps — $/sqft
last 12 mo · ≤1 miLoading sold comps…