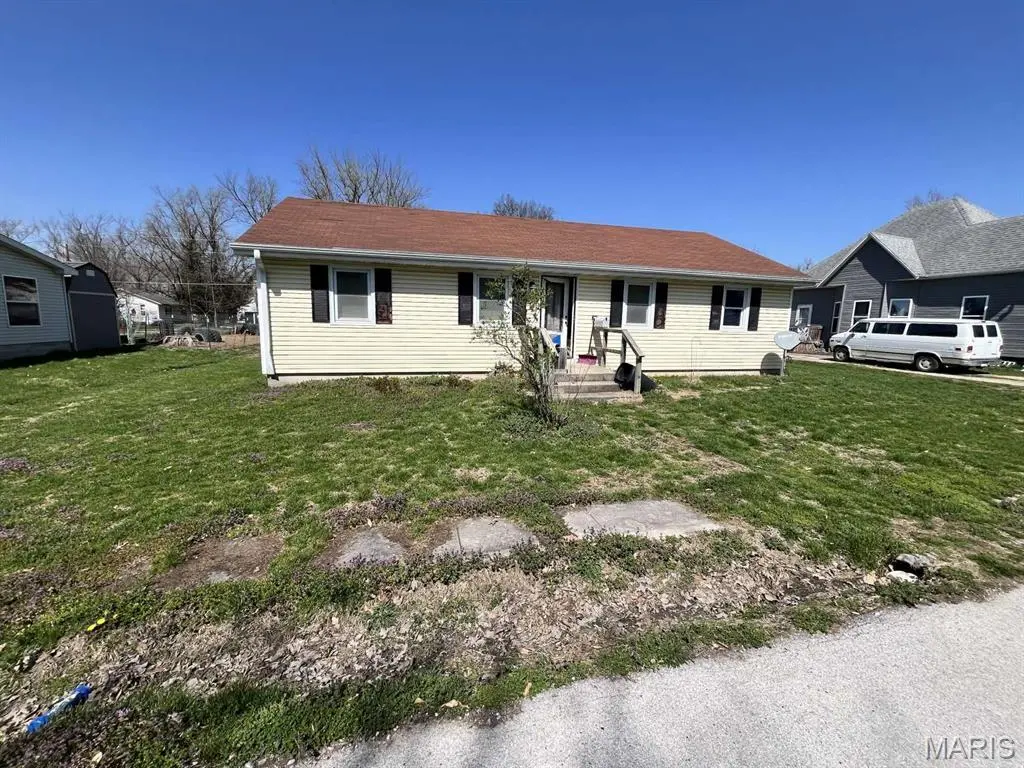
210 Dean St · Shelbina, MO
Flood risk 1/10 · Minimal
- FEMA flood zone
- X (unshaded)
- Chance of flooding over 30 yrs
- 0.0%
- Est. flood insurance / yr
- $507 – $1,088
Fire risk 3/10 · Minor
- Est. fire insurance / yr
- $1,054 – $1,958
Heat risk 3/10 · Minor
- Hot days now (above 106°F)
- 7 days/yr
- Hot days in 30 yrs
- 17 days/yr
Wind risk 2/10 · Minimal
- Chance of severe wind over 30 yrs
- —
Air-quality risk 2/10 · Minimal
- Unhealthy air days now
- 1 days/yr
- Unhealthy air days in 30 yrs
- 1 days/yr
Risk factors via First Street. Map © Google.
Why this score? — see what drove the A- grade
The composite is a weighted blend of 9 inputs, each scored 0–100. Each bar is that input's sub-score; the figure is the points it added to the 100-point composite (weight × sub-score).
- Cash flow +30.0/30.0
- ARV discount +15.0/15.0
- 1% rule +10.0/10.0
- DSCR +10.0/10.0
- Appreciation +8.2/10.0
- Livability +3.4/5.0
- Schools +2.9/10.0
- Rent growth +2.5/5.0
- Condition / age +2.5/5.0
$55,000
🖨 Deal sheet 📄 Offer letter ✓ Due diligence
Listing remarks
Opportunity in Shelbina — 210 Dean St offers an affordable value-add property in a quiet rural market with room to improve and build equity. This home sits in town and could make a solid rental, flip, or owner-occupant project for the right buyer. The property will need cleanup and updating, but the price point leaves room for an investor or handy buyer to come in, renovate, and reposition it. Seller-provided photos show the home needs work, and buyers should verify condition, square footage, layout, basement status, and all major systems. Located in a small-town setting with nearby local amenities, this is a practical project for someone looking for an entry-level investment or affor
Key facts
- 9,496 sq ft lot
- Garage
- Built 1976
Property features AI
Finance
- Other: Home warranty: No
- Financial info: No investor or income/expense details provided
- HOA & community: No HOA details provided
Exterior
- Parking: One-car garage
- Security: No security details provided
- Utilities: Public water; Public sewer; Electric service listed as 'Other'
- Home design: Single-family residence; One level
- Construction: Construction materials: Other; Above-grade finished area listed as 1,288 (source: public records); Year built: public records source (year not specified)
- Exterior features: Lot features listed as 'Other'; Lot size approximately 0.218 acres
Interior
- Kitchen: No appliance details provided
- Bedrooms: Three bedrooms on the main level
- Flooring: No flooring details provided
- Bathrooms: One full bathroom on the main level
- Heating & cooling: Forced air heating with natural gas; Central air conditioning (electric)
- Interior features: Six total rooms
- Laundry & utility: No laundry or utility room details provided
Neighborhood map
What this means for you Summary
Snapshot
- This is a 3-bed/1.0-bath other listed at $55k.
Deal economics
- At list price, monthly cash flow is $518 ($6k/yr) — positive.
- The deal already cash-flows at list — no discount required.
- Meets the 1% rule at list price ($1k rent vs $55k).
- Recommended offer: $53k (3.0% below list) — sets the bar for market timing.
Location & tenants
- Location reads 68/100 on livability (#188 in MO) — a middle-class / working-renter tenant base. Strengths: cost of living A+, housing A; Watch: employment D, amenities F, commute F.
- Shelby County R-IV (rural): math 29% / reading 42% proficiency, ranked #224 of 324 in MO (top 69%) — families likely to look elsewhere, expect single-tenant / working-renter base with shorter leases.
- Zoned schools: South Shelby High (math 12% / reading 42%, grade F, #420 of 521 statewide, top 82%, 248 students, 48% FRL) — zoned schools at 48% FRL track the district average.
- Market conditions: 11 active listings in the ZIP; 4 units permitted in Shelby County in 2024 (0 in 5+ unit buildings).
Forward outlook
- In year one you build about $4k of equity ($380 loan paydown + $4k appreciation (6.4% local appreciation)).
- Shelby County population projected at -26% by 2050 — secular population decline; favor cash flow + early exit over multi-decade hold.
- At projected returns (6.4% appreciation + 3.0% rent growth), your $15k cash investment doubles in ~2 years — after that, you're playing with house money.
- By year 8, paydown + projected appreciation supports a ~$31k cash-out refi (75% LTV) — recoverable capital for the next deal without selling this one.
Negotiation context
- It's been on market 50 days — a 3% lower offer ($53k) is reasonable based on typical stale-listing flexibility.
Questions for the listing agent
- It's been on market 50 days. Have you received any prior offers? Is the seller open to a 3% concession, seller financing, or rate buy-down credit?
- Built in 1976 — when were the roof, HVAC, electrical panel, plumbing, and water heater last replaced?
- Is there a deadline driving the sale (1031 exchange, divorce, estate, relocation)? That informs how much negotiation room exists.
- What's the average days-on-market for RENTAL listings here right now (not sales)? A rising rental-DOM trend means longer vacancies and softer asking-rent achievability than the comps imply.
- What's the recent tenant-quality profile in this submarket — average credit score on applications, eviction rate, late-payment / NSF rate, and stable-employment percentage? A property-management company in the area should have these aggregated.
- How much new for-sale + rental construction is in the pipeline within 1–3 miles? Heavy new supply typically softens prices + rents 12–24 months out; constrained supply supports both.
Investment metrics
- 1% rule
- 2.03% ✓
- Cap rate
- 17.60%
- Cash-on-cash
- 40.39%
- DSCR
- 2.80
- GRM
- 4.1
CMA / ARV
- ARV (median comp)
- $100,840
- List price
- $55,000
- Delta
- -45.46%
- Verdict
- UNDERPRICED
- Comps
- 20 within 1.0 mi
Projected returns pro-forma
6.42% appreciation · 3.0% rent growth · sell at horizon
- IRR
- 50.7%
- Equity multiple
- 4.27×
- Total profit
- $50,289
- Equity at exit
- $36,054
- IRR
- 47.2%
- Equity multiple
- 8.91×
- Total profit
- $121,755
- Equity at exit
- $66,698
Cash invested: $15,400 (down + closing). Projections, not guarantees.
Landlord ↔ Tenant lean methodology
- Overall (STATE)
- 81 Strongly Landlord-Friendly
- State Missouri
- 81 Strongly Landlord-Friendly · R+10
- County
- — inherits STATE
- City
- — inherits STATE
ZIP-level market 63468
- Home prices YoY
- 3.0%
- Active inventory
- 11
- Price-to-rent
- 4.1×
Monthly cashflow live
- Estimated rent
- $1,117 medium interval (Pro) →
- Mortgage (P&I)
- −$288
- Tax from tax record
- −$52 /mo · $630/yr
- Insurance
- −$23
- HOA
- −$0
- Vacancy / Maint / Mgmt
- −$234
- Net cashflow
- $518
Break-even live
UW: 25.0% down · 7.5% · 30yr · 1.5% tax · 5.0% vac · 8.0% maint · 8.0% mgmt
Financing live
Cash to close
- Down payment
- $13,750
- Closing costs
- $1,650
- Reserves months
- —
- Total cash needed
- —
Loan-product check · same deal, 3 products live
Conventional
25% down · 7.5% · 30yr
- Down + closing
- —
- Monthly P&I
- —
- Monthly cashflow
- —
- DSCR
- —
- Eligible?
- —
Personal DTI + credit; lowest rate.
DSCR
20% down · 8.5% · 30yr
- Down + closing
- —
- Monthly P&I
- —
- Monthly cashflow
- —
- DSCR
- —
- Eligible?
- —
No personal income docs; deal must DSCR.
Hard money
10% down · 12.0% · 12mo
- Down + closing
- —
- Monthly P&I
- —
- Monthly cashflow
- —
- DSCR
- —
- Eligible?
- —
Short-term bridge; refi at stabilization.
Listing history 15 events
-
2026-06-18days on market $55,000 Active 50 DOM
-
2026-06-17days on market $55,000 Active 49 DOM
-
2026-06-16days on market $55,000 Active 48 DOM
-
2026-06-15days on market $55,000 Active 47 DOM
-
2026-06-13days on market $55,000 Active 45 DOM
-
2026-06-12days on market $55,000 Active 44 DOM
-
2026-06-09days on market $55,000 Active 41 DOM
-
2026-06-08days on market $55,000 Active 40 DOM
-
2026-06-07days on market $55,000 Active 39 DOM
-
2026-06-05days on market $55,000 Active 37 DOM
-
2026-06-04days on market $55,000 Active 35 DOM
-
2026-06-02days on market $55,000 Active 34 DOM
-
2026-06-01days on market $55,000 Active 33 DOM
-
2026-05-31days on market $55,000 Active 32 DOM
-
2026-04-29$55,000 Active 823-char remark
ⓘ Source: listings_history table (triggers on properties + properties_extension) + one-shot
backfill from property_details.listing_events for pre-trigger history.
Tax reassessment forecast MO · Resets to sale price
- Current annual tax
- $630 · $52/mo
- Projected year-2 tax
- $630 · $52/mo
- Expected delta
- $0/yr ($0/mo · 0.0%)
ⓘ Screening estimate from a state-policy table — verify with the county assessor before closing.
Climate risk First Street
- Flood 1/10 Low FEMA zone X (unshaded) · 0% chance over 30 yrs
- Wildfire 3/10 Moderate
- Heat 3/10 Moderate 7 d/yr ≥106°F today · 17 d/yr by 30 yrs out
- Wind 2/10 Low
- Air quality 2/10 Low 1 unhealthy d/yr today · 1 by 30 yrs out
Nearby sold comps map
Loading sold comps map…
Walkable amenities ~0.75 mi
Loading nearby amenities…
Taxation est. · year 1
- Rental income
- $13,400
- − Mortgage interest
- −$3,081
- − Property taxes
- −$630
- − Insurance
- −$275
- − Repairs & maintenance
- −$1,072
- − Management
- −$1,072
- − Depreciation
- −$1,600
- Taxable income
- $5,670
- Est. tax owed @ 24.0%
- −$1,361
- After-tax cash flow
- $4,859/yr
For passive investors: Depreciation is non-cash, so a rental often shows a tax loss while cash-flowing — sheltering income. Rental losses are passive: they offset passive income freely, and up to $25,000/yr can offset ordinary (W-2) income if you actively participate and your MAGI is under $100k (phasing out to $0 by $150k); unused losses carry forward. On sale, claimed depreciation is recaptured at up to 25%, and gains may owe capital-gains tax (a 1031 exchange can defer both). Figures are a year-1 estimate at your 24.0% rate — not tax advice; consult a CPA.
Schools (NCES district)
- District
- Shelby County R-IV
- NCES district ID
- 2928110
- Math proficiency
- 29% ▼ -10.00%
- Reading proficiency
- 42% ▼ -3.00%
- Median HH income
- $36,627
- Composite
- 29.44/100
- National rank
- #6517
- State rank
- #224 of 324 in MO
Livability — Shelbina
- Score
- 68/100
- State rank
- #188
- US rank
- #9918
Category grades
Schools grade is shown separately in the Schools card above.
Census & demographics
- Census place
- Shelbina, MO
- Population (ZIP)
- 2,523
Population outlook (Shelby County) Hauer SSP2
- Today (2025)
- 5,663 people
- By 2030
- 5,352 · -5.5%
- By 2040
- 4,762 · -15.9%
- By 2050
- 4,200 · -25.8%
- By 2075
- 3,058 · -46.0%
- By 2100
- 2,166 · -61.8%
Race, ethnicity, and origin ACS 2023
- Neighborhood character
- Predominantly White (96%)
- Race & ethnicity
- White 96% Two or more races 2% Hispanic / Latino 2%
- Common ancestry
- Lithuanian 5% Slovak 1% Serbian 1%
- Foreign-born
- 1% · Canada
- Languages at home
- 98% English-only · Spanish 1% Other Indo-European 1%
Political lean MEDSL · Shelby
- 2024 margin
- Solid R (+65.6) · D 16.9% · R 82.5%
- 2008→2024 swing
- -33.9pp toward R · 2008: -31.7pp · 2024: -65.6pp
- All cycles
- 2024: R+65.6 2020: R+62.9 2016: R+59.0 2012: R+37.8 2008: R+31.7
Not yet ingested
- Civics
- —
Market trends
- HPI YoY
- ▲ 6.42%
- Current HPI
- 216.9275
- Rent YoY
- —
- Metro
- —
- State GDP YoY
- ▲ 1.84%
- F500 in state
- 20
Industry mix (Fortune 500 HQ in MO)
| Industry | F500 HQs | Revenue |
|---|---|---|
| Healthcare | 1 | $163B |
|
||
| Insurance | 1 | $21B |
|
||
| Industrial Technology | 1 | $17B |
|
||
| Retail | 1 | $16B |
|
||
| Industrial Distribution | 1 | $10B |
|
||
| Utilities | 1 | $9B |
|
||
Price history
1 event — show timeline
- 2026-04-29 Listed $55,000 MARIS as Distributed by MLS Grid
Property tax history
+1.2%/yrLatest (2025): $630 · +6.8% YoY. Source: county tax records.
Cash-flow waterfall
monthlySold comps — $/sqft
last 12 mo · ≤1 miLoading sold comps…