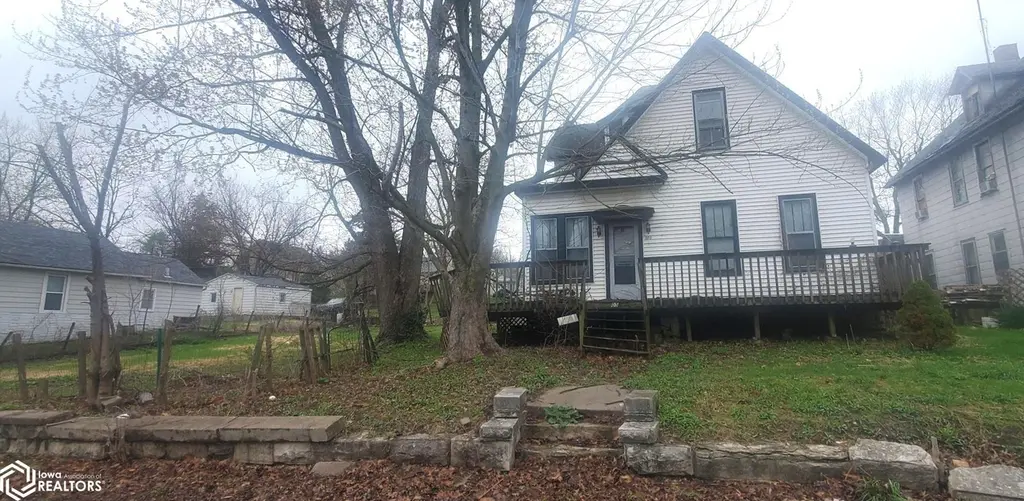
505 S Marshall St · Burlington, IA
Flood risk 1/10 · Minimal
- FEMA flood zone
- X (unshaded)
- Chance of flooding over 30 yrs
- 0.0%
- Est. flood insurance / yr
- $473 – $860
Fire risk 1/10 · Minimal
- Est. fire insurance / yr
- $902 – $1,676
Heat risk 3/10 · Minor
- Hot days now (above 106°F)
- 7 days/yr
- Hot days in 30 yrs
- 16 days/yr
Wind risk 2/10 · Minimal
- Chance of severe wind over 30 yrs
- —
Air-quality risk 2/10 · Minimal
- Unhealthy air days now
- 0 days/yr
- Unhealthy air days in 30 yrs
- 1 days/yr
Risk factors via First Street. Map © Google.
Why this score? — see what drove the D+ grade
The composite is a weighted blend of 9 inputs, each scored 0–100. Each bar is that input's sub-score; the figure is the points it added to the 100-point composite (weight × sub-score).
- Cash flow +15.0/30.0
- ARV discount +7.5/15.0
- 1% rule +5.0/10.0
- DSCR +5.0/10.0
- Schools +4.0/10.0
- Livability +3.7/5.0
- Rent growth +2.5/5.0
- Condition / age +2.5/5.0
- Appreciation +0.0/10.0
$17,900
🖨 Deal sheet (PDF) 📄 Offer letter ✓ Due diligence
Listing remarks MLS
This 3 bedroom home is an excellent investment opportunity for fix and flip, rental, or make it your own. Clean out, and repairs/ updates are needed, but this is solid, with instant equity and tons of potential. The home offers tons of character with pocket doors and original woodwork, a fenced in bonus lot, and much more. Call today on this excellent project!
Key facts
- 5,663 sq ft lot
- 2 garage spots
- Built 1878
Neighborhood map
What this means for you Summary
Snapshot
- This is a 3-bed/1.0-bath single-family listed at $18k.
Deal economics
- At list price, monthly cash flow is $832 ($10k/yr) — positive.
- The deal already cash-flows at list — no discount required.
- Meets the 1% rule at list price ($1k rent vs $18k).
- Recommended offer: $17k (6.0% below list) — sets the bar for market timing.
- Cap rate 62.0% vs local median 6.0% in Burlington — top-decile yield for the area; either an underpriced asset or a hidden risk that comps aren't pricing in. Stress-test before assuming the spread holds.
Location & tenants
- Location reads 73/100 on livability (#287 in IA) — a middle-class / working-renter tenant base. Strengths: cost of living A+, housing A+, health & safety A+; Watch: crime D+, employment D, amenities F.
- Burlington Community School District (town): math 42% / reading 54% proficiency, ranked #286 of 289 in IA (top 99%) — families likely to look elsewhere, expect single-tenant / working-renter base with shorter leases.
- Zoned schools: Black Hawk Elementary School (math 52% / reading 52%, grade C-, #494 of 616 statewide, top 83%, 316 students, 72% FRL); Edward Stone Middle School (math 34% / reading 48%, grade F, #236 of 246 statewide, top 96%, 489 students, 63% FRL); Burlington Community High School (math 45% / reading 64%, grade C-, #290 of 336 statewide, top 87%, 1,092 students, 58% FRL).
- Market conditions: 188 active listings in the ZIP; 1 comparable units currently listed for rent nearby; 53 units permitted in Des Moines County in 2024 (40 in 5+ unit buildings).
Forward outlook
- Local home prices are declining (-3.0%/yr); year-one equity from $124 of loan paydown is wiped out by about $537 of value loss. Plan a longer hold.
- Des Moines County population projected to shrink 6% by 2050 — rents likely to lag national; underwrite the cash flow, not the appreciation.
- At projected returns (-3.0% appreciation + 3.0% rent growth), your $5k cash investment doubles in ~1 year — after that, you're playing with house money.
Negotiation context
- It's been on market 68 days — a 6% lower offer ($17k) is reasonable based on typical stale-listing flexibility.
Risks & watch-outs
- Watch-outs: built in 1878 — expect roof / HVAC / electrical / plumbing capex.
Questions for the listing agent
- It's been on market 68 days. Have you received any prior offers? Is the seller open to a 6% concession, seller financing, or rate buy-down credit?
- Built in 1878 — when were the roof, HVAC, electrical panel, plumbing, and water heater last replaced?
- Why hasn't it sold? Are there any deal-killer items the seller is aware of (foundation, flood, title, zoning, code violations)?
- Is there a deadline driving the sale (1031 exchange, divorce, estate, relocation)? That informs how much negotiation room exists.
- Crime grade is D in this area — have there been break-ins, vandalism, or insurance claims at this property in the last 3 years? What carrier currently insures it and at what premium?
- The area grade is low — what's the realistic commute time and amenity access for the typical tenant pool here? Any planned neighborhood developments (good or bad) we should know about?
- What's the average days-on-market for RENTAL listings here right now (not sales)? A rising rental-DOM trend means longer vacancies and softer asking-rent achievability than the comps imply.
- What's the recent tenant-quality profile in this submarket — average credit score on applications, eviction rate, late-payment / NSF rate, and stable-employment percentage? A property-management company in the area should have these aggregated.
- How much new for-sale + rental construction is in the pipeline within 1–3 miles? Heavy new supply typically softens prices + rents 12–24 months out; constrained supply supports both.
Investment metrics
- 1% rule
- 6.76% ✓
- Cap rate
- 62.05%
- Cash-on-cash
- 199.13%
- DSCR
- 9.86
- GRM
- 1.2
CMA / ARV
- ARV (median comp)
- $70,851
- List price
- $17,900
- Delta
- -74.74%
- Verdict
- UNDERPRICED
- Comps
- 20 within 1.0 mi
Show comp detail 12 sales within ~0.75 mi
| Address | Dist | Beds/Ba | Sqft | Sold | Price | $/sf | Match |
|---|---|---|---|---|---|---|---|
| 205 S Leebrick St | 0.32mi | 3/2.0 | 1,794 (-2%) | 2mo | $73,000 | $41 | 77 |
| 526 S Central Ave | 0.27mi | 3/1.0 | 1,737 (-5%) | 4mo | $73,500 | $42 | 76 |
| 407 S Gunnison St | 0.10mi | 4/2.0 (+1) | 1,999 (+9%) | 2mo | $159,200 | $80 | 69 |
| 810 S 14th St | 0.50mi | 4/1.0 (+1) | 1,883 (+3%) | 3mo | $15,000 | $8 | 64 |
| 716 S 5th St | 0.68mi | 4/2.0 (+1) | 1,840 (+1%) | 0mo | $84,900 | $46 | 58 |
| 705 S Central Ave | 0.44mi | 3/1.0 | 1,600 (-12%) | 2mo | $99,020 | $62 | 57 |
| 1820 Dill St | 0.55mi | 3/1.0 | 1,622 (-11%) | 1mo | $150,000 | $92 | 55 |
| 1027 S Plane St | 0.62mi | 4/2.5 (+1) | 1,905 (+4%) | 3mo | $245,000 | $129 | 50 |
| 119 S 8th St | 0.44mi | 3/2.5 | 2,082 (+14%) | 5mo | $90,000 | $43 | 46 |
| 1302 S 14 St | 0.75mi | 4/1.0 (+1) | 1,659 (-9%) | 0mo | $15,000 | $9 | 45 |
| 817 Plane St | 0.52mi | 2/2.0 (-1) | 1,588 (-13%) | 4mo | $130,000 | $82 | 42 |
| 513 Elm St | 0.53mi | 4/1.5 (+1) | 2,084 (+14%) | 5mo | $47,000 | $23 | 41 |
Match score weights: distance 35% · size 25% · config 20% · recency 20%. Top-matched comps best support the ARV.
Projected returns pro-forma
-3.0% appreciation · 3.0% rent growth · sell at horizon
- IRR
- —
- Equity multiple
- 10.99×
- Total profit
- $50,090
- Equity at exit
- $2,669
- IRR
- —
- Equity multiple
- 23.33×
- Total profit
- $111,901
- Equity at exit
- $1,548
Cash invested: $5,012 (down + closing). Projections, not guarantees.
Landlord ↔ Tenant lean methodology
- Overall (STATE)
- 83 Strongly Landlord-Friendly
- State Iowa
- 83 Strongly Landlord-Friendly · R+6
- County
- — inherits STATE
- City
- — inherits STATE
ZIP-level market 52601
- Active inventory
- 188
- Price-to-rent
- 1.2×
Monthly cashflow live
- Estimated rent
- $1,209 medium interval (Pro) →
- Mortgage (P&I)
- −$94
- Tax est. 1.5%
- −$22 /mo · $268/yr
- Insurance
- −$7
- HOA
- −$0
- Vacancy / Maint / Mgmt
- −$254
- Net cashflow
- $832
Break-even live
Sensitivity live
| Price | -10% $844 | -5% $838 | +0% $832 | +5% $826 | +10% $819 |
|---|---|---|---|---|---|
| Rent | -10% $736 | -5% $784 | +0% $832 | +5% $879 | +10% $927 |
| Rate | -1.0pp $841 | -0.5pp $836 | base $832 | +0.5pp $827 | +1.0pp $822 |
UW: 25.0% down · 7.5% · 30yr · 1.5% tax · 5.0% vac · 8.0% maint · 8.0% mgmt
Financing live
Cash to close
- Down payment
- $4,475
- Closing costs
- $537
- Reserves months
- —
- Total cash needed
- —
Loan-product check · same deal, 3 products live
Conventional
25% down · 7.5% · 30yr
- Down + closing
- —
- Monthly P&I
- —
- Monthly cashflow
- —
- DSCR
- —
- Eligible?
- —
Personal DTI + credit; lowest rate.
DSCR
20% down · 8.5% · 30yr
- Down + closing
- —
- Monthly P&I
- —
- Monthly cashflow
- —
- DSCR
- —
- Eligible?
- —
No personal income docs; deal must DSCR.
Hard money
10% down · 12.0% · 12mo
- Down + closing
- —
- Monthly P&I
- —
- Monthly cashflow
- —
- DSCR
- —
- Eligible?
- —
Short-term bridge; refi at stabilization.
Rent comps 1 comps
| Address | Beds | Baths | Sqft | Rent | $/sqft | DOM | Units | Dist |
|---|---|---|---|---|---|---|---|---|
| 1601 Division St Burlington, IA | 3.0 | 1.0 | 1440 | $1,100 | $0.76 | 45d | 1 | 0.21mi |
Listing history 20 events
-
2026-06-21days on market $17,900 Active 68 DOM
-
2026-06-19days on market $17,900 Active 66 DOM
-
2026-06-18days on market $17,900 Active 65 DOM
-
2026-06-17days on market $17,900 Active 64 DOM
-
2026-06-16days on market $17,900 Active 63 DOM
-
2026-06-15days on market $17,900 Active 62 DOM
-
2026-06-14days on market $17,900 Active 60 DOM
-
2026-06-12days on market $17,900 Active 59 DOM
-
2026-06-09days on market $17,900 Active 56 DOM
-
2026-06-08days on market $17,900 Active 55 DOM
-
2026-06-07days on market $17,900 Active 54 DOM
-
2026-06-07days on market $17,900 Active 53 DOM
-
2026-06-03days on market $17,900 Active 50 DOM
-
2026-06-02days on market $17,900 Active 49 DOM
-
2026-06-01days on market $17,900 Active 48 DOM
-
2026-05-31days on market $17,900 Active 47 DOM
-
2026-05-30days on market $17,900 Active 46 DOM
-
2026-04-14$17,900 Active 362-char remark
Show marketing remark (362 chars)
This 3 bedroom home is an excellent investment opportunity for fix and flip, rental, or make it your own. Clean out, and repairs/ updates are needed, but this is solid, with instant equity and tons of potential. The home offers tons of character with pocket doors and original woodwork, a fenced in bonus lot, and much more. Call today on this excellent project!
-
2025-02-12soldstatus $17,900
-
2021-10-18soldstatus $32,250
ⓘ Source: listings_history table (triggers on properties + properties_extension) + one-shot
backfill from property_details.listing_events for pre-trigger history.
Climate risk First Street
- Flood 1/10 Low FEMA zone X (unshaded) · 0% chance over 30 yrs
- Wildfire 1/10 Low
- Heat 3/10 Moderate 7 d/yr ≥106°F today · 16 d/yr by 30 yrs out
- Wind 2/10 Low
- Air quality 2/10 Low 0 unhealthy d/yr today · 1 by 30 yrs out
Nearby sold comps map
Loading sold comps map…
Walkable amenities ~0.75 mi
Loading nearby amenities…
Taxation est. · year 1
- Rental income
- $14,513
- − Mortgage interest
- −$1,003
- − Property taxes
- −$268
- − Insurance
- −$90
- − Repairs & maintenance
- −$1,161
- − Management
- −$1,161
- − Depreciation
- −$521
- Taxable income
- $10,309
- Est. tax owed @ 24.0%
- −$2,474
- After-tax cash flow
- $7,506/yr
For passive investors: Depreciation is non-cash, so a rental often shows a tax loss while cash-flowing — sheltering income. Rental losses are passive: they offset passive income freely, and up to $25,000/yr can offset ordinary (W-2) income if you actively participate and your MAGI is under $100k (phasing out to $0 by $150k); unused losses carry forward. On sale, claimed depreciation is recaptured at up to 25%, and gains may owe capital-gains tax (a 1031 exchange can defer both). Figures are a year-1 estimate at your 24.0% rate — not tax advice; consult a CPA.
Schools (NCES district)
- District
- Burlington Community School District
- NCES district ID
- 1905790
- Math proficiency
- 42% ▼ -4.00%
- Reading proficiency
- 54% ▼ -1.00%
- Median HH income
- $41,833
- Composite
- 40.3/100
- National rank
- #3753
- State rank
- #286 of 289 in IA
Livability — Burlington
- Score
- 73/100
- State rank
- #287
- US rank
- #5540
Category grades
Schools grade is shown separately in the Schools card above.
Census & demographics
- Census place
- Burlington, IA
- County
- Des Moines County · 27,341 people
- City population
- 27,341
- Metro
- Burlington, IA-IL
- Population (ZIP)
- 27,341
- Household income
- $60,983
- Rent vs Own
- Severe rent burden
- 963.0
Population outlook (Des Moines County) Hauer SSP2
- Today (2025)
- 39,735 people
- By 2030
- 39,257 · -1.2%
- By 2040
- 38,090 · -4.1%
- By 2050
- 37,156 · -6.5%
- By 2075
- 36,905 · -7.1%
- By 2100
- 37,222 · -6.3%
Race, ethnicity, and origin ACS 2023
- Neighborhood character
- Predominantly White (83%)
- Race & ethnicity
- White 83% Two or more races 8% Black 5% Hispanic / Latino 4% Asian 1%
- Common ancestry
- Iranian 2% Lithuanian 2% Slovak 2%
- Foreign-born
- 3% · Canada
- Languages at home
- 95% English-only · Spanish 3% Other Asian/Pacific 1%
Political lean MEDSL · Des Moines
- 2024 margin
- R (+15.1) · D 41.8% · R 56.8% · Other 1.4%
- 2008→2024 swing
- -38.1pp toward R · 2008: 23.0pp · 2024: -15.1pp
- All cycles
- 2024: R+15.1 2020: R+8.5 2016: R+7.0 2012: D+18.5 2008: D+23.0
Not yet ingested
- Civics
- —
Market trends
- HPI YoY
- ▼ -83.48%
- Current HPI
- 149.7662
- Rent YoY
- —
- Metro
- Burlington, IA-IL
- State GDP YoY
- ▲ 2.48%
- F500 in state
- 4
Industry mix (Fortune 500 HQ in IA)
| Industry | F500 HQs | Revenue |
|---|---|---|
| Financial Services | 1 | $16B |
|
||
| Retail / Convenience | 1 | $15B |
|
||
Price history
-44.5% since first listed3 events — show timeline
- 2026-04-14 Listed $17,900 IAR
- 2025-02-12 Sold (Public Records) $17,900 Public Records
- 2021-10-18 Sold (Public Records) $32,250 Public Records
Property tax history
+2.4%/yrLatest (2025): $1,874 · -0.6% YoY. Source: county tax records.
Cash-flow waterfall
monthlySold comps — $/sqft
last 12 mo · ≤1 miLoading sold comps…