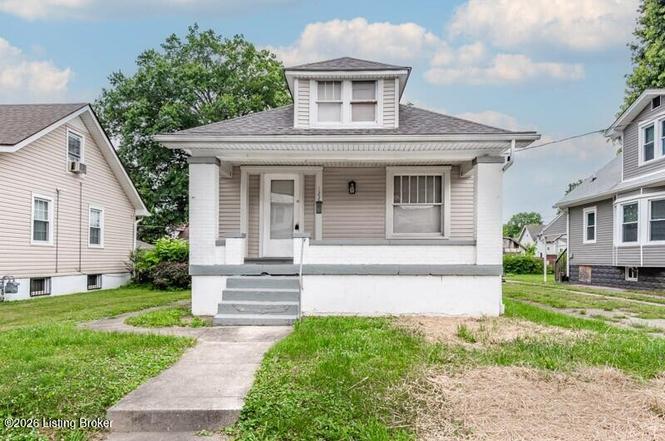
122 S 42nd St · Louisville, KY
Flood risk 1/10 · Minimal
- FEMA flood zone
- X (shaded)
- Chance of flooding over 30 yrs
- 0.0%
- Est. flood insurance / yr
- $473 – $860
Fire risk 1/10 · Minimal
- Est. fire insurance / yr
- $839 – $1,559
Heat risk 5/10 · Moderate
- Hot days now (above 104°F)
- 7 days/yr
- Hot days in 30 yrs
- 20 days/yr
Wind risk 2/10 · Minimal
- Chance of severe wind over 30 yrs
- 1.0%
Air-quality risk 2/10 · Minimal
- Unhealthy air days now
- 1 days/yr
- Unhealthy air days in 30 yrs
- 2 days/yr
Risk factors via First Street. Map © Google.
Why this score? — see what drove the B- grade
The composite is a weighted blend of 9 inputs, each scored 0–100. Each bar is that input's sub-score; the figure is the points it added to the 100-point composite (weight × sub-score).
- Cash flow +24.5/30.0
- Appreciation +10.0/10.0
- DSCR +7.9/10.0
- ARV discount +7.9/15.0
- 1% rule +5.3/10.0
- Livability +3.2/5.0
- Rent growth +2.6/5.0
- Condition / age +2.5/5.0
- Schools +2.3/10.0
$136,900
🖨 Deal sheet 📄 Offer letter ✓ Due diligence
Listing remarks MLS
Absolute Online Auction - 1 of 2 Properties! - Online Bidding Ends Mon. Sept. 28, 2015. Very clean 1.5 story home, vinyl siding, recently renovated, fresh paint, wood floors, full unfinished basement, central air. This home has not been occupied since renovation and is in move-in condition. 3 to 4 bedrooms. Was previously rented for $735 per month, before an additional bedroom was added. The 305 non-conforming finished sq. ft. is located on the second floor where the ceiling height is 6'9', just short of the required 7'. 10% Buyers Premium. $3,000 Down. Rick Wardlow Auctioneer. For more information, photos and terms please visit RealtyHotwire's web site. Second property in this online auction is located at 220 S. 42nd St. for those who would like rental properties close together.
Key facts
- Original hardwood
- Covered front porch
- Side driveway
Tags
Property features AI
Finance
- Other: Subdivision: FRAZEE PLACE; Directions: West on Market Street to North onto S. 42nd St
- HOA & community: No association fee
Exterior
- Parking: Front entry driveway
- Utilities: Electricity connected; Natural gas available; One HVAC unit
- Home design: Single-family residence, Cape Cod style; 2 stories; Built in 1925
- Construction: Vinyl siding; Shingle roof; Poured concrete foundation
- Exterior features: Sidewalk along the lot; Fencing (unspecified type)
Interior
- Kitchen: Kitchen on the first floor; Separate dining room on the first floor
- Bedrooms: Three bedrooms on the first floor; One non-conforming finished room on the second level
- Bathrooms: One full bathroom on the first floor
- Heating & cooling: Forced air heating (natural gas); Wall/window cooling unit(s)
- Interior features: Seven total rooms; Basement is unfinished; Lots of original wood throughout; Living room with columns and original wood
- Laundry & utility: No first-floor laundry
Neighborhood map
What this means for you Summary
Snapshot
- This is a 4-bed/1.0-bath single-family listed at $137k.
Deal economics
- At list price, monthly cash flow is $281 ($3k/yr) — positive.
- The deal already cash-flows at list — no discount required.
- Meets the 1% rule at list price ($1k rent vs $137k).
- Cap rate 8.8% vs local median 5.0% in Louisville — top-decile yield for the area; either an underpriced asset or a hidden risk that comps aren't pricing in. Stress-test before assuming the spread holds.
Location & tenants
- Location reads 63/100 on livability (#333 in KY) — a middle-class / working-renter tenant base. Strengths: cost of living A+, housing A+; Watch: employment C-, health & safety D+, schools D-.
- Jefferson County (urban): math 19% / reading 35% proficiency, ranked #121 of 165 in KY (top 73%) — low school quality limits family demand, transient renter base, plan for 1-2y turnover.
- Market conditions: Rents flat; 140 active listings in the ZIP; 24 comparable units currently listed for rent nearby; rentals at typical pace (median 19d on market — plan ~3-4 weeks tenant-placement turnaround); lower-income renter base — watch delinquency; 2,836 units permitted in Jefferson County in 2024 (1,558 in 5+ unit buildings).
- At $1,415/mo this rent would consume 48% of the median local household income ($36k/yr) (locally 1148% of renters already pay >50% of income on rent) — very limited rent-growth headroom before tenants either downsize or default.
Forward outlook
- In year one you build about $15k of equity ($946 loan paydown + $14k appreciation (10.0% local appreciation)).
- Jefferson County population projected at +13% by 2050 — modest demand growth; plan on rents tracking national, not racing it.
- At projected returns (10.0% appreciation + 0.5% rent growth), your $38k cash investment doubles in ~3 years — after that, you're playing with house money.
- By year 3, paydown + projected appreciation supports a ~$37k cash-out refi (75% LTV) — recoverable capital for the next deal without selling this one.
Negotiation context
- Only 7 days on market — expect competitive offers; lowballing is unlikely to land.
- 2 sale attempts since 11y ago with the ask held roughly flat each time — persistent listings suggest the price (not the market) is what's stuck; bring a comps-based counter.
- Current owner paid $41k; list at $137k implies a 238% gain — meaningful room to come down on a strong offer.
Risks & watch-outs
- Watch-outs: built in 1925 — expect roof / HVAC / electrical / plumbing capex.
- Climate carrying-cost: extreme-heat days projected 7→20/yr by 2055 (HVAC capex compounding) — expect insurance premiums to compound above CPI over the hold.
Questions for the listing agent
- Built in 1925 — when were the roof, HVAC, electrical panel, plumbing, and water heater last replaced?
- Is there a deadline driving the sale (1031 exchange, divorce, estate, relocation)? That informs how much negotiation room exists.
- Schools are D-rated, which usually means shorter tenancies and higher turnover. Who's the typical renter profile here, and what's been the actual vacancy rate?
- Crime grade is F in this area — have there been break-ins, vandalism, or insurance claims at this property in the last 3 years? What carrier currently insures it and at what premium?
- What's the average days-on-market for RENTAL listings here right now (not sales)? A rising rental-DOM trend means longer vacancies and softer asking-rent achievability than the comps imply.
- What's the recent tenant-quality profile in this submarket — average credit score on applications, eviction rate, late-payment / NSF rate, and stable-employment percentage? A property-management company in the area should have these aggregated.
- How much new for-sale + rental construction is in the pipeline within 1–3 miles? Heavy new supply typically softens prices + rents 12–24 months out; constrained supply supports both.
Investment metrics
- 1% rule
- 1.03% ✓
- Cap rate
- 8.75%
- Cash-on-cash
- 8.78%
- DSCR
- 1.39
- GRM
- 8.1
CMA / ARV
- ARV (on-the-fly)
- $138,160
- Comps found
- 12
Show comp detail 12 sales within ~0.75 mi
| Address | Dist | Beds/Ba | Sqft | Sold | Price | $/sf | Match |
|---|---|---|---|---|---|---|---|
| 103 S 42nd St | 0.06mi | 5/1.0 (+1) | 1,503 (-4%) | 3mo | $60,000 | $40 | 83 |
| 237 Glendora Ave | 0.22mi | 3/2.0 (-1) | 1,436 (-8%) | 2mo | $186,250 | $130 | 65 |
| 309 S 41st St | 0.30mi | 3/2.0 (-1) | 1,675 (+7%) | 2mo | $102,000 | $61 | 64 |
| 233 S 41st St | 0.22mi | 4/2.0 | 1,765 (+12%) | 2mo | $110,000 | $62 | 64 |
| 107 N 38th St | 0.38mi | 3/1.0 (-1) | 1,649 (+5%) | 8mo | $145,000 | $88 | 63 |
| 238 S 41st St | 0.22mi | 3/2.0 (-1) | 1,450 (-8%) | 8mo | $119,900 | $83 | 61 |
| 405 N 38th St | 0.57mi | 4/2.0 | 1,616 (+3%) | 7mo | $190,000 | $118 | 59 |
| 624 S 39th St | 0.71mi | 4/2.5 | 1,596 (+2%) | 5mo | $180,000 | $113 | 54 |
| 634 S 38th St | 0.75mi | 4/2.0 | 1,500 (-4%) | 5mo | $165,000 | $110 | 50 |
| 4020 W Muhammad Ali Blvd | 0.46mi | 5/2.0 (+1) | 1,422 (-9%) | 8mo | $175,000 | $123 | 48 |
| 114 S 33rd St | 0.71mi | 3/1.5 (-1) | 1,453 (-8%) | 4mo | $110,000 | $76 | 44 |
| 636 S 40th St | 0.74mi | 3/1.0 (-1) | 1,735 (+10%) | 7mo | $140,000 | $81 | 37 |
Match score weights: distance 35% · size 25% · config 20% · recency 20%. Top-matched comps best support the ARV.
Projected returns pro-forma
10.0% appreciation · 0.51% rent growth · sell at horizon
- IRR
- 29.7%
- Equity multiple
- 3.32×
- Total profit
- $88,927
- Equity at exit
- $123,330
- IRR
- 25.1%
- Equity multiple
- 7.30×
- Total profit
- $241,399
- Equity at exit
- $265,967
Cash invested: $38,332 (down + closing). Projections, not guarantees.
Landlord ↔ Tenant lean methodology
- Overall (STATE)
- 83 Strongly Landlord-Friendly
- State Kentucky
- 83 Strongly Landlord-Friendly · R+16
- County
- — inherits STATE
- City
- — inherits STATE
ZIP-level market 40212
- Home prices YoY
- 11.0%
- Rents YoY
- 0.5%
- Active inventory
- 140
- Price-to-rent
- 8.1×
Monthly cashflow live
- Estimated rent
- $1,415 high interval (Pro) →
- Mortgage (P&I)
- −$718
- Tax from tax record
- −$62 /mo · $749/yr
- Insurance
- −$57
- HOA
- −$0
- Vacancy / Maint / Mgmt
- −$297
- Net cashflow
- $281
Break-even live
UW: 25.0% down · 7.5% · 30yr · 1.5% tax · 5.0% vac · 8.0% maint · 8.0% mgmt
Financing live
Cash to close
- Down payment
- $34,225
- Closing costs
- $4,107
- Reserves months
- —
- Total cash needed
- —
Loan-product check · same deal, 3 products live
Conventional
25% down · 7.5% · 30yr
- Down + closing
- —
- Monthly P&I
- —
- Monthly cashflow
- —
- DSCR
- —
- Eligible?
- —
Personal DTI + credit; lowest rate.
DSCR
20% down · 8.5% · 30yr
- Down + closing
- —
- Monthly P&I
- —
- Monthly cashflow
- —
- DSCR
- —
- Eligible?
- —
No personal income docs; deal must DSCR.
Hard money
10% down · 12.0% · 12mo
- Down + closing
- —
- Monthly P&I
- —
- Monthly cashflow
- —
- DSCR
- —
- Eligible?
- —
Short-term bridge; refi at stabilization.
Rent comps 24 comps
| Address | Beds | Baths | Sqft | Rent | $/sqft | DOM | Units | Dist |
|---|---|---|---|---|---|---|---|---|
| 106 N 40th St Louisville, KY | 3.0 | 1.0 | 1325 | $1,220 | $0.92 | 3d | 1 | 0.18mi |
| 247 Cecil Ave Louisville, KY | 3.0 | 2.0 | 1083 | $1,305 | $1.20 | 19d | 1 | 0.20mi |
| 127 N 40th St Louisville, KY | 3.0 | 2.0 | 1500 | $1,570 | $1.05 | 3d | 1 | 0.22mi |
| 3901 Jewell Ave Louisville, KY | 3.0 | 1.0 | 1069 | $1,140 | $1.07 | 20d | 1 | 0.38mi |
| 4129 W Muhammad Ali Blvd Louisville, KY | 4.0 | 2.0 | 1224 | $1,500 | $1.23 | 1d | 1 | 0.41mi |
| 3819 River Park Dr Louisville, KY | 3.0 | 1.0 | 1108 | $1,090 | $0.98 | 20d | 1 | 0.61mi |
| 628 S 39th St Louisville, KY | 3.0 | 1.0 | 1448 | $1,220 | $0.84 | 16d | 1 | 0.71mi |
| 627 S 38th St Louisville, KY | 4.0 | 1.0 | 1300 | $1,349 | $1.04 | 16d | 1 | 0.72mi |
| 652 S 37th St #9 Louisville, KY | 3.0 | 1.0 | 1070 | $1,095 | $1.02 | 23d | 1 | 0.87mi |
| 3909 W Broadway Louisville, KY | 5.0 | 2.0 | 2000 | $1,745 | $0.87 | 16d | 1 | 0.93mi |
| 722 S 40th St Unit NA Louisville, KY | 4.0 | 2.5 | 1556 | $1,700 | $1.09 | 3d | 1 | 1.02mi |
| 714 S 42nd St Louisville, KY | 3.0 | 1.0 | 1078 | $1,150 | $1.07 | 16d | 1 | 1.03mi |
| 803 Cecil Ave Louisville, KY | 4.0 | 1.0 | 1165 | $1,449 | $1.24 | 10d | 1 | 1.10mi |
| 836 S 41st St Louisville, KY | 3.0 | 1.0 | 1300 | $1,300 | $1.00 | 19d | 1 | 1.17mi |
| 823 S 38th St Louisville, KY | 3.0 | 1.0 | 1100 | $1,195 | $1.09 | 3d | 1 | 1.18mi |
| 803 S 35th St Louisville, KY | 3.0 | 1.0 | 1486 | $1,350 | $0.91 | 23d | 1 | 1.21mi |
| 737 S 33rd St Louisville, KY | 4.0 | 1.0 | 1356 | $1,595 | $1.18 | 23d | 1 | 1.22mi |
| 814 S 33rd St Louisville, KY | 3.0 | 1.0 | 1104 | $1,350 | $1.22 | 3d | 1 | 1.28mi |
| 205 N 26th St Louisville, KY | 5.0 | 2.0 | 1538 | $1,700 | $1.11 | 23d | 1 | 1.36mi |
| 2529 W Main St #2 Louisville, KY | 3.0 | 1.0 | 1404 | $1,200 | $0.85 | 23d | 1 | 1.39mi |
| 820 Hazel St Louisville, KY | 4.0 | 2.0 | 1872 | $1,395 | $0.75 | 3d | 1 | 1.40mi |
| 2906 Montgomery St Unit B Louisville, KY | 3.0 | 1.0 | 1152 | $1,060 | $0.92 | 23d | 1 | 1.44mi |
| 2508 W Main St Louisville, KY | 3.0 | 1.0 | 1327 | $1,500 | $1.13 | 23d | 1 | 1.45mi |
| 212 N 25th St Louisville, KY | 3.0 | 1.0 | 1104 | $895 | $0.81 | 23d | 1 | 1.47mi |
Listing history 6 events
-
2026-06-18days on market $136,900 Active 7 DOM
-
2026-06-17days on market $136,900 Active 6 DOM
-
2026-06-16days on market $136,900 Active 5 DOM
-
2026-06-15days on market $136,900 Active 4 DOM
-
2026-06-13remarks 400-char remark
-
2026-06-13$136,900 Active 2 DOM
ⓘ Source: listings_history table (triggers on properties + properties_extension) + one-shot
backfill from property_details.listing_events for pre-trigger history.
Tax reassessment forecast KY · Resets to sale price
- Current annual tax
- $749 · $62/mo
- Projected year-2 tax
- $1,177 · $98/mo
- Expected delta
- +$428/yr (+$36/mo · 57.1%)
ⓘ Screening estimate from a state-policy table — verify with the county assessor before closing.
Climate risk First Street
- Flood 1/10 Low FEMA zone X (shaded) · 0% chance over 30 yrs
- Wildfire 1/10 Low
- Heat 5/10 Major 7 d/yr ≥104°F today · 20 d/yr by 30 yrs out
- Wind 2/10 Low 100% chance of damaging wind over 30 yrs
- Air quality 2/10 Low 1 unhealthy d/yr today · 2 by 30 yrs out
Nearby sold comps map
Loading sold comps map…
Walkable amenities ~0.75 mi
Loading nearby amenities…
Taxation est. · year 1
- Rental income
- $16,983
- − Mortgage interest
- −$7,669
- − Property taxes
- −$749
- − Insurance
- −$684
- − Repairs & maintenance
- −$1,359
- − Management
- −$1,359
- − Depreciation
- −$3,983
- Taxable income
- $1,180
- Est. tax owed @ 24.0%
- −$283
- After-tax cash flow
- $3,084/yr
For passive investors: Depreciation is non-cash, so a rental often shows a tax loss while cash-flowing — sheltering income. Rental losses are passive: they offset passive income freely, and up to $25,000/yr can offset ordinary (W-2) income if you actively participate and your MAGI is under $100k (phasing out to $0 by $150k); unused losses carry forward. On sale, claimed depreciation is recaptured at up to 25%, and gains may owe capital-gains tax (a 1031 exchange can defer both). Figures are a year-1 estimate at your 24.0% rate — not tax advice; consult a CPA.
Schools (NCES district)
- District
- Jefferson County
- NCES district ID
- 2102990
- Math proficiency
- 19% ▼ -17.00%
- Reading proficiency
- 35% ▼ -11.00%
- Median HH income
- $47,885
- Composite
- 23.45/100
- National rank
- #7884
- State rank
- #121 of 165 in KY
Livability — Louisville
- Score
- 63/100
- State rank
- #333
- US rank
- #15887
Category grades
Schools grade is shown separately in the Schools card above.
Census & demographics
- Census place
- Louisville, KY
- County
- Jefferson County · 790,184 people
- City population
- 769,292
- Metro
- Louisville/Jefferson County, KY-IN
- Population (ZIP)
- 14,661
- Household income
- $35,753
- Rent vs Own
- Severe rent burden
- 1148.0
Population outlook (Jefferson County) Hauer SSP2
- Today (2025)
- 823,112 people
- By 2030
- 849,343 · +3.2%
- By 2040
- 895,696 · +8.8%
- By 2050
- 933,630 · +13.4%
- By 2075
- 1,028,262 · +24.9%
- By 2100
- 1,072,675 · +30.3%
Race, ethnicity, and origin ACS 2023
- Neighborhood character
- Majority Black (60%)
- Race & ethnicity
- Black 60% White 37% Two or more races 2% Hispanic / Latino 1%
- Common ancestry
- Slovak 1% Lithuanian 1% Iranian 1%
- Foreign-born
- 1% · Canada
- Languages at home
- 98% English-only · Spanish 1%
Political lean MEDSL · Jefferson
- 2024 margin
- D (+16.6) · D 57.4% · R 40.9% · Other 1.7%
- 2008→2024 swing
- +4.5pp toward D · 2008: 12.0pp · 2024: 16.6pp
- All cycles
- 2024: D+16.6 2020: D+20.1 2016: D+13.3 2012: D+11.1 2008: D+12.0
Not yet ingested
- Civics
- —
Market trends
- HPI YoY
- ▲ 29.02%
- Current HPI
- 293.2624
- Rent YoY
- ▲ 0.51%
- Metro
- Louisville/Jefferson County, KY-IN
- State GDP YoY
- ▲ 1.81%
- F500 in state
- 4
Industry mix (Fortune 500 HQ in KY)
| Industry | F500 HQs | Revenue |
|---|---|---|
| Healthcare | 1 | $118B |
|
||
| Food / Beverage | 1 | $7B |
|
||
Price history
+238.7% since first listed5 events — show timeline
- 2026-06-11 Listed $136,900 Metro Search MLS
- 2015-10-15 Sold (Public Records) $40,525 Public Records
- 2015-10-13 Sold (MLS) $40,425 Metro Search MLS
- 2015-10-01 Pending — Metro Search MLS
- 2015-09-18 Listed $1 Metro Search MLS
Property tax history
+3.8%/yrLatest (2025): $749 · -1.9% YoY. Source: county tax records.
Cash-flow waterfall
monthlySold comps — $/sqft
last 12 mo · ≤1 miLoading sold comps…