11498 Miller St · Shirley, PA
Flood risk 1/10 · Minimal
- FEMA flood zone
- X (unshaded)
- Chance of flooding over 30 yrs
- 0.0%
- Est. flood insurance / yr
- $473 – $860
Fire risk 3/10 · Minor
- Est. fire insurance / yr
- $511 – $949
Heat risk 4/10 · Minor
- Hot days now (above 99°F)
- 7 days/yr
- Hot days in 30 yrs
- 16 days/yr
Wind risk 2/10 · Minimal
- Chance of severe wind over 30 yrs
- 1.0%
Air-quality risk 2/10 · Minimal
- Unhealthy air days now
- 1 days/yr
- Unhealthy air days in 30 yrs
- 1 days/yr
Risk factors via First Street. Map © Google.
Why this score? — see what drove the B grade
The composite is a weighted blend of 9 inputs, each scored 0–100. Each bar is that input's sub-score; the figure is the points it added to the 100-point composite (weight × sub-score).
- Cash flow +26.8/30.0
- Appreciation +10.0/10.0
- DSCR +9.2/10.0
- ARV discount +7.5/15.0
- 1% rule +7.3/10.0
- Rent growth +2.5/5.0
- Livability +2.5/5.0
- Condition / age +2.5/5.0
- Schools +2.3/10.0
$85,000
🖨 Deal sheet (PDF) 📄 Offer letter ✓ Due diligence
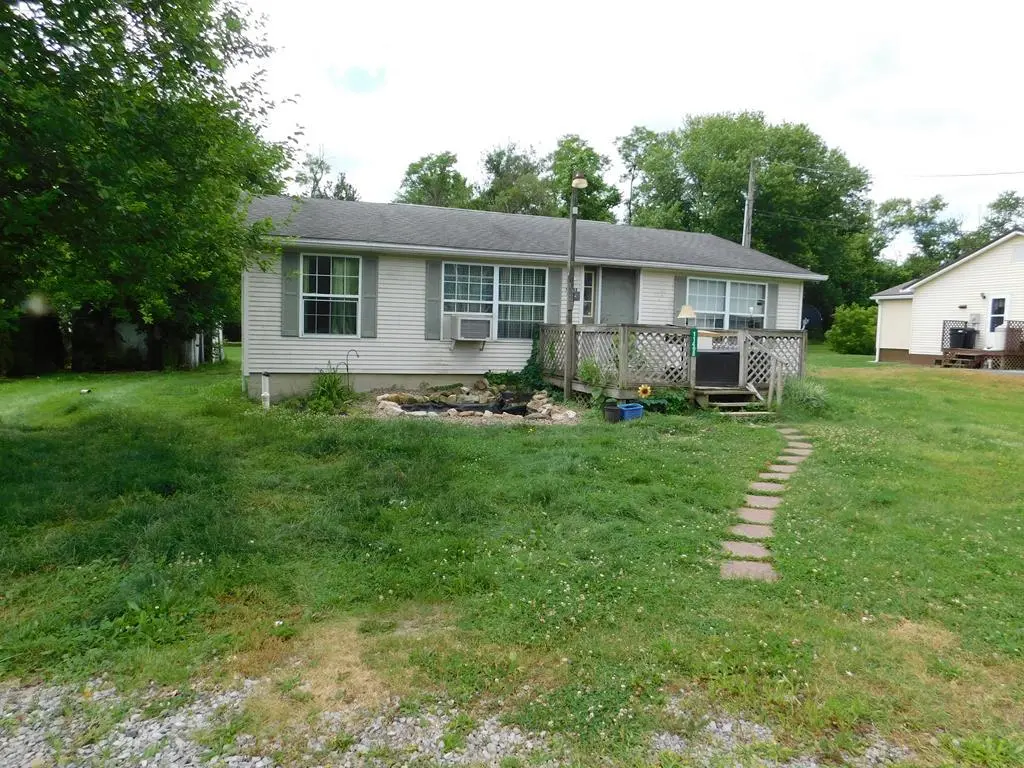
Listing remarks
This 3-bedroom, 2-bathroom doublewide sits on a beautiful, level 0.45-acre lot and features a spacious living room, kitchen, and dedicated laundry room. Inside, it just needs some fresh paint and new flooring to truly make it your own. Outside, the decks are ready for some TLC or a complete replacement to design your perfect outdoor seating area. Offering great potential at an accessible price point, this home is being sold as-is—perfect for an investor or a buyer looking to build equity.
Key facts
- 0.45 acre lot
- Built 1999
- Listed 13 days
Property features AI
Exterior
- Parking: Open parking; Gravel/off-street/unpaved driveway
- Utilities: Public water; Public sewer; 100 amp electric service
- Home design: Manufactured house (double wide); Single-story entry (above-grade living area listed separately)
- Construction: Vinyl siding; Shingle roof; Crawl space foundation; Built as manufactured home
- Exterior features: Deck; Shed(s)
Interior
- Bathrooms: 2 full bathrooms
- Heating & cooling: Forced air heating; No central cooling
- Interior features: Eat-in kitchen; Skylight(s)
Neighborhood map
What this means for you Summary
Snapshot
- This is a 3-bed/2.0-bath other listed at $85k.
Deal economics
- At list price, monthly cash flow is $233 ($3k/yr) — positive.
- The deal already cash-flows at list — no discount required.
- Meets the 1% rule at list price ($1k rent vs $85k).
Location & tenants
- Location reads: area grade B — affects rentability + tenant quality, not the cash-flow math above.
- Mount Union Area SD (town): math 19% / reading 35% proficiency, ranked #462 of 539 in PA (top 86%) — low school quality limits family demand, transient renter base, plan for 1-2y turnover.
- Zoned schools: Shirley Twp El Sch (math 22% / reading 37%, grade F, #1,125 of 1,518 statewide, top 75%, 265 students, 100% FRL); Mount Union Area Jhs (math 10% / reading 33%, grade F, #429 of 512 statewide, top 84%, 261 students, 100% FRL); Mount Union Area Shs (math 37%, 354 students, 80% FRL) — zoned schools average 93% FRL vs 56% district-wide (38 pts higher); higher-poverty schools than district average — tighter screening recommended.
- Market conditions: 25 active listings in the ZIP; 70 units permitted in Huntingdon County in 2024 (0 in 5+ unit buildings).
Forward outlook
- In year one you build about $9k of equity ($588 loan paydown + $8k appreciation (10.0% local appreciation)).
- Huntingdon County population projected at -14% by 2050 — secular population decline; favor cash flow + early exit over multi-decade hold.
- At projected returns (10.0% appreciation + 3.0% rent growth), your $24k cash investment doubles in ~2 years — after that, you're playing with house money.
- By year 4, paydown + projected appreciation supports a ~$32k cash-out refi (75% LTV) — recoverable capital for the next deal without selling this one.
Negotiation context
- Only 13 days on market — expect competitive offers; lowballing is unlikely to land.
- Current owner paid $69k; 23% above their basis — modest negotiation headroom, anchor on the comps not their cost.
Questions for the listing agent
- Is there a deadline driving the sale (1031 exchange, divorce, estate, relocation)? That informs how much negotiation room exists.
- What's the average days-on-market for RENTAL listings here right now (not sales)? A rising rental-DOM trend means longer vacancies and softer asking-rent achievability than the comps imply.
- What's the recent tenant-quality profile in this submarket — average credit score on applications, eviction rate, late-payment / NSF rate, and stable-employment percentage? A property-management company in the area should have these aggregated.
- How much new for-sale + rental construction is in the pipeline within 1–3 miles? Heavy new supply typically softens prices + rents 12–24 months out; constrained supply supports both.
Investment metrics
- 1% rule
- 1.23% ✓
- Cap rate
- 9.58%
- Cash-on-cash
- 11.74%
- DSCR
- 1.52
- GRM
- 6.8
CMA / ARV
No comps found within radius.
Projected returns pro-forma
10.0% appreciation · 3.0% rent growth · sell at horizon
- IRR
- 32.9%
- Equity multiple
- 3.57×
- Total profit
- $61,144
- Equity at exit
- $76,575
- IRR
- 28.4%
- Equity multiple
- 8.08×
- Total profit
- $168,433
- Equity at exit
- $165,136
Cash invested: $23,800 (down + closing). Projections, not guarantees.
Landlord ↔ Tenant lean methodology
- Overall (STATE)
- 62 Landlord-Friendly
- State Pennsylvania
- 62 Landlord-Friendly · EVEN
- County
- — inherits STATE
- City
- — inherits STATE
ZIP-level market 17066
- Home prices YoY
- 6.3%
- Active inventory
- 25
- Price-to-rent
- 6.8×
Monthly cashflow live
- Estimated rent
- $1,046 medium interval (Pro) →
- Mortgage (P&I)
- −$446
- Tax from tax record
- −$112 /mo · $1,344/yr
- Insurance
- −$35
- HOA
- −$0
- Vacancy / Maint / Mgmt
- −$220
- Net cashflow
- $233
Break-even live
Sensitivity live
| Price | -10% $281 | -5% $257 | +0% $233 | +5% $209 | +10% $185 |
|---|---|---|---|---|---|
| Rent | -10% $150 | -5% $192 | +0% $233 | +5% $274 | +10% $315 |
| Rate | -1.0pp $276 | -0.5pp $254 | base $233 | +0.5pp $211 | +1.0pp $188 |
UW: 25.0% down · 7.5% · 30yr · 1.5% tax · 5.0% vac · 8.0% maint · 8.0% mgmt
Financing live
Cash to close
- Down payment
- $21,250
- Closing costs
- $2,550
- Reserves months
- —
- Total cash needed
- —
Loan-product check · same deal, 3 products live
Conventional
25% down · 7.5% · 30yr
- Down + closing
- —
- Monthly P&I
- —
- Monthly cashflow
- —
- DSCR
- —
- Eligible?
- —
Personal DTI + credit; lowest rate.
DSCR
20% down · 8.5% · 30yr
- Down + closing
- —
- Monthly P&I
- —
- Monthly cashflow
- —
- DSCR
- —
- Eligible?
- —
No personal income docs; deal must DSCR.
Hard money
10% down · 12.0% · 12mo
- Down + closing
- —
- Monthly P&I
- —
- Monthly cashflow
- —
- DSCR
- —
- Eligible?
- —
Short-term bridge; refi at stabilization.
Listing history 10 events
-
2026-06-21days on market $85,000 Active 13 DOM
-
2026-06-21days on market $85,000 Active 12 DOM
-
2026-06-18days on market $85,000 Active 10 DOM
-
2026-06-17days on market $85,000 Active 9 DOM
-
2026-06-16days on market $85,000 Active 8 DOM
-
2026-06-15days on market $85,000 Active 7 DOM
-
2026-06-13days on market $85,000 Active 5 DOM
-
2026-06-12days on market $85,000 Active 4 DOM
-
2026-06-09remarks 493-char remark
-
2026-06-09$85,000 Active 1 DOM
ⓘ Source: listings_history table (triggers on properties + properties_extension) + one-shot
backfill from property_details.listing_events for pre-trigger history.
Tax reassessment forecast PA · Partial reset (capped growth)
- Current annual tax
- $1,344 · $112/mo
- Projected year-2 tax
- $1,344 · $112/mo
- Expected delta
- $0/yr ($0/mo · 0.0%)
ⓘ Screening estimate from a state-policy table — verify with the county assessor before closing.
Climate risk First Street
- Flood 1/10 Low FEMA zone X (unshaded) · 0% chance over 30 yrs
- Wildfire 3/10 Moderate
- Heat 4/10 Moderate 7 d/yr ≥99°F today · 16 d/yr by 30 yrs out
- Wind 2/10 Low 100% chance of damaging wind over 30 yrs
- Air quality 2/10 Low 1 unhealthy d/yr today · 1 by 30 yrs out
Nearby sold comps map
Loading sold comps map…
Walkable amenities ~0.75 mi
Loading nearby amenities…
Taxation est. · year 1
- Rental income
- $12,547
- − Mortgage interest
- −$4,761
- − Property taxes
- −$1,344
- − Insurance
- −$425
- − Repairs & maintenance
- −$1,004
- − Management
- −$1,004
- − Depreciation
- −$2,473
- Taxable income
- $1,537
- Est. tax owed @ 24.0%
- −$369
- After-tax cash flow
- $2,426/yr
For passive investors: Depreciation is non-cash, so a rental often shows a tax loss while cash-flowing — sheltering income. Rental losses are passive: they offset passive income freely, and up to $25,000/yr can offset ordinary (W-2) income if you actively participate and your MAGI is under $100k (phasing out to $0 by $150k); unused losses carry forward. On sale, claimed depreciation is recaptured at up to 25%, and gains may owe capital-gains tax (a 1031 exchange can defer both). Figures are a year-1 estimate at your 24.0% rate — not tax advice; consult a CPA.
Schools (NCES district)
- District
- Mount Union Area SD
- NCES district ID
- 4216020
- Math proficiency
- 19% ▼ -7.00%
- Reading proficiency
- 35% ▼ -10.00%
- Median HH income
- $38,561
- Composite
- 22.56/100
- National rank
- #8080
- State rank
- #462 of 539 in PA
Livability — Shirley
No livability data for this city. (Only ~50 U.S. cities are tracked.)
Census & demographics
- Census place
- Allenport, PA
- Population (ZIP)
- 5,131
Population outlook (Huntingdon County) Hauer SSP2
- Today (2025)
- 44,212 people
- By 2030
- 43,057 · -2.6%
- By 2040
- 40,537 · -8.3%
- By 2050
- 37,844 · -14.4%
- By 2075
- 31,411 · -29.0%
- By 2100
- 23,907 · -45.9%
Race, ethnicity, and origin ACS 2023
- Neighborhood character
- Predominantly White (91%)
- Race & ethnicity
- White 91% Black 5% Two or more races 3% Hispanic / Latino 1%
- Common ancestry
- Romanian 1% Lithuanian 1% Iranian 1%
- Foreign-born
- 0% · Canada
- Languages at home
- 99% English-only · Spanish 1%
Political lean MEDSL · Huntingdon
- 2024 margin
- Solid R (+52.9) · D 23.2% · R 76.1%
- 2008→2024 swing
- -25.4pp toward R · 2008: -27.5pp · 2024: -52.9pp
- All cycles
- 2024: R+52.9 2020: R+51.0 2016: R+50.7 2012: R+37.4 2008: R+27.5
Not yet ingested
- Civics
- —
Market trends
- HPI YoY
- ▲ 10.34%
- Current HPI
- 173.1528
- Rent YoY
- —
- Metro
- —
- State GDP YoY
- ▲ 1.68%
- F500 in state
- 34
Industry mix (Fortune 500 HQ in PA)
| Industry | F500 HQs | Revenue |
|---|---|---|
| Healthcare | 2 | $309B |
|
||
| Insurance | 2 | $27B |
|
||
| Telecommunications / Media | 1 | $124B |
|
||
| Industrial Distribution | 1 | $22B |
|
||
| Financial Services | 1 | $20B |
|
||
| Chemicals / Materials | 1 | $18B |
|
||
Price history
+23.2% since first listed2 events — show timeline
- 2026-06-08 Listed $85,000 HCBR
- 2008-04-09 Sold (Public Records) $69,000 Public Records
Property tax history
+1.7%/yrLatest (2026): $1,344 · +1.5% YoY. Source: county tax records.
Cash-flow waterfall
monthlySold comps — $/sqft
last 12 mo · ≤1 miLoading sold comps…