5723 Roadhouse Dr · Terrell, TX
Flood risk No data
- FEMA flood zone
- —
- Chance of flooding over 30 yrs
- —
- Est. flood insurance / yr
- —
Fire risk No data
- Est. fire insurance / yr
- —
Heat risk No data
- Hot days now (above threshold)
- —
- Hot days in 30 yrs
- —
Wind risk No data
- Chance of severe wind over 30 yrs
- —
Air-quality risk No data
- Unhealthy air days now
- —
- Unhealthy air days in 30 yrs
- —
Risk factors via First Street. Map © Google.
Why this score? — see what drove the D grade
The composite is a weighted blend of 9 inputs, each scored 0–100. Each bar is that input's sub-score; the figure is the points it added to the 100-point composite (weight × sub-score).
- ARV discount +11.3/15.0
- Cash flow +11.1/30.0
- Schools +4.0/10.0
- Condition / age +4.0/5.0
- Livability +3.4/5.0
- 1% rule +3.2/10.0
- DSCR +3.2/10.0
- Rent growth +2.9/5.0
- Appreciation +0.0/10.0
$289,000
🖨 Deal sheet 📄 Offer letter ✓ Due diligence
Listing remarks
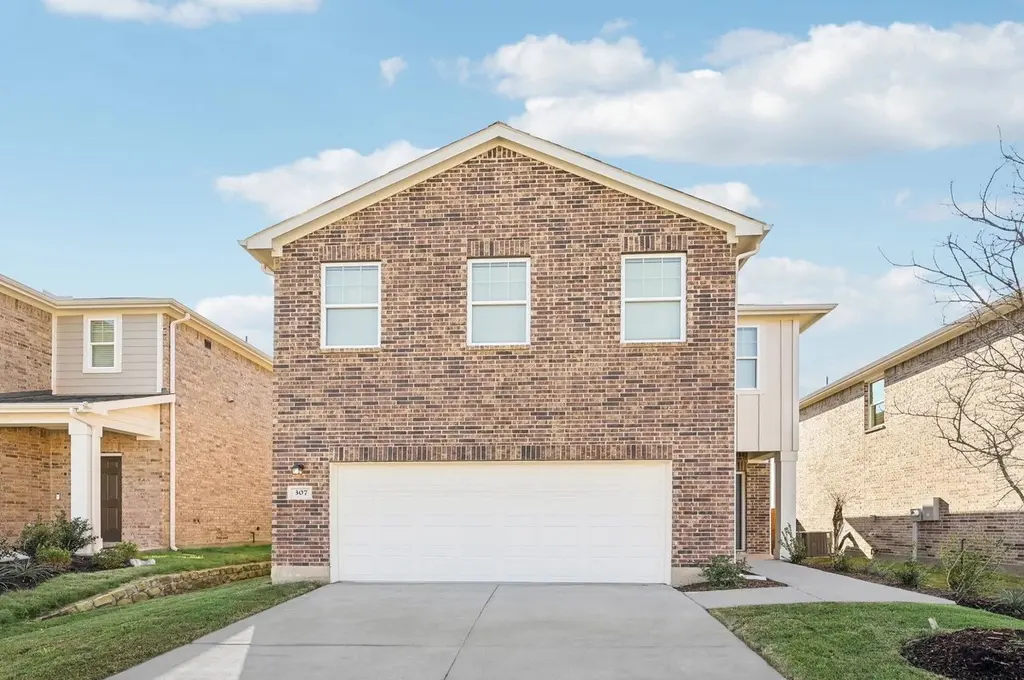
Get ready to walk into a new home that's made with you and your family in mind. The Discovery home plans include brand new stainless steel appliances, granite countertops and an upstairs loft. You can also invite friends and neighbors over for a cookout in your own private backyard.
Key facts
- Upstairs loft
- Private backyard
- Granite countertops
Tags
Property features AI
Finance
- Other: Listing status: Active; List price available (listing provided separately)
Exterior
- Parking: 2 parking spaces
- Utilities: Electric heating (heat pump); Central air
- Home design: Spec new construction (Discovery plan); Single-family property
Interior
- Kitchen: Dishwasher; Disposal; Microwave
- Bedrooms: 4 bedrooms
- Bathrooms: 2 bathrooms
- Heating & cooling: Electric heating with heat pump; Central air conditioning
- Interior features: Dishwasher; Disposal; Microwave
Neighborhood map
What this means for you Summary
Snapshot
- This is a 4-bed/2.0-bath single-family listed at $289k. Condition is rated good.
Deal economics
- At list price, monthly cash flow is $-114 ($-1k/yr) — negative.
- To cash-flow at today's rent, offer at most $272k (5.7% below list).
- To meet the 1% rule (rent ≥ 1% of price), the offer needs to be $238k (17.5% below list).
- Recommended offer: $238k (17.5% below list) — sets the bar for 1% rule.
- Cap rate 5.8% vs local median 3.8% in Terrell — top-decile yield for the area; either an underpriced asset or a hidden risk that comps aren't pricing in. Stress-test before assuming the spread holds.
Location & tenants
- Location reads 67/100 on livability (#520 in TX) — a middle-class / working-renter tenant base. Strengths: cost of living A+, housing A+; Watch: amenities C-, employment D, schools F.
- Forney ISD (rural): math 41% / reading 44% proficiency, ranked #234 of 826 in TX (top 28%) — families likely to look elsewhere, expect single-tenant / working-renter base with shorter leases.
- Market conditions: Rents rising (+1.4%/yr); 2179 active listings in the ZIP; 40 comparable units currently listed for rent nearby; rentals at typical pace (median 16d on market — plan ~3-4 weeks tenant-placement turnaround); solid renter incomes; 1,747 units permitted in Kaufman County in 2024 (180 in 5+ unit buildings).
Forward outlook
- Local home prices are declining (-3.0%/yr); year-one equity from $2k of loan paydown is wiped out by about $9k of value loss. Plan a longer hold.
- Kaufman County population projected at +43% by 2050 — long-run rental-demand tailwind backs the buy-and-hold thesis.
Negotiation context
- Only 14 days on market — expect competitive offers; lowballing is unlikely to land.
Questions for the listing agent
- What do current leases actually rent for vs. the listed asking? Can we see a recent rent roll and the last 12 months of T-12 income?
- Is there a deadline driving the sale (1031 exchange, divorce, estate, relocation)? That informs how much negotiation room exists.
- Schools are F-rated, which usually means shorter tenancies and higher turnover. Who's the typical renter profile here, and what's been the actual vacancy rate?
- The area grade is low — what's the realistic commute time and amenity access for the typical tenant pool here? Any planned neighborhood developments (good or bad) we should know about?
- What's the average days-on-market for RENTAL listings here right now (not sales)? A rising rental-DOM trend means longer vacancies and softer asking-rent achievability than the comps imply.
- What's the recent tenant-quality profile in this submarket — average credit score on applications, eviction rate, late-payment / NSF rate, and stable-employment percentage? A property-management company in the area should have these aggregated.
- How much new for-sale + rental construction is in the pipeline within 1–3 miles? Heavy new supply typically softens prices + rents 12–24 months out; constrained supply supports both.
Investment metrics
- 1% rule
- 0.82% ✗
- Cap rate
- 5.82%
- Cash-on-cash
- -1.70%
- DSCR
- 0.92
- GRM
- 10.1
CMA / ARV
- ARV (on-the-fly)
- $316,029
- Comps found
- 2
Show comp detail 2 sales within ~0.75 mi
| Address | Dist | Beds/Ba | Sqft | Sold | Price | $/sf | Match |
|---|---|---|---|---|---|---|---|
| 5909 Sahara Dr | 0.10mi | 4/2.5 | 2,121 (0%) | 8mo | $305,990 | $144 | 87 |
| 6121 Harrah Ln | 0.19mi | 3/2.0 (-1) | 1,840 (-13%) | 17mo | $274,900 | $149 | 50 |
Match score weights: distance 35% · size 25% · config 20% · recency 20%. Top-matched comps best support the ARV.
Projected returns pro-forma
-3.0% appreciation · 1.42% rent growth · sell at horizon
- IRR
- -20.9%
- Equity multiple
- 0.29×
- Total profit
- $-57,815
- Equity at exit
- $43,091
- IRR
- -18.2%
- Equity multiple
- 0.08×
- Total profit
- $-74,413
- Equity at exit
- $24,987
Cash invested: $80,920 (down + closing). Projections, not guarantees.
Landlord ↔ Tenant lean methodology
- Overall (STATE)
- 87 Strongly Landlord-Friendly
- State Texas
- 87 Strongly Landlord-Friendly · R+5
- County
- — inherits STATE
- City
- — inherits STATE
ZIP-level market 75126
- Rents YoY
- 1.4%
- Active inventory
- 2179
- Price-to-rent
- 10.1×
Monthly cashflow live
- Estimated rent
- $2,383 high interval (Pro) →
- Mortgage (P&I)
- −$1,516
- Tax est. 1.5%
- −$361 /mo · $4,335/yr
- Insurance
- −$120
- HOA
- −$0
- Vacancy / Maint / Mgmt
- −$500
- Net cashflow
- $-114
Break-even live
UW: 25.0% down · 7.5% · 30yr · 1.5% tax · 5.0% vac · 8.0% maint · 8.0% mgmt
Financing live
Cash to close
- Down payment
- $72,250
- Closing costs
- $8,670
- Reserves months
- —
- Total cash needed
- —
Loan-product check · same deal, 3 products live
Conventional
25% down · 7.5% · 30yr
- Down + closing
- —
- Monthly P&I
- —
- Monthly cashflow
- —
- DSCR
- —
- Eligible?
- —
Personal DTI + credit; lowest rate.
DSCR
20% down · 8.5% · 30yr
- Down + closing
- —
- Monthly P&I
- —
- Monthly cashflow
- —
- DSCR
- —
- Eligible?
- —
No personal income docs; deal must DSCR.
Hard money
10% down · 12.0% · 12mo
- Down + closing
- —
- Monthly P&I
- —
- Monthly cashflow
- —
- DSCR
- —
- Eligible?
- —
Short-term bridge; refi at stabilization.
Rent comps 40 comps
| Address | Beds | Baths | Sqft | Rent | $/sqft | DOM | Units | Dist |
|---|---|---|---|---|---|---|---|---|
| 5734 Roadhouse Forney, TX | 4.0 | 2.5 | 2121 | $2,350 | $1.11 | 1d | 1 | 0.03mi |
| 5940 Sahara Dr Forney, TX | 4.0 | 2.5 | 1700 | $2,650 | $1.56 | 1d | 1 | 0.07mi |
| 6075 Mojave Dr Forney, TX | 5.0 | 3.0 | 2777 | $2,595 | $0.93 | 15d | 1 | 0.08mi |
| 5919 Sahara Dr Forney, TX | 3.0 | 2.5 | 1605 | $2,100 | $1.31 | 24d | 1 | 0.08mi |
| 6086 Mojave Dr Forney, TX | 3.0 | 2.0 | 1412 | $1,995 | $1.41 | 7d | 1 | 0.09mi |
| 6076 Mojave Dr Forney, TX | 5.0 | 4.0 | 2962 | $2,595 | $0.88 | 3d | 1 | 0.10mi |
| 6076 Mojave Dr Forney, TX | 5.0 | 4.0 | 2962 | $2,900 | $0.98 | 44d | 1 | 0.10mi |
| 6222 Old Bridge Way Forney, TX | 3.0 | 2.0 | 1412 | $1,795 | $1.27 | 13d | 1 | 0.10mi |
| 6229 Old Bridge Way Forney, TX | 4.0 | 2.5 | 2121 | $1,950 | $0.92 | 13d | 1 | 0.12mi |
| 6231 Old Bridge Way Forney, TX | 4.0 | 3.0 | 2308 | $2,300 | $1.00 | 1d | 1 | 0.13mi |
| 6215 Old Bridge Way Forney, TX | 3.0 | 2.5 | 1605 | $1,845 | $1.15 | 44d | 1 | 0.13mi |
| 6211 Old Bridge Way Unit 6211OB Heath, TX | 3.0 | 2.0 | 1412 | $1,845 | $1.31 | 3d | 1 | 0.14mi |
| 6040 Mojave Dr Forney, TX | 3.0 | 2.5 | 1826 | $1,990 | $1.09 | 24d | 1 | 0.19mi |
| 6309 Tropicana Ln Forney, TX | 3.0 | 2.0 | 1412 | $2,050 | $1.45 | 44d | 1 | 0.20mi |
| 6310 Tropicana Ln Forney, TX | 5.0 | 3.0 | 2580 | $2,685 | $1.04 | 1d | 1 | 0.21mi |
| 6109 Harrah Ln Unit 6109HL Heath, TX | 3.0 | 2.0 | 1401 | $1,745 | $1.25 | 3d | 1 | 0.22mi |
| 6103 Harrah Ln Forney, TX | 3.0 | 2.0 | 1412 | $1,845 | $1.31 | 3d | 1 | 0.24mi |
| 6101 Harrah Ln Unit 6101HL Heath, TX | 3.0 | 2.0 | 1401 | $1,745 | $1.25 | 24d | 1 | 0.24mi |
| 6624 Charleston Dr Forney, TX | 3.0 | 2.0 | 1412 | $2,045 | $1.45 | 4d | 1 | 0.26mi |
| 6658 Charleston Dr Unit 6658CD Heath, TX | 3.0 | 2.5 | 1605 | $1,935 | $1.21 | 7d | 1 | 0.27mi |
| 6012 Mojave Dr Forney, TX | 3.0 | 2.5 | 1605 | $1,845 | $1.15 | 44d | 1 | 0.27mi |
| 4080 Dayton Dr Forney, TX | 4.0 | 2.5 | 1984 | $2,295 | $1.16 | 19d | 1 | 0.65mi |
| 1129 Clear Dusk Ln Forney, TX | 5.0 | 3.0 | 2520 | $3,600 | $1.43 | 44d | 1 | 0.92mi |
| 4424 Lassen Trl Forney, TX | 4.0 | 2.0 | 1984 | $2,295 | $1.16 | 44d | 1 | 0.94mi |
| 3122 Zapta Rd Forney, TX | 3.0 | 2.0 | 1681 | $2,150 | $1.28 | 44d | 1 | 0.94mi |
| 1229 Autumn Mist Ln Forney, TX | 4.0 | 3.0 | 2609 | $2,795 | $1.07 | 4d | 1 | 1.01mi |
| 3109 Chillingham Dr Forney, TX | 4.0 | 2.5 | 2181 | $2,199 | $1.01 | 3d | 1 | 1.09mi |
| 3112 Shorthorn Way Forney, TX | 3.0 | 2.0 | 1450 | $2,150 | $1.48 | 7d | 1 | 1.09mi |
| 9225 Lone Cypress Dr Forney, TX | 3.0 | 2.0 | 1605 | $2,120 | $1.32 | 5d | 1 | 1.12mi |
| 3010 Saddleback Way Forney, TX | 3.0 | 2.0 | 1538 | $1,895 | $1.23 | 44d | 1 | 1.12mi |
| 2043 Pleasant Knoll Cir Forney, TX | 3.0 | 2.0 | 1734 | $2,099 | $1.21 | 44d | 1 | 1.15mi |
| 3133 Angus Dr Forney, TX | 3.0 | 2.0 | 1681 | $2,050 | $1.22 | 44d | 1 | 1.17mi |
| 3088 Chillingham Dr Forney, TX | 3.0 | 2.0 | 1643 | $1,850 | $1.13 | 44d | 1 | 1.17mi |
| 3024 Chico Dr Forney, TX | 5.0 | 2.5 | 2694 | $2,350 | $0.87 | 13d | 1 | 1.17mi |
| 3010 McCoy Rd Forney, TX | 4.0 | 2.0 | 1683 | $2,050 | $1.22 | 24d | 1 | 1.24mi |
| 1539 Wheatley Way Forney, TX | 4.0 | 3.0 | 2396 | $2,800 | $1.17 | 10d | 1 | 1.24mi |
| 1539 Wheatley Way Forney, TX | 4.0 | 3.0 | 2396 | $2,995 | $1.25 | 17d | 1 | 1.24mi |
| 3013 McCoy Rd Forney, TX | 3.0 | 2.0 | 1643 | $1,895 | $1.15 | 24d | 1 | 1.27mi |
| 1535 Calcot Ln Forney, TX | 4.0 | 3.0 | 2036 | $2,600 | $1.28 | 15d | 1 | 1.28mi |
| 3023 Villegas Way Forney, TX | 4.0 | 2.0 | 1683 | $1,875 | $1.11 | 24d | 1 | 1.29mi |
Listing history 11 events
-
2026-06-18days on market $289,000 Active 14 DOM
-
2026-06-17days on market $289,000 Active 13 DOM
-
2026-06-16days on market $289,000 Active 12 DOM
-
2026-06-15days on market $289,000 Active 11 DOM
-
2026-06-13days on market $289,000 Active 9 DOM
-
2026-06-13days on market $289,000 Active 8 DOM
-
2026-06-09days on market $289,000 Active 5 DOM
-
2026-06-08days on market $289,000 Active 4 DOM
-
2026-06-07days on market $289,000 Active 3 DOM
-
2026-06-04remarks 283-char remark
-
2026-06-04$289,000 Active 1 DOM
ⓘ Source: listings_history table (triggers on properties + properties_extension) + one-shot
backfill from property_details.listing_events for pre-trigger history.
Nearby sold comps map
Loading sold comps map…
Walkable amenities ~0.75 mi
Loading nearby amenities…
Taxation est. · year 1
- Rental income
- $28,599
- − Mortgage interest
- −$16,188
- − Property taxes
- −$4,335
- − Insurance
- −$1,445
- − Repairs & maintenance
- −$2,288
- − Management
- −$2,288
- − Depreciation
- −$8,407
- Taxable loss
- −$6,353
- Est. tax savings @ 24.0%
- +$1,525
- After-tax cash flow
- $151/yr
For passive investors: Depreciation is non-cash, so a rental often shows a tax loss while cash-flowing — sheltering income. Rental losses are passive: they offset passive income freely, and up to $25,000/yr can offset ordinary (W-2) income if you actively participate and your MAGI is under $100k (phasing out to $0 by $150k); unused losses carry forward. On sale, claimed depreciation is recaptured at up to 25%, and gains may owe capital-gains tax (a 1031 exchange can defer both). Figures are a year-1 estimate at your 24.0% rate — not tax advice; consult a CPA.
Condition & rehab AI · 12 photos
This home is in excellent condition with modern updates and a move-in-ready appearance. It's a great investment opportunity with minimal work needed.
Value-add opportunities
- Both landscaping — enhances curb appeal and adds value
- Both painting — fresh paint can make a home look more inviting
Renovation cost estimate screening
Value-add ROI direction
- Both landscaping — enhances curb appeal and adds value ↑
- Both painting — fresh paint can make a home look more inviting ↑
ⓘ Cost ranges are severity-bucket heuristics (US national rule-of-thumb). Get contractor quotes + a written scope before underwriting a rehab budget.
Schools (NCES district)
- District
- Forney ISD
- NCES district ID
- 4819560
- Math proficiency
- 41% ▼ -20.00%
- Reading proficiency
- 44% ▼ -12.00%
- Median HH income
- $86,679
- Composite
- 40.07/100
- National rank
- #3812
- State rank
- #234 of 826 in TX
Livability — Terrell
- Score
- 67/100
- State rank
- #520
- US rank
- #10213
Category grades
Schools grade is shown separately in the Schools card above.
Census & demographics
- County
- Kaufman County · 122,338 people
- City population
- 28,206
- Metro
- Dallas-Fort Worth-Arlington, TX
- Population (ZIP)
- 84,799
- Household income
- $103,673
- Rent vs Own
- Severe rent burden
- 1306.0
Population outlook (Kaufman County) Hauer SSP2
- Today (2025)
- 138,716 people
- By 2030
- 150,815 · +8.7%
- By 2040
- 174,877 · +26.1%
- By 2050
- 198,020 · +42.8%
- By 2075
- 251,908 · +81.6%
- By 2100
- 285,325 · +105.7%
Race, ethnicity, and origin ACS 2023
- Neighborhood character
- Diverse neighborhood (Simpson 0.68)
- Race & ethnicity
- White 45% Black 25% Hispanic / Latino 23% Two or more races 14% Asian 3%
- Hispanic origin (detail)
- Mexican 18% Puerto Rican 1%
- Common ancestry
- Italian 2% Slovak 1% Portuguese 1%
- Foreign-born
- 12% · Canada, Vietnam
- Languages at home
- 79% English-only · Spanish 14% Arabic 1% Vietnamese 1%
Political lean MEDSL · Kaufman
- 2024 margin
- Strong R (+27.9) · D 35.6% · R 63.5%
- 2008→2024 swing
- +7.9pp toward D · 2008: -35.8pp · 2024: -27.9pp
- All cycles
- 2024: R+27.9 2020: R+33.9 2016: R+47.0 2012: R+44.4 2008: R+35.8
Not yet ingested
- Civics
- —
Market trends
- HPI YoY
- ▼ -102.93%
- Current HPI
- 148.5749
- Rent YoY
- ▲ 1.42%
- Metro
- Dallas-Fort Worth-Arlington, TX
- State GDP YoY
- ▲ 3.95%
- F500 in state
- 110
Industry mix (Fortune 500 HQ in TX)
| Industry | F500 HQs | Revenue |
|---|---|---|
| Energy | 16 | $1,198B |
|
||
| Technology | 5 | $198B |
|
||
| Engineering / Construction | 4 | $72B |
|
||
| Energy Services | 3 | $60B |
|
||
| Utilities | 3 | $41B |
|
||
| Healthcare | 2 | $330B |
|
||
Cash-flow waterfall
monthlySold comps — $/sqft
last 12 mo · ≤1 miLoading sold comps…