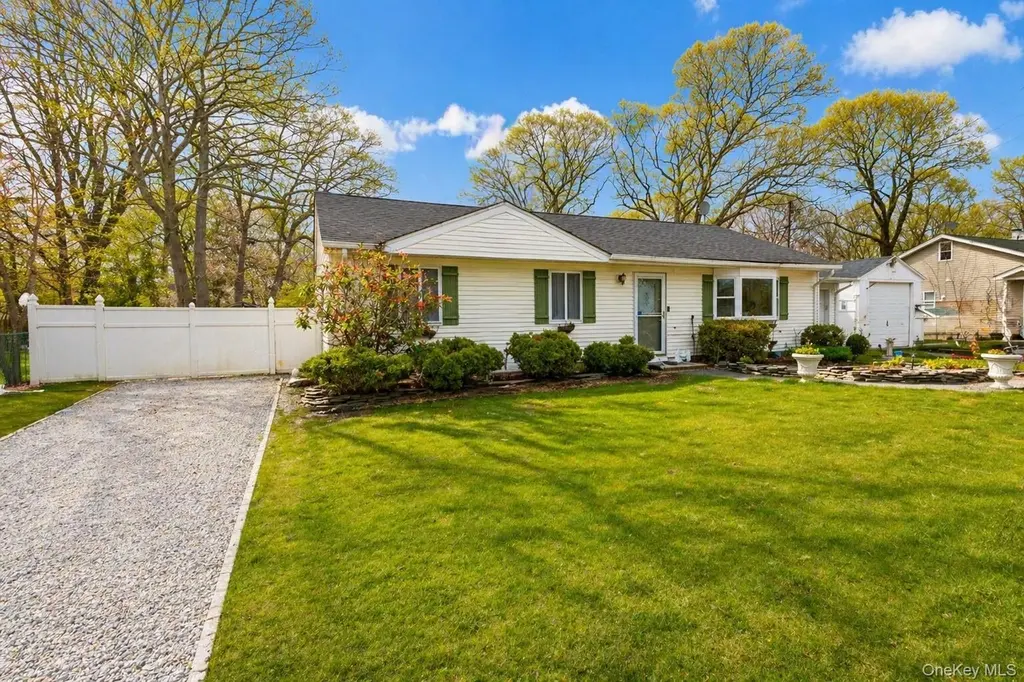
11 Seaford Rd · Mastic Beach, NY
Flood risk 1/10 · Minimal
- FEMA flood zone
- X (unshaded)
- Chance of flooding over 30 yrs
- 0.0%
- Est. flood insurance / yr
- $473 – $860
Fire risk 1/10 · Minimal
- Est. fire insurance / yr
- $691 – $1,283
Heat risk 4/10 · Minor
- Hot days now (above 92°F)
- 7 days/yr
- Hot days in 30 yrs
- 20 days/yr
Wind risk 8/10 · Major
- Chance of severe wind over 30 yrs
- 80.0%
Air-quality risk 4/10 · Minor
- Unhealthy air days now
- 3 days/yr
- Unhealthy air days in 30 yrs
- 5 days/yr
Risk factors via First Street. Map © Google.
Why this score? — see what drove the C grade
The composite is a weighted blend of 9 inputs, each scored 0–100. Each bar is that input's sub-score; the figure is the points it added to the 100-point composite (weight × sub-score).
- Cash flow +15.0/30.0
- ARV discount +12.8/15.0
- Appreciation +10.0/10.0
- Schools +4.7/10.0
- DSCR +4.6/10.0
- 1% rule +3.9/10.0
- Livability +3.1/5.0
- Rent growth +2.5/5.0
- Condition / age +2.5/5.0
$449,999
🖨 Deal sheet 📄 Offer letter ✓ Due diligence
Listing remarks MLS
Opportunity knocks in Mastic Beach! This 3-bedroom, 2-bath ranch offers easy one-level living and incredible bonus space. Featuring an attached garage for added convenience plus a rare 2-car detached garage with endless potential ideal for additional vehicles, a workshop, storage, home gym, studio, or future creative space. With endless possibilities to customize and make it your own, this home combines comfort, functionality, and flexibility. A must-see!
Key facts
- Attached garage
- One-level living
- Bonus space
Tags
Neighborhood map
What this means for you Summary
Snapshot
- This is a 3-bed/2.0-bath single-family listed at $450k.
Deal economics
- At list price, monthly cash flow is $139 ($2k/yr) — positive.
- The deal already cash-flows at list — no discount required.
- To meet the 1% rule (rent ≥ 1% of price), the offer needs to be $401k (10.9% below list).
- Recommended offer: $401k (10.9% below list) — sets the bar for 1% rule.
- Cap rate 6.7% vs local median 4.7% in Mastic Beach — top-decile yield for the area; either an underpriced asset or a hidden risk that comps aren't pricing in. Stress-test before assuming the spread holds.
Location & tenants
- Location reads 61/100 on livability (#936 in NY) — a middle-class / working-renter tenant base. Strengths: employment A+, housing A+; Watch: schools D, crime D, amenities F.
- William Floyd Union Free School District (suburban): math 48% / reading 57% proficiency, ranked #309 of 590 in NY (top 52%) — acceptable for families but not a draw, mixed tenant base, ~2y average lease.
- Market conditions: 133 active listings in the ZIP; 6 comparable units currently listed for rent nearby; rentals leasing fast (median 1d on market — plan ~1-2 weeks tenant-placement turnaround); 1,366 units permitted in Suffolk County in 2024 (216 in 5+ unit buildings).
Forward outlook
- In year one you build about $48k of equity ($3k loan paydown + $45k appreciation (10.0% local appreciation)).
- Suffolk County population projected to shrink 5% by 2050 — rents likely to lag national; underwrite the cash flow, not the appreciation.
- At projected returns (10.0% appreciation + 3.0% rent growth), your $126k cash investment doubles in ~3 years — after that, you're playing with house money.
- By year 2, paydown + projected appreciation supports a ~$77k cash-out refi (75% LTV) — recoverable capital for the next deal without selling this one.
Negotiation context
- It's been on market 73 days — a 6% lower offer ($423k) is reasonable based on typical stale-listing flexibility.
- Current owner paid $135k; list at $450k implies a 233% gain — meaningful room to come down on a strong offer.
Risks & watch-outs
- Climate carrying-cost: severe wind risk, 80% chance of damaging wind over 30y — expect insurance premiums to compound above CPI over the hold.
Questions for the listing agent
- It's been on market 73 days. Have you received any prior offers? Is the seller open to a 11% concession, seller financing, or rate buy-down credit?
- Built in 1972 — when were the roof, HVAC, electrical panel, plumbing, and water heater last replaced?
- Why hasn't it sold? Are there any deal-killer items the seller is aware of (foundation, flood, title, zoning, code violations)?
- Is there a deadline driving the sale (1031 exchange, divorce, estate, relocation)? That informs how much negotiation room exists.
- Schools are D-rated, which usually means shorter tenancies and higher turnover. Who's the typical renter profile here, and what's been the actual vacancy rate?
- Crime grade is D in this area — have there been break-ins, vandalism, or insurance claims at this property in the last 3 years? What carrier currently insures it and at what premium?
- What's the average days-on-market for RENTAL listings here right now (not sales)? A rising rental-DOM trend means longer vacancies and softer asking-rent achievability than the comps imply.
- What's the recent tenant-quality profile in this submarket — average credit score on applications, eviction rate, late-payment / NSF rate, and stable-employment percentage? A property-management company in the area should have these aggregated.
- How much new for-sale + rental construction is in the pipeline within 1–3 miles? Heavy new supply typically softens prices + rents 12–24 months out; constrained supply supports both.
Investment metrics
- 1% rule
- 0.89% ✗
- Cap rate
- 6.66%
- Cash-on-cash
- 1.32%
- DSCR
- 1.06
- GRM
- 9.4
CMA / ARV
- ARV (median comp)
- $510,522
- List price
- $449,999
- Delta
- -11.86%
- Verdict
- UNDERPRICED
- Comps
- 20 within 1.0 mi
Show comp detail 12 sales within ~0.75 mi
| Address | Dist | Beds/Ba | Sqft | Sold | Price | $/sf | Match |
|---|---|---|---|---|---|---|---|
| 193 Laurelton Dr | 0.15mi | 3/2.0 | 1,349 (-0%) | 5mo | $465,000 | $345 | 89 |
| 184 Bayview Dr | 0.24mi | 3/2.0 | 1,302 (-4%) | 5mo | $280,000 | $215 | 79 |
| 514 Neighborhood Rd | 0.54mi | 3/2.0 | 1,400 (+4%) | 2mo | $549,990 | $393 | 67 |
| 76 Gooseberry Rd | 0.48mi | 3/1.5 | 1,286 (-5%) | 6mo | $400,000 | $311 | 62 |
| 27 Pinewood Dr | 0.49mi | 3/1.5 | 1,250 (-7%) | 1mo | $598,000 | $478 | 62 |
| 6 Victoria Pl | 0.33mi | 4/2.0 (+1) | 1,470 (+9%) | 4mo | $470,000 | $320 | 62 |
| 74 Alcolade Dr E | 0.64mi | 3/1.5 | 1,440 (+7%) | 2mo | $431,000 | $299 | 55 |
| 38 Barclay Rd | 0.67mi | 2/1.0 (-1) | 1,370 (+2%) | 6mo | $450,000 | $328 | 52 |
| 61 Arpage Dr E | 0.67mi | 3/1.5 | 1,500 (+11%) | 2mo | $580,000 | $387 | 47 |
| 277 Commack Rd | 0.51mi | 4/1.0 (+1) | 1,200 (-11%) | 5mo | $450,000 | $375 | 44 |
| 17 Bellport Rd | 0.73mi | 3/1.0 | 1,224 (-9%) | 4mo | $465,000 | $380 | 43 |
| 166 Neighborhood Rd | 0.70mi | 2/1.5 (-1) | 1,176 (-13%) | 3mo | $463,500 | $394 | 36 |
Match score weights: distance 35% · size 25% · config 20% · recency 20%. Top-matched comps best support the ARV.
Projected returns pro-forma
10.0% appreciation · 3.0% rent growth · sell at horizon
- IRR
- 25.2%
- Equity multiple
- 3.02×
- Total profit
- $253,923
- Equity at exit
- $405,395
- IRR
- 22.2%
- Equity multiple
- 6.88×
- Total profit
- $740,836
- Equity at exit
- $874,249
Cash invested: $126,000 (down + closing). Projections, not guarantees.
Landlord ↔ Tenant lean methodology
- Overall (STATE)
- 15 Strongly Tenant-Friendly
- State New York
- 15 Strongly Tenant-Friendly · D+10
- County
- — inherits STATE
- City
- — inherits STATE
ZIP-level market 11951
- Home prices YoY
- 4.3%
- Active inventory
- 133
- Price-to-rent
- 9.4×
Monthly cashflow live
- Estimated rent
- $4,009 high interval (Pro) →
- Mortgage (P&I)
- −$2,360
- Tax from tax record
- −$481 /mo · $5,769/yr
- Insurance
- −$187
- HOA
- −$0
- Vacancy / Maint / Mgmt
- −$842
- Net cashflow
- $139
Break-even live
UW: 25.0% down · 7.5% · 30yr · 1.5% tax · 5.0% vac · 8.0% maint · 8.0% mgmt
Financing live
Cash to close
- Down payment
- $112,500
- Closing costs
- $13,500
- Reserves months
- —
- Total cash needed
- —
Loan-product check · same deal, 3 products live
Conventional
25% down · 7.5% · 30yr
- Down + closing
- —
- Monthly P&I
- —
- Monthly cashflow
- —
- DSCR
- —
- Eligible?
- —
Personal DTI + credit; lowest rate.
DSCR
20% down · 8.5% · 30yr
- Down + closing
- —
- Monthly P&I
- —
- Monthly cashflow
- —
- DSCR
- —
- Eligible?
- —
No personal income docs; deal must DSCR.
Hard money
10% down · 12.0% · 12mo
- Down + closing
- —
- Monthly P&I
- —
- Monthly cashflow
- —
- DSCR
- —
- Eligible?
- —
Short-term bridge; refi at stabilization.
Rent comps 6 comps
| Address | Beds | Baths | Sqft | Rent | $/sqft | DOM | Units | Dist |
|---|---|---|---|---|---|---|---|---|
| 165 Lynbrook Dr Mastic Beach, NY | 3.0 | 2.0 | 1520 | $4,000 | $2.63 | 1d | 1 | 0.17mi |
| 126 Flower Rd Shirley, NY | 4.0 | 1.0 | 1756 | $4,100 | $2.33 | 1d | 1 | 0.51mi |
| 6 Fairview Dr Shirley, NY | 4.0 | 2.0 | 1302 | $4,299 | $3.30 | 2d | 1 | 0.75mi |
| 192 Cypress Dr Mastic Beach, NY | 4.0 | 2.0 | 1404 | $3,800 | $2.71 | 43d | 1 | 1.03mi |
| 44 Pine Tree Dr Shirley, NY | 4.0 | 2.0 | 1600 | $4,200 | $2.62 | 1d | 1 | 1.25mi |
| 149 Washington Dr Mastic Beach, NY | 3.0 | 1.0 | 1152 | $3,400 | $2.95 | 1d | 1 | 1.29mi |
Listing history 16 events
-
2026-06-18days on market $449,999 Active 73 DOM
-
2026-06-17days on market $449,999 Active 72 DOM
-
2026-06-16days on market $449,999 Active 71 DOM
-
2026-06-15days on market $449,999 Active 70 DOM
-
2026-06-13days on market $449,999 Active 68 DOM
-
2026-06-13days on market $449,999 Active 67 DOM
-
2026-06-09days on market $449,999 Active 64 DOM
-
2026-06-08days on market $449,999 Active 63 DOM
-
2026-06-07days on market $449,999 Active 62 DOM
-
2026-06-04days on market $449,999 Active 59 DOM
-
2026-06-03days on market $449,999 Active 58 DOM
-
2026-06-02days on market $449,999 Active 57 DOM
-
2026-06-01days on market $449,999 Active 56 DOM
-
2026-05-31days on market $449,999 Active 55 DOM
-
2026-04-06$449,999 Active 459-char remark
Show marketing remark (459 chars)
Opportunity knocks in Mastic Beach! This 3-bedroom, 2-bath ranch offers easy one-level living and incredible bonus space. Featuring an attached garage for added convenience plus a rare 2-car detached garage with endless potential ideal for additional vehicles, a workshop, storage, home gym, studio, or future creative space. With endless possibilities to customize and make it your own, this home combines comfort, functionality, and flexibility. A must-see!
-
2002-01-14soldstatus $135,000
ⓘ Source: listings_history table (triggers on properties + properties_extension) + one-shot
backfill from property_details.listing_events for pre-trigger history.
Tax reassessment forecast NY · Partial reset (capped growth)
- Current annual tax
- $5,769 · $481/mo
- Projected year-2 tax
- $6,687 · $557/mo
- Expected delta
- +$918/yr (+$77/mo · 15.9%)
ⓘ Screening estimate from a state-policy table — verify with the county assessor before closing.
Climate risk First Street
- Flood 1/10 Low FEMA zone X (unshaded) · 0% chance over 30 yrs
- Wildfire 1/10 Low
- Heat 4/10 Moderate 7 d/yr ≥92°F today · 20 d/yr by 30 yrs out
- Wind 8/10 Severe 80% chance of damaging wind over 30 yrs
- Air quality 4/10 Moderate 3 unhealthy d/yr today · 5 by 30 yrs out
Nearby sold comps map
Loading sold comps map…
Walkable amenities ~0.75 mi
Loading nearby amenities…
Taxation est. · year 1
- Rental income
- $48,102
- − Mortgage interest
- −$25,207
- − Property taxes
- −$5,769
- − Insurance
- −$2,250
- − Repairs & maintenance
- −$3,848
- − Management
- −$3,848
- − Depreciation
- −$13,091
- Taxable loss
- −$5,911
- Est. tax savings @ 24.0%
- +$1,419
- After-tax cash flow
- $3,082/yr
For passive investors: Depreciation is non-cash, so a rental often shows a tax loss while cash-flowing — sheltering income. Rental losses are passive: they offset passive income freely, and up to $25,000/yr can offset ordinary (W-2) income if you actively participate and your MAGI is under $100k (phasing out to $0 by $150k); unused losses carry forward. On sale, claimed depreciation is recaptured at up to 25%, and gains may owe capital-gains tax (a 1031 exchange can defer both). Figures are a year-1 estimate at your 24.0% rate — not tax advice; consult a CPA.
Schools (NCES district)
- District
- William Floyd Union Free School District
- NCES district ID
- 3618690
- Math proficiency
- 48% ▲ 3.00%
- Reading proficiency
- 57% ▲ 11.00%
- Median HH income
- $70,564
- Composite
- 46.79/100
- National rank
- #2383
- State rank
- #309 of 590 in NY
Livability — Mastic Beach
- Score
- 61/100
- State rank
- #936
- US rank
- #18216
Category grades
Schools grade is shown separately in the Schools card above.
Census & demographics
- Census place
- Mastic Beach, NY
- City population
- 15,830
- Population (ZIP)
- 15,830
Population outlook (Suffolk County) Hauer SSP2
- Today (2025)
- 1,505,262 people
- By 2030
- 1,498,318 · -0.5%
- By 2040
- 1,471,101 · -2.3%
- By 2050
- 1,424,848 · -5.3%
- By 2075
- 1,337,157 · -11.2%
- By 2100
- 1,217,720 · -19.1%
Race, ethnicity, and origin ACS 2023
- Neighborhood character
- Predominantly White (68%)
- Race & ethnicity
- White 68% Hispanic / Latino 17% Two or more races 9% Black 6% Asian 2%
- Hispanic origin (detail)
- Mexican 1% Puerto Rican 6% Cuban 2%
- Common ancestry
- Lithuanian 3% Romanian 2% Italian 2%
- Foreign-born
- 7% · Canada, Vietnam
- Languages at home
- 84% English-only · Spanish 10% Other Indo-European 3% Chinese 1%
Political lean MEDSL · Suffolk
- 2024 margin
- Lean R (+10.0) · D 45.0% · R 55.0%
- 2008→2024 swing
- -16.0pp toward R · 2008: 6.0pp · 2024: -10.0pp
- All cycles
- 2024: R+10.0 2020: R+0.0 2016: R+8.2 2012: D+2.9 2008: D+6.0
Not yet ingested
- Civics
- —
Market trends
- HPI YoY
- ▲ 34.46%
- Current HPI
- 829.86
- Rent YoY
- —
- Metro
- —
- State GDP YoY
- ▲ 2.60%
- F500 in state
- 92
Industry mix (Fortune 500 HQ in NY)
| Industry | F500 HQs | Revenue |
|---|---|---|
| Financial Services | 10 | $950B |
|
||
| Consumer Goods | 9 | $162B |
|
||
| Insurance | 4 | $225B |
|
||
| Telecommunications | 2 | $144B |
|
||
| Pharmaceuticals | 2 | $112B |
|
||
| Media / Entertainment | 2 | $69B |
|
||
Price history
+233.3% since first listed2 events — show timeline
- 2026-04-06 Listed $449,999 OneKey® MLS as Distributed by MLS Grid
- 2002-01-14 Sold (Public Records) $135,000 Public Records
Property tax history
+2.1%/yrLatest (2025): $5,769 · +0.0% YoY. Source: county tax records.
Cash-flow waterfall
monthlySold comps — $/sqft
last 12 mo · ≤1 miLoading sold comps…