2338 Wren Meadow Rd · Pecan Grove, TX
Flood risk 7/10 · Major
- FEMA flood zone
- X
- Chance of flooding over 30 yrs
- 0.99%
- Est. flood insurance / yr
- $507 – $1,088
Fire risk 1/10 · Minimal
- Est. fire insurance / yr
- $1,222 – $2,270
Heat risk 9/10 · Severe
- Hot days now (above 110°F)
- 7 days/yr
- Hot days in 30 yrs
- 23 days/yr
Wind risk 9/10 · Severe
- Chance of severe wind over 30 yrs
- 99.0%
Air-quality risk 2/10 · Minimal
- Unhealthy air days now
- 1 days/yr
- Unhealthy air days in 30 yrs
- 2 days/yr
Risk factors via First Street. Map © Google.
Why this score? — see what drove the B grade
The composite is a weighted blend of 9 inputs, each scored 0–100. Each bar is that input's sub-score; the figure is the points it added to the 100-point composite (weight × sub-score).
- Cash flow +30.0/30.0
- 1% rule +10.0/10.0
- DSCR +10.0/10.0
- ARV discount +7.5/15.0
- Schools +4.6/10.0
- Livability +3.6/5.0
- Condition / age +2.5/5.0
- Rent growth +2.1/5.0
- Appreciation +0.0/10.0
$200,000
🖨 Deal sheet 📄 Offer letter ✓ Due diligence
Listing remarks
Great opportunity!! RE DO Special! Needs work. Low tax rate! Very low HOA! Kitchen & family room have tile flooring, formal living & dining are carpeted. All bedroom are up. ABSOLUTELY NO SHOWINGS UNTIL MONDAY 6/15
Key facts
- 8,036 sq ft lot
- 2 garage spots
- Community pool
Property features AI
Finance
- Other: Association-maintained pool
- HOA & community: Community association: The Grove CIA; Annual association fee of $195 (covers clubhouse and recreation facilities); Community amenities include clubhouse, fitness center, pool, playground, tennis courts, sport court, golf course, picnic area, and trails; Curbs in community
Exterior
- Parking: 2-car garage; Detached garage; Driveway
- Security: Smoke detectors
- Utilities: Public water; Public sewer
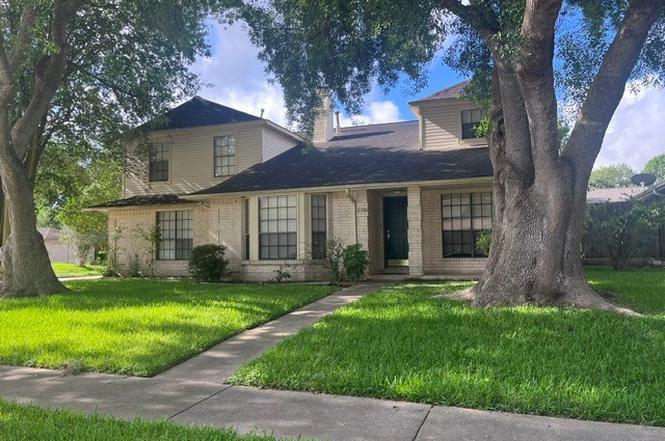
- Home design: Residential property; Full ownership; Slab foundation; Built in 1982
- Construction: Brick construction; Composition roof
- Exterior features: Private yard; Pond on lot; Subdivision setting; Concrete road surface
Interior
- Kitchen: Dishwasher; Electric oven; Electric range; Garbage disposal
- Bedrooms: 4 possible bedrooms
- Flooring: Carpet; Tile
- Bathrooms: 3 full bathrooms
- Heating & cooling: Central heating (gas); Central air conditioning
- Interior features: Breakfast bar; High ceilings; Laminate countertops; Soaking tub; Separate shower; Ceiling fans; Gas and wood-burning fireplace (1)
- Laundry & utility: Washer hookup; Electric dryer hookup; Gas dryer hookup
Neighborhood map
What this means for you Summary
Snapshot
- This is a 4-bed/3.0-bath single-family listed at $200k.
Deal economics
- At list price, monthly cash flow is $1k ($14k/yr) — positive.
- The deal already cash-flows at list — no discount required.
- Meets the 1% rule at list price ($4k rent vs $200k).
- Cap rate 13.8% vs local median 2.1% in Pecan Grove — top-decile yield for the area; either an underpriced asset or a hidden risk that comps aren't pricing in. Stress-test before assuming the spread holds.
Location & tenants
- Location reads 72/100 on livability (#256 in TX) — a middle-class / working-renter tenant base. Strengths: employment A+, housing A+, crime A; Watch: amenities F, commute F, health & safety F.
- Lamar CISD (suburban): math 50% / reading 53% proficiency, ranked #116 of 826 in TX (top 14%) — acceptable for families but not a draw, mixed tenant base, ~2y average lease.
- Zoned schools: Foster H S (math 64% / reading 74%, grade B, #141 of 1,632 statewide, top 9%, 2,388 students, 34% FRL).
- Zoned-school proficiency averages 69% at this address vs 52% district-wide (+18 pts) — the actual schools serving this property are materially stronger than the Lamar CISD average implies; a family-tenant draw the district grade alone would hide.
- Market conditions: Rents soft (-1.6%/yr); 1222 active listings in the ZIP; 3 comparable units currently listed for rent nearby; rentals at typical pace (median 19d on market — plan ~3-4 weeks tenant-placement turnaround); high-income renter base; 12,093 units permitted in Fort Bend County in 2024 (815 in 5+ unit buildings).
- This rent runs 32% of the median local income ($142k/yr) — at the standard rent-burdened threshold; future hikes will face affordability resistance.
Forward outlook
- Local home prices are declining (-3.0%/yr); year-one equity from $1k of loan paydown is wiped out by about $6k of value loss. Plan a longer hold.
- Fort Bend County population projected at +75% by 2050 — long-run rental-demand tailwind backs the buy-and-hold thesis.
- At projected returns (-3.0% appreciation + 0.0% rent growth), your $56k cash investment doubles in ~6 years — after that, you're playing with house money.
Negotiation context
- Only 7 days on market — expect competitive offers; lowballing is unlikely to land.
- 4 sale attempts since 25y ago with the ask held roughly flat each time — persistent listings suggest the price (not the market) is what's stuck; bring a comps-based counter.
Risks & watch-outs
- Watch-outs: property tax is 3.4% of price; flood insurance adds $66/mo.
- Climate carrying-cost: major flood risk; severe wind risk, 99% chance of damaging wind over 30y; extreme-heat days projected 7→23/yr by 2055 (HVAC capex compounding) — expect insurance premiums to compound above CPI over the hold.
Questions for the listing agent
- Property tax is high relative to price — has the assessment been appealed recently, and will the sale trigger a re-assessment?
- What's the actual annual flood-insurance premium (NFIP or private), and is the property in a SFHA with mandatory coverage?
- What does the HOA fee cover, when was the last increase, and are there any pending special assessments or reserve-fund shortfalls?
- Is there a deadline driving the sale (1031 exchange, divorce, estate, relocation)? That informs how much negotiation room exists.
- What's the average days-on-market for RENTAL listings here right now (not sales)? A rising rental-DOM trend means longer vacancies and softer asking-rent achievability than the comps imply.
- What's the recent tenant-quality profile in this submarket — average credit score on applications, eviction rate, late-payment / NSF rate, and stable-employment percentage? A property-management company in the area should have these aggregated.
- How much new for-sale + rental construction is in the pipeline within 1–3 miles? Heavy new supply typically softens prices + rents 12–24 months out; constrained supply supports both.
Investment metrics
- 1% rule
- 1.88% ✓
- Cap rate
- 13.77%
- Cash-on-cash
- 26.71%
- DSCR
- 2.19
- GRM
- 4.4
CMA / ARV
- ARV (on-the-fly)
- $536,665
- Comps found
- 12
Show comp detail 12 sales within ~0.75 mi
| Address | Dist | Beds/Ba | Sqft | Sold | Price | $/sf | Match |
|---|---|---|---|---|---|---|---|
| 1611 Deerfield Ct | 0.34mi | 4/2.5 | 2,750 (-7%) | 2mo | $500,000 | $182 | 68 |
| 1627 S Hearthside Dr | 0.62mi | 5/3.0 (+1) | 2,990 (+1%) | 2mo | $494,900 | $166 | 63 |
| 1207 Deerfield Rd | 0.39mi | 4/2.5 | 2,554 (-14%) | 1mo | $429,000 | $168 | 56 |
| 2015 Woodland Dr | 0.71mi | 4/3.5 | 3,072 (+4%) | 4mo | $350,000 | $114 | 56 |
| 1614 Morton League Rd | 0.48mi | 4/4.0 | 3,172 (+7%) | 8mo | $399,999 | $126 | 55 |
| 1607 S Hearthside Dr | 0.60mi | 4/3.5 | 3,130 (+6%) | 9mo | $485,000 | $155 | 53 |
| 1506 Majors Dr | 0.43mi | 3/3.0 (-1) | 2,583 (-13%) | 5mo | $490,000 | $190 | 49 |
| 1519 Morton League Rd | 0.42mi | 4/2.5 | 2,560 (-14%) | 8mo | $345,000 | $135 | 49 |
| 1123 Woodland Ct | 0.51mi | 4/2.5 | 2,597 (-12%) | 7mo | $490,000 | $189 | 47 |
| 1111 Hearth Ave | 0.74mi | 4/3.0 | 2,727 (-8%) | 8mo | $584,121 | $214 | 45 |
| 1131 Hearth Ave | 0.73mi | 4/4.5 | 2,815 (-5%) | 8mo | $510,000 | $181 | 45 |
| 1123 Hearth Ave | 0.73mi | 5/4.5 (+1) | 2,849 (-4%) | 8mo | $535,000 | $188 | 42 |
Match score weights: distance 35% · size 25% · config 20% · recency 20%. Top-matched comps best support the ARV.
Projected returns pro-forma
-3.0% appreciation · 0.0% rent growth · sell at horizon
- IRR
- 14.9%
- Equity multiple
- 1.57×
- Total profit
- $32,043
- Equity at exit
- $29,821
- IRR
- 20.9%
- Equity multiple
- 2.49×
- Total profit
- $83,372
- Equity at exit
- $17,292
Cash invested: $56,000 (down + closing). Projections, not guarantees.
Landlord ↔ Tenant lean methodology
- Overall (STATE)
- 87 Strongly Landlord-Friendly
- State Texas
- 87 Strongly Landlord-Friendly · R+5
- County
- — inherits STATE
- City
- — inherits STATE
ZIP-level market 77406
- Home prices YoY
- -26.2%
- Rents YoY
- -1.6%
- Active inventory
- 1222
- Price-to-rent
- 4.4×
Monthly cashflow live
- Estimated rent
- $3,757 medium interval (Pro) →
- Mortgage (P&I)
- −$1,049
- Tax from tax record
- −$573 /mo · $6,879/yr
- Insurance
- −$83
- Flood insurance flood zone
- −$66 /mo · $798/yr
- HOA
- −$16
- Vacancy / Maint / Mgmt
- −$789
- Net cashflow
- $1,180
Break-even live
UW: 25.0% down · 7.5% · 30yr · 1.5% tax · 5.0% vac · 8.0% maint · 8.0% mgmt
Financing live
Cash to close
- Down payment
- $50,000
- Closing costs
- $6,000
- Reserves months
- —
- Total cash needed
- —
Loan-product check · same deal, 3 products live
Conventional
25% down · 7.5% · 30yr
- Down + closing
- —
- Monthly P&I
- —
- Monthly cashflow
- —
- DSCR
- —
- Eligible?
- —
Personal DTI + credit; lowest rate.
DSCR
20% down · 8.5% · 30yr
- Down + closing
- —
- Monthly P&I
- —
- Monthly cashflow
- —
- DSCR
- —
- Eligible?
- —
No personal income docs; deal must DSCR.
Hard money
10% down · 12.0% · 12mo
- Down + closing
- —
- Monthly P&I
- —
- Monthly cashflow
- —
- DSCR
- —
- Eligible?
- —
Short-term bridge; refi at stabilization.
Rent comps 3 comps
| Address | Beds | Baths | Sqft | Rent | $/sqft | DOM | Units | Dist |
|---|---|---|---|---|---|---|---|---|
| 707 Land Grant Dr Richmond, TX | 4.0 | 2.0 | 1994 | $2,595 | $1.30 | 44d | 1 | 0.72mi |
| 331 Old Silo St Richmond, TX | 4.0 | 3.5 | 3568 | $5,500 | $1.54 | 19d | 1 | 1.33mi |
| 331 Old Silo St Richmond, TX | 4.0 | 3.5 | 3568 | $5,500 | $1.54 | 4d | 1 | 1.33mi |
HOA detail
- Monthly dues
- $16 · $192/yr
Listing history 7 events
-
2026-06-18status $200,000 Pending 7 DOM
-
2026-06-18days on market $200,000 Active 7 DOM
-
2026-06-17days on market $200,000 Active 6 DOM
-
2026-06-16days on market $200,000 Active 5 DOM
-
2026-06-15days on market $200,000 Active 4 DOM
-
2026-06-13remarks 218-char remark
-
2026-06-13$200,000 Active 2 DOM
ⓘ Source: listings_history table (triggers on properties + properties_extension) + one-shot
backfill from property_details.listing_events for pre-trigger history.
Tax reassessment forecast TX · Resets to sale price
- Current annual tax
- $6,879 · $573/mo
- Projected year-2 tax
- $6,879 · $573/mo
- Expected delta
- $0/yr ($0/mo · 0.0%)
ⓘ Screening estimate from a state-policy table — verify with the county assessor before closing.
Climate risk First Street
- Flood 7/10 Severe FEMA zone X · 99% chance over 30 yrs
- Wildfire 1/10 Low
- Heat 9/10 Extreme 7 d/yr ≥110°F today · 23 d/yr by 30 yrs out
- Wind 9/10 Extreme 99% chance of damaging wind over 30 yrs
- Air quality 2/10 Low 1 unhealthy d/yr today · 2 by 30 yrs out
Nearby sold comps map
Loading sold comps map…
Walkable amenities ~0.75 mi
Loading nearby amenities…
Taxation est. · year 1
- Rental income
- $45,082
- − Mortgage interest
- −$11,203
- − Property taxes
- −$6,879
- − Insurance
- −$1,798
- − Repairs & maintenance
- −$3,607
- − Management
- −$3,607
- − HOA
- −$192
- − Depreciation
- −$5,818
- Taxable income
- $11,979
- Est. tax owed @ 24.0%
- −$2,875
- After-tax cash flow
- $11,285/yr
For passive investors: Depreciation is non-cash, so a rental often shows a tax loss while cash-flowing — sheltering income. Rental losses are passive: they offset passive income freely, and up to $25,000/yr can offset ordinary (W-2) income if you actively participate and your MAGI is under $100k (phasing out to $0 by $150k); unused losses carry forward. On sale, claimed depreciation is recaptured at up to 25%, and gains may owe capital-gains tax (a 1031 exchange can defer both). Figures are a year-1 estimate at your 24.0% rate — not tax advice; consult a CPA.
Schools (NCES district)
- District
- Lamar CISD
- NCES district ID
- 4826580
- Math proficiency
- 50% ▼ -12.00%
- Reading proficiency
- 53% ▼ -4.00%
- Median HH income
- $75,213
- Composite
- 46.43/100
- National rank
- #2452
- State rank
- #116 of 826 in TX
Livability — Pecan Grove
- Score
- 72/100
- State rank
- #256
- US rank
- #6017
Category grades
Schools grade is shown separately in the Schools card above.
Census & demographics
- Census place
- Pecan Grove, TX
- County
- Fort Bend County · 836,777 people
- Metro
- Houston-The Woodlands-Sugar Land, TX
- Population (ZIP)
- 69,918
- Household income
- $141,869
- Rent vs Own
- Severe rent burden
- 575.0
Population outlook (Fort Bend County) Hauer SSP2
- Today (2025)
- 1,004,526 people
- By 2030
- 1,153,104 · +14.8%
- By 2040
- 1,453,718 · +44.7%
- By 2050
- 1,753,781 · +74.6%
- By 2075
- 2,455,772 · +144.5%
- By 2100
- 2,930,528 · +191.7%
Race, ethnicity, and origin ACS 2023
- Neighborhood character
- Highly diverse neighborhood (Simpson 0.72)
- Race & ethnicity
- White 43% Hispanic / Latino 26% Two or more races 15% Black 14% Asian 12%
- Hispanic origin (detail)
- Mexican 18% Puerto Rican 1%
- Common ancestry
- Lithuanian 2% Romanian 1% Iranian 1%
- Foreign-born
- 17% · Canada, Vietnam, China
- Languages at home
- 73% English-only · Spanish 14% Other Indo-European 3% Vietnamese 2%
Political lean MEDSL · Fort Bend
- 2024 margin
- Toss-up / Even · D 49.5% · R 47.9% · Other 2.6%
- 2008→2024 swing
- +4.0pp toward D · 2008: -2.4pp · 2024: 1.6pp
- All cycles
- 2024: D+1.6 2020: D+10.6 2016: D+6.6 2012: R+6.8 2008: R+2.4
Not yet ingested
- Civics
- —
Market trends
- HPI YoY
- ▼ -79.18%
- Current HPI
- 222.9525
- Rent YoY
- ▼ -1.61%
- Metro
- Houston-The Woodlands-Sugar Land, TX
- State GDP YoY
- ▲ 3.95%
- F500 in state
- 110
Industry mix (Fortune 500 HQ in TX)
| Industry | F500 HQs | Revenue |
|---|---|---|
| Energy | 16 | $1,198B |
|
||
| Technology | 5 | $198B |
|
||
| Engineering / Construction | 4 | $72B |
|
||
| Energy Services | 3 | $60B |
|
||
| Utilities | 3 | $41B |
|
||
| Healthcare | 2 | $330B |
|
||
Price history
+40.4% since first listed8 events — show timeline
- 2026-06-11 Listed $200,000 HARMLS
- 2003-01-12 Listing Removed — HARMLS
- 2002-03-31 Listing Removed — HARMLS
- 2002-02-12 Listed $138,500 HARMLS
- 2001-12-02 Listing Removed — HARMLS
- 2001-12-01 Listed $142,500 HARMLS
- 2001-07-14 Listed $142,500 HARMLS
- 1995-11-29 Sold (Public Records) — Public Records
Property tax history
+4.3%/yrLatest (2025): $6,879 · -3.5% YoY. Source: county tax records.
Cash-flow waterfall
monthlySold comps — $/sqft
last 12 mo · ≤1 miLoading sold comps…