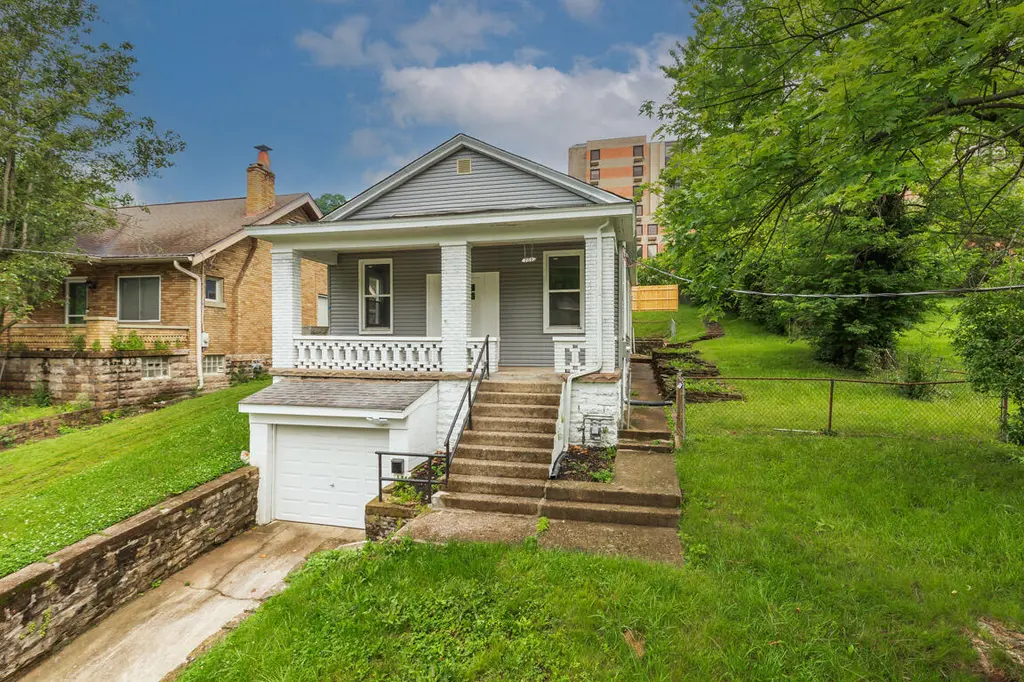
768 Highland Ave · Covington, KY
Flood risk 9/10 · Severe
- FEMA flood zone
- X (unshaded)
- Chance of flooding over 30 yrs
- 0.99%
- Est. flood insurance / yr
- $507 – $1,088
Fire risk 1/10 · Minimal
- Est. fire insurance / yr
- $839 – $1,559
Heat risk 5/10 · Moderate
- Hot days now (above 102°F)
- 7 days/yr
- Hot days in 30 yrs
- 19 days/yr
Wind risk 2/10 · Minimal
- Chance of severe wind over 30 yrs
- 1.0%
Air-quality risk 3/10 · Minor
- Unhealthy air days now
- 2 days/yr
- Unhealthy air days in 30 yrs
- 3 days/yr
Risk factors via First Street. Map © Google.
Why this score? — see what drove the D+ grade
The composite is a weighted blend of 9 inputs, each scored 0–100. Each bar is that input's sub-score; the figure is the points it added to the 100-point composite (weight × sub-score).
- Cash flow +16.5/30.0
- ARV discount +13.6/15.0
- DSCR +5.1/10.0
- Livability +4.3/5.0
- 1% rule +3.2/10.0
- Rent growth +2.9/5.0
- Condition / age +2.5/5.0
- Schools +1.5/10.0
- Appreciation +0.0/10.0
$239,000
🖨 Deal sheet 📄 Offer letter ✓ Due diligence
Listing remarks
Location to downtown, shopping, and the freeways is everything when searching for the perfect home, and this one has it all. With three bedrooms, two baths, and nothing to do but bring your suitcases, this home is truly move in ready. Not only does it feature new roof, siding, and windows, but the flooring, HVAC, fresh paint, and doors have also all been replaced. The kitchen is beautifully updated with gorgeous quartz countertops, a stainless steel undermount sink with pull down faucet, crisp white cabinetry, and stainless steel appliances that shine. You will love the open feel of the living room, where soaring ceilings and a beautiful fireplace add character and charm. It makes the space
Key facts
- Fresh paint
- Oversized kitchen
- Full basement
Tags
Property features AI
Exterior
- Parking: Driveway; Garage (1-car); On-street parking; Total 1 parking space
- Utilities: Public water; Public sewer
- Home design: Single-family house; One level; Existing structure; Has a view
- Construction: Brick construction; Block foundation
- Exterior features: Covered porch; Private yard; Chain link fencing; Vinyl window frames; Shingle roof; Sloped lot; City street frontage
Interior
- Kitchen: Stainless steel appliances; Electric cooktop; Electric oven; Microwave; Eat-in kitchen
- Bedrooms: Primary bedroom (13 x 11); Bedroom 2 (15 x 10); Bedroom 3 (21 x 7)
- Bathrooms: 2 full bathrooms; Primary bath (7 x 5); Bathroom 2 (7 x 4)
- Heating & cooling: Central air; Has heating
- Interior features: Storage; Stone counters; High speed internet; Eat-in kitchen; Ceiling fans; High ceilings; Multi-panel doors; Recessed lighting; Decorative fireplace; Full basement
- Laundry & utility: Laundry room on main level
Neighborhood map
What this means for you Summary
Snapshot
- This is a 3-bed/2.0-bath single-family listed at $239k.
Deal economics
- At list price, monthly cash flow is $74 ($894/yr) — positive.
- The deal already cash-flows at list — no discount required.
- To meet the 1% rule (rent ≥ 1% of price), the offer needs to be $196k (17.8% below list).
- Recommended offer: $196k (17.8% below list) — sets the bar for 1% rule.
- Cap rate 7.0% vs local median 5.3% in Covington — top-decile yield for the area; either an underpriced asset or a hidden risk that comps aren't pricing in. Stress-test before assuming the spread holds.
Location & tenants
- Location reads 86/100 on livability (#40 in KY, #376 nationally) — a professional / high-income tenant draw. Strengths: amenities A+, commute A+, cost of living A+; Watch: employment D+.
- Covington Independent (suburban): math 10% / reading 27% proficiency, ranked #162 of 165 in KY (top 98%) — low school quality limits family demand, transient renter base, plan for 1-2y turnover; 78% free/reduced lunch — lower-income household profile, screen leases tightly.
- Zoned schools: Glenn O Swing Elementary (math 29% / reading 50%, grade F, #208 of 676 statewide, top 34%, 407 students, 78% FRL); Holmes Middle School (math 8% / reading 26%, grade F, #211 of 217 statewide, top 97%, 656 students, 84% FRL); Holmes High School (math 12% / reading 17%, grade F, #227 of 254 statewide, top 89%, 878 students, 80% FRL) — zoned schools at 81% FRL track the district average.
- Market conditions: Rents rising (+1.6%/yr); 214 active listings in the ZIP; 12 comparable units currently listed for rent nearby; rentals leasing fast (median 7d on market — plan ~1-2 weeks tenant-placement turnaround); 699 units permitted in Kenton County in 2024 (287 in 5+ unit buildings).
- This rent runs 34% of the median local income ($70k/yr) — at the standard rent-burdened threshold; future hikes will face affordability resistance.
Forward outlook
- Local home prices are declining (-3.0%/yr); year-one equity from $2k of loan paydown is wiped out by about $7k of value loss. Plan a longer hold.
- Kenton County population projected at +5% by 2050 — modest demand growth; plan on rents tracking national, not racing it.
Negotiation context
- It's been on market 64 days — a 6% lower offer ($225k) is reasonable based on typical stale-listing flexibility.
- 3 sale attempts with the ask held roughly flat each time — persistent listings suggest the price (not the market) is what's stuck; bring a comps-based counter.
- Current owner paid $48k; list at $239k implies a 403% gain — meaningful room to come down on a strong offer.
Risks & watch-outs
- Watch-outs: flood insurance adds $66/mo.
- Climate carrying-cost: severe flood risk; extreme-heat days projected 7→19/yr by 2055 (HVAC capex compounding) — expect insurance premiums to compound above CPI over the hold.
Questions for the listing agent
- It's been on market 64 days. Have you received any prior offers? Is the seller open to a 18% concession, seller financing, or rate buy-down credit?
- What's the actual annual flood-insurance premium (NFIP or private), and is the property in a SFHA with mandatory coverage?
- Why hasn't it sold? Are there any deal-killer items the seller is aware of (foundation, flood, title, zoning, code violations)?
- Is there a deadline driving the sale (1031 exchange, divorce, estate, relocation)? That informs how much negotiation room exists.
- The area grade is low — what's the realistic commute time and amenity access for the typical tenant pool here? Any planned neighborhood developments (good or bad) we should know about?
- What's the average days-on-market for RENTAL listings here right now (not sales)? A rising rental-DOM trend means longer vacancies and softer asking-rent achievability than the comps imply.
- What's the recent tenant-quality profile in this submarket — average credit score on applications, eviction rate, late-payment / NSF rate, and stable-employment percentage? A property-management company in the area should have these aggregated.
- How much new for-sale + rental construction is in the pipeline within 1–3 miles? Heavy new supply typically softens prices + rents 12–24 months out; constrained supply supports both.
Investment metrics
- 1% rule
- 0.82% ✗
- Cap rate
- 7.00%
- Cash-on-cash
- 2.53%
- DSCR
- 1.11
- GRM
- 10.1
CMA / ARV
- ARV (on-the-fly)
- $276,576
- Comps found
- 12
Show comp detail 12 sales within ~0.75 mi
| Address | Dist | Beds/Ba | Sqft | Sold | Price | $/sf | Match |
|---|---|---|---|---|---|---|---|
| 605 Highland Pike | 0.30mi | 3/2.5 | 1,353 (-2%) | 7mo | $283,500 | $210 | 76 |
| 1143 Cecelia Ave | 0.42mi | 3/1.0 | 1,410 (+2%) | 5mo | $302,500 | $215 | 68 |
| 316 W 21st St | 0.55mi | 2/1.0 (-1) | 1,376 (0%) | 1mo | $205,000 | $149 | 64 |
| 1735 Woodburn Ave | 0.50mi | 3/1.5 | 1,255 (-9%) | 1mo | $259,900 | $207 | 59 |
| 1835 Jefferson Ave | 0.38mi | 2/1.0 (-1) | 1,454 (+6%) | 6mo | $187,500 | $129 | 59 |
| 1733 Jefferson Ave | 0.38mi | 3/1.5 | 1,203 (-13%) | 1mo | $242,000 | $201 | 59 |
| 202 W 18th St | 0.63mi | 3/1.5 | 1,436 (+4%) | 4mo | $219,000 | $153 | 58 |
| 218 W 21st St | 0.59mi | 3/2.0 | 1,240 (-10%) | 3mo | $246,500 | $199 | 54 |
| 2307 Herman St | 0.62mi | 3/1.0 | 1,264 (-8%) | 0mo | $145,000 | $115 | 54 |
| 1230 Upland Ave | 0.45mi | 4/2.5 (+1) | 1,523 (+11%) | 2mo | $342,500 | $225 | 53 |
| 1545 Holman St | 0.68mi | 3/1.0 | 1,439 (+5%) | 6mo | $200,000 | $139 | 52 |
| 1242 E Henry Clay Ave | 0.55mi | 3/2.0 | 1,176 (-14%) | 6mo | $245,000 | $208 | 45 |
Match score weights: distance 35% · size 25% · config 20% · recency 20%. Top-matched comps best support the ARV.
Projected returns pro-forma
-3.0% appreciation · 1.55% rent growth · sell at horizon
- IRR
- -15.7%
- Equity multiple
- 0.45×
- Total profit
- $-36,887
- Equity at exit
- $35,636
- IRR
- -9.7%
- Equity multiple
- 0.44×
- Total profit
- $-37,584
- Equity at exit
- $20,664
Cash invested: $66,920 (down + closing). Projections, not guarantees.
Landlord ↔ Tenant lean methodology
- Overall (STATE)
- 83 Strongly Landlord-Friendly
- State Kentucky
- 83 Strongly Landlord-Friendly · R+16
- County
- — inherits STATE
- City
- — inherits STATE
ZIP-level market 41011
- Rents YoY
- 1.6%
- Active inventory
- 214
- Price-to-rent
- 10.1×
Monthly cashflow live
- Estimated rent
- $1,963 high interval (Pro) →
- Mortgage (P&I)
- −$1,253
- Tax from tax record
- −$57 /mo · $687/yr
- Insurance
- −$100
- Flood insurance flood zone
- −$66 /mo · $798/yr
- HOA
- −$0
- Vacancy / Maint / Mgmt
- −$412
- Net cashflow
- $74
Break-even live
UW: 25.0% down · 7.5% · 30yr · 1.5% tax · 5.0% vac · 8.0% maint · 8.0% mgmt
Financing live
Cash to close
- Down payment
- $59,750
- Closing costs
- $7,170
- Reserves months
- —
- Total cash needed
- —
Loan-product check · same deal, 3 products live
Conventional
25% down · 7.5% · 30yr
- Down + closing
- —
- Monthly P&I
- —
- Monthly cashflow
- —
- DSCR
- —
- Eligible?
- —
Personal DTI + credit; lowest rate.
DSCR
20% down · 8.5% · 30yr
- Down + closing
- —
- Monthly P&I
- —
- Monthly cashflow
- —
- DSCR
- —
- Eligible?
- —
No personal income docs; deal must DSCR.
Hard money
10% down · 12.0% · 12mo
- Down + closing
- —
- Monthly P&I
- —
- Monthly cashflow
- —
- DSCR
- —
- Eligible?
- —
Short-term bridge; refi at stabilization.
Rent comps 12 comps
| Address | Beds | Baths | Sqft | Rent | $/sqft | DOM | Units | Dist |
|---|---|---|---|---|---|---|---|---|
| 1222 E Henry Clay Ave Fort Wright, KY | 3.0 | 1.5 | 1200 | $1,548 | $1.29 | 23d | 1 | 0.52mi |
| 2307 Center St Covington, KY | 3.0 | 1.5 | 1216 | $1,950 | $1.60 | 7d | 1 | 0.53mi |
| 2220 Cityscape Dr Covington, KY | 1.0–2.0 | 1.0–2.0 | 932 | $1,985 | $2.13 | 1d | 9 | 0.56mi |
| 1431 Dixie Hwy Park Hills, KY | 1.0–2.0 | 1.0–2.0 | 920 | $2,553 | $2.77 | 1d | 10 | 0.58mi |
| 1927 Scott St Apt 1 Covington, KY | 3.0 | 2.0 | 1865 | $2,100 | $1.13 | 19d | 1 | 0.86mi |
| 1205 Lee St Unit 3 Covington, KY | 3.0 | 2.5 | 1850 | $3,000 | $1.62 | 23d | 1 | 0.89mi |
| 2030 Mackoy St Covington, KY | 3.0 | 1.5 | 1598 | $1,779 | $1.11 | 4d | 1 | 1.00mi |
| 512 Wallace Ave Unit 512/18 Covington, KY | 2.0 | 2.0 | 900 | $1,299 | $1.44 | 7d | 1 | 1.19mi |
| 1025 Scott St Unit 2 Covington, KY | 2.0 | 2.0 | 1100 | $1,800 | $1.64 | 2d | 1 | 1.29mi |
| 344 E 13th St Unit 1 Covington, KY | 2.0 | 1.0 | 1000 | $1,275 | $1.27 | 23d | 1 | 1.37mi |
| 1979 Pieck Dr Unit A Covington, KY | 3.0 | 2.0 | 1480 | $1,800 | $1.22 | 23d | 1 | 1.43mi |
| 515 Main St Covington, KY | 1.0–2.0 | 1.0–2.0 | 934 | $2,215 | $2.37 | 1d | 8 | 1.46mi |
Listing history 20 events
-
2026-06-18days on market $239,000 Active 64 DOM
-
2026-06-17days on market $239,000 Active 63 DOM
-
2026-06-16days on market $239,000 Active 62 DOM
-
2026-06-15days on market $239,000 Active 61 DOM
-
2026-06-09days on market $239,000 Active 55 DOM
-
2026-06-08days on market $239,000 Active 54 DOM
-
2026-06-07days on market $239,000 Active 53 DOM
-
2026-06-03days on market $239,000 Active 49 DOM
-
2026-06-02days on market $239,000 Active 48 DOM
-
2026-06-01days on market $239,000 Active 47 DOM
-
2026-05-31days on market $239,000 Active 46 DOM
-
2026-05-11price $239,000
-
2026-04-15$248,800 Active
-
2026-04-14historical
-
2026-03-25price $255,000
-
2026-02-19$259,000 Active
-
2025-12-29historical
-
2025-10-03price $279,999
-
2025-09-05$289,000 Active
-
2024-11-13soldstatus $47,500
ⓘ Source: listings_history table (triggers on properties + properties_extension) + one-shot
backfill from property_details.listing_events for pre-trigger history.
Tax reassessment forecast KY · Resets to sale price
- Current annual tax
- $687 · $57/mo
- Projected year-2 tax
- $2,055 · $171/mo
- Expected delta
- +$1,369/yr (+$114/mo · 199.3%)
ⓘ Screening estimate from a state-policy table — verify with the county assessor before closing.
Climate risk First Street
- Flood 9/10 Extreme FEMA zone X (unshaded) · 99% chance over 30 yrs
- Wildfire 1/10 Low
- Heat 5/10 Major 7 d/yr ≥102°F today · 19 d/yr by 30 yrs out
- Wind 2/10 Low 100% chance of damaging wind over 30 yrs
- Air quality 3/10 Moderate 2 unhealthy d/yr today · 3 by 30 yrs out
Nearby sold comps map
Loading sold comps map…
Walkable amenities ~0.75 mi
Loading nearby amenities…
Taxation est. · year 1
- Rental income
- $23,561
- − Mortgage interest
- −$13,388
- − Property taxes
- −$687
- − Insurance
- −$1,992
- − Repairs & maintenance
- −$1,885
- − Management
- −$1,885
- − Depreciation
- −$6,953
- Taxable loss
- −$3,229
- Est. tax savings @ 24.0%
- +$775
- After-tax cash flow
- $1,668/yr
For passive investors: Depreciation is non-cash, so a rental often shows a tax loss while cash-flowing — sheltering income. Rental losses are passive: they offset passive income freely, and up to $25,000/yr can offset ordinary (W-2) income if you actively participate and your MAGI is under $100k (phasing out to $0 by $150k); unused losses carry forward. On sale, claimed depreciation is recaptured at up to 25%, and gains may owe capital-gains tax (a 1031 exchange can defer both). Figures are a year-1 estimate at your 24.0% rate — not tax advice; consult a CPA.
Schools (NCES district)
- District
- Covington Independent
- NCES district ID
- 2101350
- Math proficiency
- 10% ▼ -20.00%
- Reading proficiency
- 27% ▼ -14.00%
- Median HH income
- $33,681
- Composite
- 15.04/100
- National rank
- #9353
- State rank
- #162 of 165 in KY
Livability — Covington
- Score
- 86/100
- State rank
- #40
- US rank
- #376
Category grades
Schools grade is shown separately in the Schools card above.
Census & demographics
- Census place
- Covington, KY
- County
- Kenton County · 142,881 people
- City population
- 34,373
- Metro
- Cincinnati, OH-KY-IN
- Population (ZIP)
- 26,981
- Household income
- $69,970
- Rent vs Own
- Severe rent burden
- 1488.0
Population outlook (Kenton County) Hauer SSP2
- Today (2025)
- 174,205 people
- By 2030
- 177,897 · +2.1%
- By 2040
- 182,671 · +4.9%
- By 2050
- 183,543 · +5.4%
- By 2075
- 178,977 · +2.7%
- By 2100
- 159,920 · -8.2%
Race, ethnicity, and origin ACS 2023
- Neighborhood character
- Predominantly White (72%)
- Race & ethnicity
- White 72% Hispanic / Latino 12% Black 10% Two or more races 7% Asian 1%
- Hispanic origin (detail)
- Mexican 2%
- Common ancestry
- Lithuanian 2% Italian 1% Slovak 1%
- Foreign-born
- 7% · Canada
- Languages at home
- 90% English-only · Spanish 6% Other Indo-European 1%
Political lean MEDSL · Kenton
- 2024 margin
- Strong R (+21.7) · D 38.2% · R 59.9% · Other 1.9%
- 2008→2024 swing
- -0.9pp no change · 2008: -20.9pp · 2024: -21.7pp
- All cycles
- 2024: R+21.7 2020: R+19.3 2016: R+26.1 2012: R+24.3 2008: R+20.9
Not yet ingested
- Civics
- —
Market trends
- HPI YoY
- ▼ -215.20%
- Current HPI
- 237.0869
- Rent YoY
- ▲ 1.55%
- Metro
- Cincinnati, OH-KY-IN
- State GDP YoY
- ▲ 1.81%
- F500 in state
- 4
Industry mix (Fortune 500 HQ in KY)
| Industry | F500 HQs | Revenue |
|---|---|---|
| Healthcare | 1 | $118B |
|
||
| Food / Beverage | 1 | $7B |
|
||
Price history
+403.2% since first listed9 events — show timeline
- 2026-05-11 Price Changed $239,000 NKMLS
- 2026-04-15 Listed $248,800 NKMLS
- 2026-04-14 Listing Removed — NKMLS
- 2026-03-25 Price Changed $255,000 NKMLS
- 2026-02-19 Listed $259,000 NKMLS
- 2025-12-29 Listing Removed — NKMLS
- 2025-10-03 Price Changed $279,999 NKMLS
- 2025-09-05 Listed $289,000 NKMLS
- 2024-11-13 Sold (Public Records) $47,500 Public Records
Property tax history
-5.2%/yrLatest (2025): $687 · -49.6% YoY. Source: county tax records.
Cash-flow waterfall
monthlySold comps — $/sqft
last 12 mo · ≤1 miLoading sold comps…