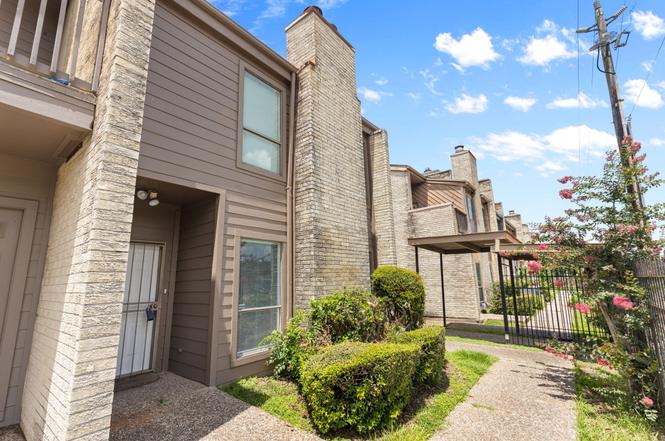
11280 Braes Forest Dr #105 · Houston, TX
Flood risk 1/10 · Minimal
- FEMA flood zone
- X (unshaded)
- Chance of flooding over 30 yrs
- 0.0%
- Est. flood insurance / yr
- $507 – $1,088
Fire risk 1/10 · Minimal
- Est. fire insurance / yr
- $1,222 – $2,270
Heat risk 9/10 · Severe
- Hot days now (above 110°F)
- 7 days/yr
- Hot days in 30 yrs
- 23 days/yr
Wind risk 9/10 · Severe
- Chance of severe wind over 30 yrs
- 99.0%
Air-quality risk 2/10 · Minimal
- Unhealthy air days now
- 2 days/yr
- Unhealthy air days in 30 yrs
- 2 days/yr
Risk factors via First Street. Map © Google.
Why this score? — see what drove the D- grade
The composite is a weighted blend of 9 inputs, each scored 0–100. Each bar is that input's sub-score; the figure is the points it added to the 100-point composite (weight × sub-score).
- Cash flow +9.6/30.0
- ARV discount +7.5/15.0
- Appreciation +4.6/10.0
- 1% rule +4.2/10.0
- Livability +3.7/5.0
- DSCR +2.7/10.0
- Schools +2.7/10.0
- Condition / age +2.5/5.0
- Rent growth +2.1/5.0
$244,900
🖨 Deal sheet 📄 Offer letter ✓ Due diligence
Listing remarks
Looking for more space without stretching your budget? This spacious 3-bedroom, 3.5-bath townhome offers approximately 2,962 square feet of living space in the Seville Townhomes community. The versatile floor plan features multiple living areas, a large game room, three generously sized bedrooms, and three full bathrooms, providing flexibility for guests, remote work, hobbies, or multi-generational living. The primary suite includes vaulted ceilings, a fireplace, ample closet space, and a private bath. Recent updates include flooring, interior paint, quartz countertops, renovated bathrooms, updated fixtures, and more. Enjoy an attached two-car garage, private balconies, abundant natural lig
Key facts
- $250 HOA
- 2 garage spots
- Community pool
Property features AI
Finance
- Other: Association pool available
- HOA & community: 21 Seville Townhomes Homeowners association; Community pool; Association fee $250 monthly (includes common areas); Community features include curbs
Exterior
- Parking: Attached 2-car garage; Additional paved parking; Electric gate; Unassigned parking spaces
- Security: Smoke detectors
- Utilities: Public water; Public sewer
- Home design: Residential property; Two stories; Full ownership; Slab foundation; Composition roof
- Construction: Built in 1981; Brick, cement siding, and wood siding construction
- Exterior features: Deck; Patio
Interior
- Kitchen: Pantry / Butler's pantry; Electric oven and electric range; Microwave; Dishwasher; Garbage disposal
- Bedrooms: Primary bedroom (second floor); Additional bedrooms on second floor (two other bedrooms)
- Flooring: Plank flooring; Vinyl flooring
- Bathrooms: Three full bathrooms; One half bathroom; Primary bathroom on second floor with separate shower
- Heating & cooling: Central heating (electric and gas); Central air conditioning (electric); Programmable thermostat
- Interior features: Wet bar and dry bar; Breakfast bar; Butler's pantry / walk-in pantry; Entrance foyer; High and vaulted ceilings; Brick walls; Double vanity; Separate shower and tub/shower; Vanity; Window coverings; Ceiling fans; Programmable thermostat; Insulated doors; Two fireplaces (gas log, wood burning, free standing)
- Laundry & utility: Laundry in utility room; Washer and dryer included; Electric and gas dryer hookups
Neighborhood map
What this means for you Summary
Snapshot
- This is a 3-bed/2.5-bath townhouse listed at $245k.
Deal economics
- At list price, monthly cash flow is $-165 ($-2k/yr) — negative.
- To cash-flow at today's rent, offer at most $216k (11.9% below list).
- To meet the 1% rule (rent ≥ 1% of price), the offer needs to be $227k (7.5% below list).
- Recommended offer: $216k (11.9% below list) — sets the bar for cash-flow.
- Cap rate 5.5% vs local median 3.2% in Houston — top-decile yield for the area; either an underpriced asset or a hidden risk that comps aren't pricing in. Stress-test before assuming the spread holds.
Location & tenants
- Location reads 74/100 on livability (#184 in TX, #4,771 nationally) — a middle-class / working-renter tenant base. Strengths: amenities A+, cost of living A+, housing A+; Watch: crime F.
- Houston ISD (urban): math 27% / reading 35% proficiency, ranked #593 of 826 in TX (top 72%) — families likely to look elsewhere, expect single-tenant / working-renter base with shorter leases; 71% free/reduced lunch — lower-income household profile, screen leases tightly.
- Zoned schools: Welch Middle (math 11% / reading 21%, grade F, #1,543 of 1,662 statewide, top 94%, 645 students, 97% FRL); Sharpstown H S (math 7% / reading 23%, grade F, #1,507 of 1,632 statewide, top 93%, 1,855 students, 89% FRL) — zoned schools average 93% FRL vs 71% district-wide (22 pts higher); higher-poverty schools than district average — tighter screening recommended.
- Zoned-school proficiency averages 16% at this address vs 31% district-wide (-16 pts) — the specific schools serving this property underperform the Houston ISD average; the district grade overstates school quality for this exact location.
- Market conditions: Rents soft (-1.5%/yr); 133 active listings in the ZIP; 5 comparable units currently listed for rent nearby; rentals lingering (median 44d on market — plan ~5-8 weeks vacancy on turnover, expect pricing pressure); 60% of comp listings sitting > 30 days — soft ceiling on asking rent; 29,883 units permitted in Harris County in 2024 (8,621 in 5+ unit buildings).
- At $2,265/mo this rent would consume 50% of the median local household income ($54k/yr) (locally 1242% of renters already pay >50% of income on rent) — very limited rent-growth headroom before tenants either downsize or default.
Forward outlook
- Local home prices are declining (-0.7%/yr); year-one equity from $2k of loan paydown is wiped out by about $2k of value loss. Plan a longer hold.
- Harris County population projected at +47% by 2050 — long-run rental-demand tailwind backs the buy-and-hold thesis.
Negotiation context
- Only 5 days on market — expect competitive offers; lowballing is unlikely to land.
- 3 sale attempts with the ask held roughly flat each time — persistent listings suggest the price (not the market) is what's stuck; bring a comps-based counter.
- Current owner paid $26k; list at $245k implies a 824% gain — meaningful room to come down on a strong offer.
Risks & watch-outs
- Climate carrying-cost: severe wind risk, 99% chance of damaging wind over 30y; extreme-heat days projected 7→23/yr by 2055 (HVAC capex compounding) — expect insurance premiums to compound above CPI over the hold.
Questions for the listing agent
- What do current leases actually rent for vs. the listed asking? Can we see a recent rent roll and the last 12 months of T-12 income?
- What does the HOA fee cover, when was the last increase, and are there any pending special assessments or reserve-fund shortfalls?
- Is there a deadline driving the sale (1031 exchange, divorce, estate, relocation)? That informs how much negotiation room exists.
- Schools are D-rated, which usually means shorter tenancies and higher turnover. Who's the typical renter profile here, and what's been the actual vacancy rate?
- Crime grade is F in this area — have there been break-ins, vandalism, or insurance claims at this property in the last 3 years? What carrier currently insures it and at what premium?
- The area grade is low — what's the realistic commute time and amenity access for the typical tenant pool here? Any planned neighborhood developments (good or bad) we should know about?
- What's the average days-on-market for RENTAL listings here right now (not sales)? A rising rental-DOM trend means longer vacancies and softer asking-rent achievability than the comps imply.
- What's the recent tenant-quality profile in this submarket — average credit score on applications, eviction rate, late-payment / NSF rate, and stable-employment percentage? A property-management company in the area should have these aggregated.
- How much new for-sale + rental construction is in the pipeline within 1–3 miles? Heavy new supply typically softens prices + rents 12–24 months out; constrained supply supports both.
Investment metrics
- 1% rule
- 0.92% ✗
- Cap rate
- 5.49%
- Cash-on-cash
- -2.88%
- DSCR
- 0.87
- GRM
- 9.0
CMA / ARV
No comps found within radius.
Projected returns pro-forma
-0.73% appreciation · 0.0% rent growth · sell at horizon
- IRR
- -11.0%
- Equity multiple
- 0.53×
- Total profit
- $-32,338
- Equity at exit
- $62,335
- IRR
- -7.3%
- Equity multiple
- 0.37×
- Total profit
- $-43,410
- Equity at exit
- $68,242
Cash invested: $68,572 (down + closing). Projections, not guarantees.
Landlord ↔ Tenant lean methodology
- Overall (STATE)
- 87 Strongly Landlord-Friendly
- State Texas
- 87 Strongly Landlord-Friendly · R+5
- County
- — inherits STATE
- City
- — inherits STATE
ZIP-level market 77071
- Home prices YoY
- -0.3%
- Rents YoY
- -1.5%
- Active inventory
- 133
- Price-to-rent
- 9.0×
Monthly cashflow live
- Estimated rent
- $2,265 medium interval (Pro) →
- Mortgage (P&I)
- −$1,284
- Tax from tax record
- −$318 /mo · $3,813/yr
- Insurance
- −$102
- HOA
- −$250
- Vacancy / Maint / Mgmt
- −$476
- Net cashflow
- $-165
Break-even live
UW: 25.0% down · 7.5% · 30yr · 1.5% tax · 5.0% vac · 8.0% maint · 8.0% mgmt
Financing live
Cash to close
- Down payment
- $61,225
- Closing costs
- $7,347
- Reserves months
- —
- Total cash needed
- —
Loan-product check · same deal, 3 products live
Conventional
25% down · 7.5% · 30yr
- Down + closing
- —
- Monthly P&I
- —
- Monthly cashflow
- —
- DSCR
- —
- Eligible?
- —
Personal DTI + credit; lowest rate.
DSCR
20% down · 8.5% · 30yr
- Down + closing
- —
- Monthly P&I
- —
- Monthly cashflow
- —
- DSCR
- —
- Eligible?
- —
No personal income docs; deal must DSCR.
Hard money
10% down · 12.0% · 12mo
- Down + closing
- —
- Monthly P&I
- —
- Monthly cashflow
- —
- DSCR
- —
- Eligible?
- —
Short-term bridge; refi at stabilization.
Rent comps 5 comps
| Address | Beds | Baths | Sqft | Rent | $/sqft | DOM | Units | Dist |
|---|---|---|---|---|---|---|---|---|
| 11280 Braes Forest Dr #301 Houston, TX | 3.0 | 3.5 | 2908 | $1,000 | $0.34 | 43d | 1 | 0.03mi |
| 8115 Braesview Ln Houston, TX | 4.0 | 2.0 | 2272 | $2,500 | $1.10 | 43d | 1 | 1.00mi |
| 11418 Braewick Dr Unit 1514798P Houston, TX | 4.0 | 2.0 | 1991 | $12,178 | $6.12 | 22d | 1 | 1.39mi |
| 6031 Cerritos Dr Houston, TX | 4.0 | 2.0 | 2232 | $2,450 | $1.10 | 43d | 1 | 1.45mi |
| 6171 Dryad Dr Houston, TX | 3.0 | 2.0 | 2240 | $2,000 | $0.89 | 14d | 1 | 1.45mi |
HOA detail
- Monthly dues
- $250 · $3,000/yr
Listing history 5 events
-
2026-06-18days on market $244,900 Active 5 DOM
-
2026-06-17days on market $244,900 Active 4 DOM
-
2026-06-16days on market $244,900 Active 3 DOM
-
2026-06-15remarks 699-char remark
-
2026-06-15$244,900 Active 2 DOM
ⓘ Source: listings_history table (triggers on properties + properties_extension) + one-shot
backfill from property_details.listing_events for pre-trigger history.
Tax reassessment forecast TX · Resets to sale price
- Current annual tax
- $3,813 · $318/mo
- Projected year-2 tax
- $4,482 · $373/mo
- Expected delta
- +$669/yr (+$56/mo · 17.5%)
ⓘ Screening estimate from a state-policy table — verify with the county assessor before closing.
Climate risk First Street
- Flood 1/10 Low FEMA zone X (unshaded) · 0% chance over 30 yrs
- Wildfire 1/10 Low
- Heat 9/10 Extreme 7 d/yr ≥110°F today · 23 d/yr by 30 yrs out
- Wind 9/10 Extreme 99% chance of damaging wind over 30 yrs
- Air quality 2/10 Low 2 unhealthy d/yr today · 2 by 30 yrs out
Nearby sold comps map
Loading sold comps map…
Walkable amenities ~0.75 mi
Loading nearby amenities…
Taxation est. · year 1
- Rental income
- $27,182
- − Mortgage interest
- −$13,718
- − Property taxes
- −$3,813
- − Insurance
- −$1,224
- − Repairs & maintenance
- −$2,175
- − Management
- −$2,175
- − HOA
- −$3,000
- − Depreciation
- −$7,124
- Taxable loss
- −$6,047
- Est. tax savings @ 24.0%
- +$1,451
- After-tax cash flow
- $-524/yr
For passive investors: Depreciation is non-cash, so a rental often shows a tax loss while cash-flowing — sheltering income. Rental losses are passive: they offset passive income freely, and up to $25,000/yr can offset ordinary (W-2) income if you actively participate and your MAGI is under $100k (phasing out to $0 by $150k); unused losses carry forward. On sale, claimed depreciation is recaptured at up to 25%, and gains may owe capital-gains tax (a 1031 exchange can defer both). Figures are a year-1 estimate at your 24.0% rate — not tax advice; consult a CPA.
Schools (NCES district)
- District
- Houston ISD
- NCES district ID
- 4823640
- Math proficiency
- 27% ▼ -18.00%
- Reading proficiency
- 35% ▼ -6.00%
- Median HH income
- $46,054
- Composite
- 26.63/100
- National rank
- #7173
- State rank
- #593 of 826 in TX
Livability — Houston
- Score
- 74/100
- State rank
- #184
- US rank
- #4771
Category grades
Schools grade is shown separately in the Schools card above.
Census & demographics
- Census place
- Houston, TX
- County
- Harris County · 4,702,590 people
- City population
- 3,226,434
- Metro
- Houston-The Woodlands-Sugar Land, TX
- Population (ZIP)
- 27,056
- Household income
- $54,139
- Rent vs Own
- Severe rent burden
- 1242.0
Population outlook (Harris County) Hauer SSP2
- Today (2025)
- 5,571,493 people
- By 2030
- 6,089,821 · +9.3%
- By 2040
- 7,142,806 · +28.2%
- By 2050
- 8,185,864 · +46.9%
- By 2075
- 10,574,329 · +89.8%
- By 2100
- 12,109,958 · +117.4%
Race, ethnicity, and origin ACS 2023
- Neighborhood character
- Diverse neighborhood (Simpson 0.69)
- Race & ethnicity
- Black 46% Hispanic / Latino 26% White 17% Two or more races 8% Asian 7%
- Hispanic origin (detail)
- Mexican 13%
- Common ancestry
- Romanian 2% Scotch-Irish 1% Lithuanian 1%
- Foreign-born
- 33% · Canada, Vietnam, China
- Languages at home
- 58% English-only · Spanish 25% Vietnamese 3% Chinese 2%
Political lean MEDSL · Harris
- 2024 margin
- Lean D (+5.5) · D 52.0% · R 46.4% · Other 1.6%
- 2008→2024 swing
- +3.9pp toward D · 2008: 1.6pp · 2024: 5.5pp
- All cycles
- 2024: D+5.5 2020: D+13.3 2016: D+12.4 2012: D+0.1 2008: D+1.6
Not yet ingested
- Civics
- —
Market trends
- HPI YoY
- ▼ -0.73%
- Current HPI
- 250.0788
- Rent YoY
- ▼ -1.51%
- Metro
- Houston-The Woodlands-Sugar Land, TX
- State GDP YoY
- ▲ 3.95%
- F500 in state
- 110
Industry mix (Fortune 500 HQ in TX)
| Industry | F500 HQs | Revenue |
|---|---|---|
| Energy | 16 | $1,198B |
|
||
| Technology | 5 | $198B |
|
||
| Engineering / Construction | 4 | $72B |
|
||
| Energy Services | 3 | $60B |
|
||
| Utilities | 3 | $41B |
|
||
| Healthcare | 2 | $330B |
|
||
Price history
+824.2% since first listed13 events — show timeline
- 2026-06-13 Listed $244,900 HARMLS
- 2026-01-26 Pending — HARMLS
- 2026-01-14 Pending — HARMLS
- 2026-01-14 Listing Removed — HARMLS
- 2025-12-19 Price Changed $119,000 HARMLS
- 2025-11-24 Listed $129,000 HARMLS
- 2025-10-17 Sold (Public Records) — Public Records
- 2025-10-08 Listing Removed — HARMLS
- 2025-10-05 Price Changed $155,000 HARMLS
- 2025-08-18 Price Changed $185,000 HARMLS
- 2025-08-02 Price Changed $192,990 HARMLS
- 2025-06-27 Listed $195,990 HARMLS
- 1992-11-24 Sold (Public Records) $26,500 Public Records
Property tax history
+5.7%/yrLatest (2025): $3,813 · -15.3% YoY. Source: county tax records.
Cash-flow waterfall
monthlySold comps — $/sqft
last 12 mo · ≤1 miLoading sold comps…