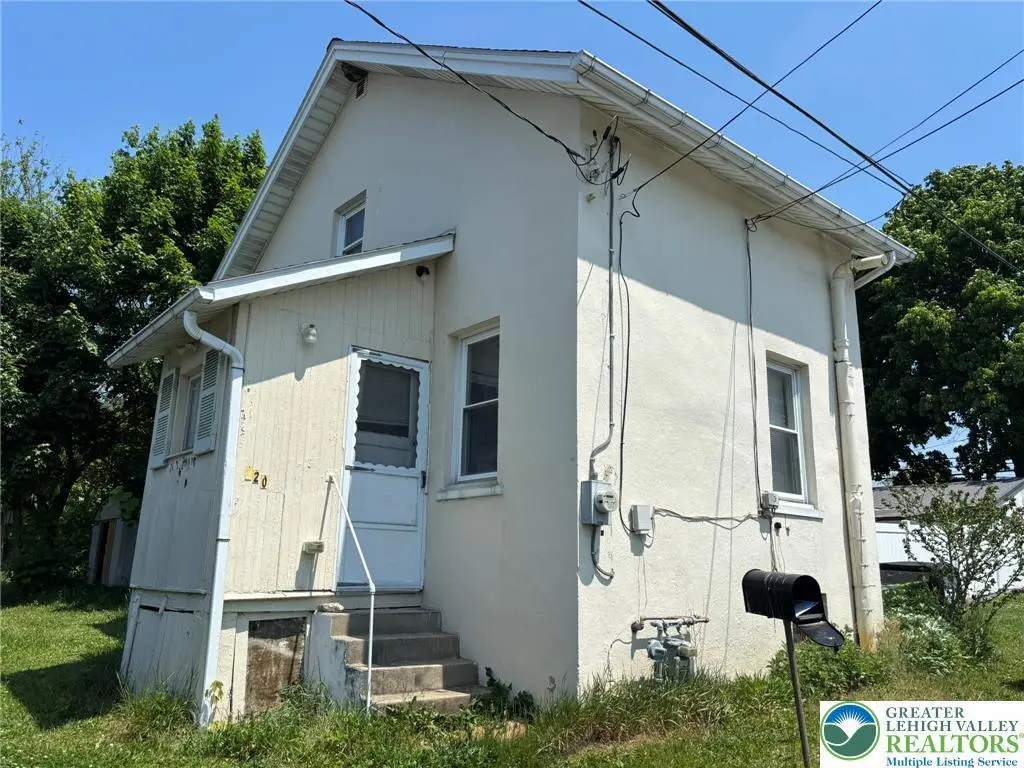
920 E Juniata St · Allentown, PA
Flood risk 1/10 · Minimal
- FEMA flood zone
- X (unshaded)
- Chance of flooding over 30 yrs
- 0.0%
- Est. flood insurance / yr
- $507 – $1,088
Fire risk 3/10 · Minor
- Est. fire insurance / yr
- $511 – $949
Heat risk 5/10 · Moderate
- Hot days now (above 99°F)
- 7 days/yr
- Hot days in 30 yrs
- 15 days/yr
Wind risk 4/10 · Minor
- Chance of severe wind over 30 yrs
- 17.0%
Air-quality risk 4/10 · Minor
- Unhealthy air days now
- 3 days/yr
- Unhealthy air days in 30 yrs
- 6 days/yr
Risk factors via First Street. Map © Google.
Why this score? — see what drove the C- grade
The composite is a weighted blend of 9 inputs, each scored 0–100. Each bar is that input's sub-score; the figure is the points it added to the 100-point composite (weight × sub-score).
- ARV discount +15.0/15.0
- Cash flow +14.3/30.0
- DSCR +4.4/10.0
- Rent growth +4.3/5.0
- Livability +4.0/5.0
- 1% rule +3.6/10.0
- Schools +3.6/10.0
- Condition / age +2.5/5.0
- Appreciation +0.0/10.0
$160,000
🖨 Deal sheet 📄 Offer letter ✓ Due diligence
Listing remarks
Opportunity awaits with this detached single home in desirable Salisbury Township currently being used as a long-term rental property. Whether you're looking to expand your investment portfolio or explore future possibilities, this property offers solid potential in a convenient location. The home offers a functional layout with plenty of opportunity to update, personalize, or continue operating as an income-producing rental. A newer roof adds additional value and peace of mind for future ownership. One of the standout features is the large backyard, offering additional outdoor space and possible future opportunities. Buyers are encouraged to verify with the township regarding any potential
Key facts
- Newer roof
- Large backyard
- Functional layout
Tags
Property features AI
Exterior
- Parking: No garage
- Utilities: Public water; Public sewer; Electric service available; Oil for water heater and heating
- Home design: Single-story; Stucco exterior
- Construction: Built with stucco exterior; Asphalt/fiberglass roof
- Exterior features: Lot approximately 6,000 sq ft (0.138 acres); Zoned R4
Interior
- Kitchen: Gas oven; Gas range; Microwave; Refrigerator
- Bedrooms: Total of 3 rooms (includes bedrooms and living areas)
- Bathrooms: 1 full bathroom
- Heating & cooling: Oil heating; Wall/window cooling unit(s)
- Interior features: Eat-in kitchen; Full basement
- Laundry & utility: Washer hookup; Dryer hookup (electric); Washer included; Electric dryer included; Oil water heater
Neighborhood map
What this means for you Summary
Snapshot
- This is a 1-bed/1.0-bath single-family listed at $160k.
Deal economics
- At list price, monthly cash flow is $30 ($364/yr) — positive.
- The deal already cash-flows at list — no discount required.
- To meet the 1% rule (rent ≥ 1% of price), the offer needs to be $138k (13.5% below list).
- Recommended offer: $138k (13.5% below list) — sets the bar for 1% rule.
- Cap rate 6.5% vs local median 5.3% in Allentown — meaningfully above typical; check what's discounted (condition, days-on-market, listing class) to confirm the premium yield is real.
Location & tenants
- Location reads 81/100 on livability (#171 in PA, #1,440 nationally) — a professional / high-income tenant draw. Strengths: commute A+, cost of living A+, housing A+; Watch: schools D+, employment D.
- Salisbury Township SD (suburban): math 29% / reading 51% proficiency, ranked #307 of 539 in PA (top 57%) — families likely to look elsewhere, expect single-tenant / working-renter base with shorter leases.
- Market conditions: Rents rising fast (+7.0%/yr); 161 active listings in the ZIP; 8 comparable units currently listed for rent nearby; rentals lingering (median 44d on market — plan ~5-8 weeks vacancy on turnover, expect pricing pressure); 50% of comp listings sitting > 30 days — soft ceiling on asking rent; 765 units permitted in Lehigh County in 2024 (286 in 5+ unit buildings).
Forward outlook
- Local home prices are declining (-3.0%/yr); year-one equity from $1k of loan paydown is wiped out by about $5k of value loss. Plan a longer hold.
- Lehigh County population projected at +21% by 2050 — long-run rental-demand tailwind backs the buy-and-hold thesis.
Negotiation context
- It's been on market 17 days — a 2% lower offer ($158k) is reasonable based on typical stale-listing flexibility.
- 4 sale attempts with the ask held roughly flat each time — persistent listings suggest the price (not the market) is what's stuck; bring a comps-based counter.
- Current owner paid $18k; list at $160k implies a 789% gain — meaningful room to come down on a strong offer.
Risks & watch-outs
- Watch-outs: built in 1930 — expect roof / HVAC / electrical / plumbing capex.
- Climate carrying-cost: extreme-heat days projected 7→15/yr by 2055 (HVAC capex compounding) — expect insurance premiums to compound above CPI over the hold.
Questions for the listing agent
- Built in 1930 — when were the roof, HVAC, electrical panel, plumbing, and water heater last replaced?
- Is there a deadline driving the sale (1031 exchange, divorce, estate, relocation)? That informs how much negotiation room exists.
- Schools are D-rated, which usually means shorter tenancies and higher turnover. Who's the typical renter profile here, and what's been the actual vacancy rate?
- What's the average days-on-market for RENTAL listings here right now (not sales)? A rising rental-DOM trend means longer vacancies and softer asking-rent achievability than the comps imply.
- What's the recent tenant-quality profile in this submarket — average credit score on applications, eviction rate, late-payment / NSF rate, and stable-employment percentage? A property-management company in the area should have these aggregated.
- How much new for-sale + rental construction is in the pipeline within 1–3 miles? Heavy new supply typically softens prices + rents 12–24 months out; constrained supply supports both.
Investment metrics
- 1% rule
- 0.86% ✗
- Cap rate
- 6.52%
- Cash-on-cash
- 0.81%
- DSCR
- 1.04
- GRM
- 9.6
CMA / ARV
- ARV (median comp)
- $219,031
- List price
- $160,000
- Delta
- -26.95%
- Verdict
- UNDERPRICED
- Comps
- 17 within 1.0 mi
Projected returns pro-forma
-3.0% appreciation · 7.05% rent growth · sell at horizon
- IRR
- -10.7%
- Equity multiple
- 0.60×
- Total profit
- $-18,132
- Equity at exit
- $23,857
- IRR
- 3.4%
- Equity multiple
- 1.29×
- Total profit
- $12,858
- Equity at exit
- $13,834
Cash invested: $44,800 (down + closing). Projections, not guarantees.
Landlord ↔ Tenant lean methodology
- Overall (STATE)
- 62 Landlord-Friendly
- State Pennsylvania
- 62 Landlord-Friendly · EVEN
- County
- — inherits STATE
- City
- — inherits STATE
ZIP-level market 18103
- Rents YoY
- 7.0%
- Active inventory
- 161
- Price-to-rent
- 9.6×
Monthly cashflow live
- Estimated rent
- $1,384 high interval (Pro) →
- Mortgage (P&I)
- −$839
- Tax from tax record
- −$157 /mo · $1,887/yr
- Insurance
- −$67
- HOA
- −$0
- Vacancy / Maint / Mgmt
- −$291
- Net cashflow
- $30
Break-even live
UW: 25.0% down · 7.5% · 30yr · 1.5% tax · 5.0% vac · 8.0% maint · 8.0% mgmt
Financing live
Cash to close
- Down payment
- $40,000
- Closing costs
- $4,800
- Reserves months
- —
- Total cash needed
- —
Loan-product check · same deal, 3 products live
Conventional
25% down · 7.5% · 30yr
- Down + closing
- —
- Monthly P&I
- —
- Monthly cashflow
- —
- DSCR
- —
- Eligible?
- —
Personal DTI + credit; lowest rate.
DSCR
20% down · 8.5% · 30yr
- Down + closing
- —
- Monthly P&I
- —
- Monthly cashflow
- —
- DSCR
- —
- Eligible?
- —
No personal income docs; deal must DSCR.
Hard money
10% down · 12.0% · 12mo
- Down + closing
- —
- Monthly P&I
- —
- Monthly cashflow
- —
- DSCR
- —
- Eligible?
- —
Short-term bridge; refi at stabilization.
Rent comps 8 comps
| Address | Beds | Baths | Sqft | Rent | $/sqft | DOM | Units | Dist |
|---|---|---|---|---|---|---|---|---|
| 602 E Lexington St Unit C Allentown, PA | 1.0 | 1.0 | 700 | $1,300 | $1.86 | 43d | 1 | 0.38mi |
| 218 E Susquehanna St Unit 1A Allentown, PA | 1.0 | 1.0 | 500 | $1,295 | $2.59 | 14d | 1 | 0.74mi |
| 1010 S Armour St Allentown, PA | 1.0 | 1.0 | 700 | $1,495 | $2.14 | 21d | 1 | 0.97mi |
| 10 E Wyoming St Allentown, PA | 1.0 | 1.0 | 700 | $1,395 | $1.99 | 43d | 1 | 0.99mi |
| 333 River Dr Allentown, PA | 1.0–2.0 | 1.0–2.0 | 869 | $1,645 | $1.89 | 2d | 13 | 1.03mi |
| 722 Weil St Unit Rear Bethlehem, PA | 1.0 | 1.0 | 576 | $1,225 | $2.13 | 43d | 1 | 1.27mi |
| 1949 S 5th St Unit 103 Allentown, PA | 1.0 | 1.0 | 662 | $1,400 | $2.11 | 43d | 1 | 1.44mi |
| 1949 S 5th St Unit 204 Allentown, PA | 1.0 | 1.0 | 643 | $1,350 | $2.10 | 2d | 1 | 1.44mi |
Listing history 24 events
-
2026-06-13statusdays on market $160,000 Pending 17 DOM
-
2026-06-10days on market $160,000 Active 15 DOM
-
2026-06-09days on market $160,000 Active 14 DOM
-
2026-06-08days on market $160,000 Active 13 DOM
-
2026-06-07days on market $160,000 Active 12 DOM
-
2026-06-03days on market $160,000 Active 8 DOM
-
2026-06-02days on market $160,000 Active 7 DOM
-
2026-06-01days on market $160,000 Active 6 DOM
-
2026-05-31days on market $160,000 Active 5 DOM
-
2026-05-31days on market $160,000 Active 4 DOM
-
2026-05-08historical
-
2026-05-08historical
-
2026-05-08historical
-
2026-04-30price $160,000
-
2026-04-30price $160,000
-
2026-04-30price $160,000
-
2026-04-25price $175,000
-
2026-04-25price $175,000
-
2026-04-25price $175,000
-
2026-04-25$185,000 Active
-
2026-04-22$185,000 Active
-
2026-04-22$185,000 Active
-
1990-12-01soldstatus $18,000
-
1978-10-03soldstatus $7,000
ⓘ Source: listings_history table (triggers on properties + properties_extension) + one-shot
backfill from property_details.listing_events for pre-trigger history.
Tax reassessment forecast PA · Partial reset (capped growth)
- Current annual tax
- $1,887 · $157/mo
- Projected year-2 tax
- $2,207 · $184/mo
- Expected delta
- +$321/yr (+$27/mo · 17.0%)
ⓘ Screening estimate from a state-policy table — verify with the county assessor before closing.
Climate risk First Street
- Flood 1/10 Low FEMA zone X (unshaded) · 0% chance over 30 yrs
- Wildfire 3/10 Moderate
- Heat 5/10 Major 7 d/yr ≥99°F today · 15 d/yr by 30 yrs out
- Wind 4/10 Moderate 17% chance of damaging wind over 30 yrs
- Air quality 4/10 Moderate 3 unhealthy d/yr today · 6 by 30 yrs out
Nearby sold comps map
Loading sold comps map…
Walkable amenities ~0.75 mi
Loading nearby amenities…
Taxation est. · year 1
- Rental income
- $16,607
- − Mortgage interest
- −$8,962
- − Property taxes
- −$1,887
- − Insurance
- −$800
- − Repairs & maintenance
- −$1,329
- − Management
- −$1,329
- − Depreciation
- −$4,655
- Taxable loss
- −$2,354
- Est. tax savings @ 24.0%
- +$565
- After-tax cash flow
- $929/yr
For passive investors: Depreciation is non-cash, so a rental often shows a tax loss while cash-flowing — sheltering income. Rental losses are passive: they offset passive income freely, and up to $25,000/yr can offset ordinary (W-2) income if you actively participate and your MAGI is under $100k (phasing out to $0 by $150k); unused losses carry forward. On sale, claimed depreciation is recaptured at up to 25%, and gains may owe capital-gains tax (a 1031 exchange can defer both). Figures are a year-1 estimate at your 24.0% rate — not tax advice; consult a CPA.
Schools (NCES district)
- District
- Salisbury Township SD
- NCES district ID
- 4220730
- Math proficiency
- 29% ▼ -11.00%
- Reading proficiency
- 51% ▼ -11.00%
- Median HH income
- $69,808
- Composite
- 36.3/100
- National rank
- #4696
- State rank
- #307 of 539 in PA
Livability — Allentown
- Score
- 81/100
- State rank
- #171
- US rank
- #1440
Category grades
Schools grade is shown separately in the Schools card above.
Census & demographics
- County
- Lehigh County · 333,019 people
- City population
- 172,996
- Metro
- Allentown-Bethlehem-Easton, PA-NJ
- Population (ZIP)
- 48,746
- Household income
- $72,895
- Rent vs Own
- Severe rent burden
- 1792.0
Population outlook (Lehigh County) Hauer SSP2
- Today (2025)
- 392,957 people
- By 2030
- 408,319 · +3.9%
- By 2040
- 440,007 · +12.0%
- By 2050
- 475,940 · +21.1%
- By 2075
- 590,448 · +50.3%
- By 2100
- 690,314 · +75.7%
Race, ethnicity, and origin ACS 2023
- Neighborhood character
- Diverse neighborhood (Simpson 0.63)
- Race & ethnicity
- White 46% Hispanic / Latino 38% Two or more races 15% Black 9% Asian 3% Native American 1%
- Hispanic origin (detail)
- Mexican 4% Puerto Rican 15% Dominican 13%
- Common ancestry
- Romanian 3% Polish 3% Iranian 1%
- Foreign-born
- 19% · Canada, Jamaica, Vietnam
- Languages at home
- 64% English-only · Spanish 30% Other Indo-European 1% Other Asian/Pacific 1%
Political lean MEDSL · Lehigh
- 2024 margin
- Toss-up / Even · D 50.7% · R 48.0% · Other 1.2%
- 2008→2024 swing
- -12.9pp toward R · 2008: 15.6pp · 2024: 2.7pp
- All cycles
- 2024: D+2.7 2020: D+7.6 2016: D+4.4 2012: D+7.5 2008: D+15.6
Not yet ingested
- Civics
- —
Market trends
- HPI YoY
- ▼ -358.28%
- Current HPI
- 298.1512
- Rent YoY
- ▲ 7.05%
- Metro
- Allentown-Bethlehem-Easton, PA-NJ
- State GDP YoY
- ▲ 1.68%
- F500 in state
- 34
Industry mix (Fortune 500 HQ in PA)
| Industry | F500 HQs | Revenue |
|---|---|---|
| Healthcare | 2 | $309B |
|
||
| Insurance | 2 | $27B |
|
||
| Telecommunications / Media | 1 | $124B |
|
||
| Industrial Distribution | 1 | $22B |
|
||
| Financial Services | 1 | $20B |
|
||
| Chemicals / Materials | 1 | $18B |
|
||
Price history
+2185.7% since first listed16 events — show timeline
- 2026-06-12 Pending — GLVRMLS
- 2026-05-26 Listed $160,000 GLVRMLS
- 2026-05-08 Listing Removed — GLVRMLS
- 2026-05-08 Listing Removed — GLVRMLS
- 2026-05-08 Listing Removed — BRIGHT MLS
- 2026-04-30 Price Changed $160,000 BRIGHT MLS
- 2026-04-30 Price Changed $160,000 GLVRMLS
- 2026-04-30 Price Changed $160,000 GLVRMLS
- 2026-04-25 Price Changed $175,000 BRIGHT MLS
- 2026-04-25 Price Changed $175,000 GLVRMLS
- 2026-04-25 Price Changed $175,000 GLVRMLS
- 2026-04-25 Listed $185,000 GLVRMLS
- 2026-04-22 Listed $185,000 GLVRMLS
- 2026-04-22 Listed $185,000 BRIGHT MLS
- 1990-12-01 Sold (Public Records) $18,000 Public Records
- 1978-10-03 Sold (Public Records) $7,000 Public Records
Property tax history
+3.5%/yrLatest (2026): $1,887 · +6.0% YoY. Source: county tax records.
Cash-flow waterfall
monthlySold comps — $/sqft
last 12 mo · ≤1 miLoading sold comps…