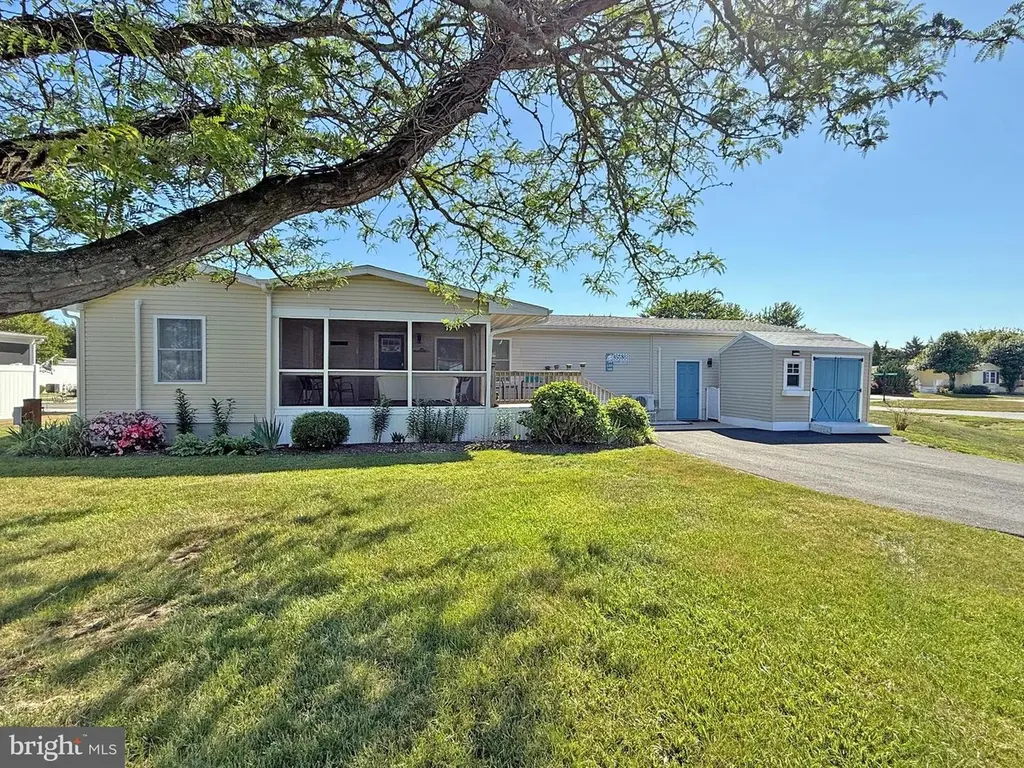
35638 Highlands Way #188 · Lewes, DE
Flood risk 1/10 · Minimal
- FEMA flood zone
- X (unshaded)
- Chance of flooding over 30 yrs
- 0.0%
- Est. flood insurance / yr
- $473 – $860
Fire risk 1/10 · Minimal
- Est. fire insurance / yr
- $476 – $884
Heat risk 8/10 · Major
- Hot days now (above 101°F)
- 7 days/yr
- Hot days in 30 yrs
- 18 days/yr
Wind risk 8/10 · Major
- Chance of severe wind over 30 yrs
- 80.0%
Air-quality risk 2/10 · Minimal
- Unhealthy air days now
- 1 days/yr
- Unhealthy air days in 30 yrs
- 1 days/yr
Risk factors via First Street. Map © Google.
Why this score? — see what drove the D+ grade
The composite is a weighted blend of 9 inputs, each scored 0–100. Each bar is that input's sub-score; the figure is the points it added to the 100-point composite (weight × sub-score).
- Cash flow +20.9/30.0
- DSCR +6.6/10.0
- 1% rule +5.5/10.0
- Schools +4.2/10.0
- Livability +3.4/5.0
- Rent growth +2.5/5.0
- Condition / age +2.5/5.0
- ARV discount +0.0/15.0
- Appreciation +0.0/10.0
$239,000
🖨 Deal sheet 📄 Offer letter ✓ Due diligence
Listing remarks MLS
Need a beach home close to the beaches well this one is for you. This 3 bedroom 2 bath home is on a corner lot with a carport and lots of parking. It also has a master bedroom/bath suite with a walk in closet and a split floor plan. There also are 3 decks and a screen porch for sitting back and relaxing at the beach. Check out the newer amenities: 2012 New Roof on carport and home. 2010 A/C and Heat pump, living room and hall just painted. The stove and water heater where also replaced. The community has a club house, fitness room and beautiful outdoor pool. This centrally located home is only blocks to the movies, restaurants, outlets and minutes to the Rehoboth boardwalk. Call today for more information.
Key facts
- Front screened porch
- Community pool
- Sliding glass door
Tags
Property features AI
Finance
- Other: Property condition listed as very good; Pets allowed (cats and dogs OK, with number limit); Accessibility: 2+ access exits
- Financial info: Land lease of $909 per month (annual ground rent exists; payment monthly); Ground rent payment frequency: annually (note: land lease terms listed); Lease not considered
- HOA & community: Community amenities include clubhouse, exercise room and outdoor pool; HOA covers common area maintenance, lawn care (front, rear, side), pool(s), road maintenance and trash
Exterior
- Parking: Attached garage with rear entry and inside access, garage door opener (2-car garage); Concrete and asphalt driveways; Driveway provides about 8 additional spaces (total garage and parking spaces: 10)
- Utilities: Public water and public sewer; Municipal trash service; Cable and satellite internet available; Electric hot water
- Home design: Manufactured double-wide home (Schult); Single-story entry (main level living); Architectural shingle roof; Vinyl siding; Crawl space foundation with pillar/post/pier support; Building not winterized; Outside city limits; private roads with blacktop surface
- Construction: Built (year source: assessor); Vinyl siding construction; Architectural shingle roof; Crawl space foundation
- Exterior features: Deck(s), porch(es) and screened porch; Awning(s); Shed; Corner lot with front, rear and side yards; Community in-ground fenced pool
Interior
- Kitchen: Stainless steel appliances; Electric oven/range; Range hood; Dishwasher; Refrigerator; Upgraded countertops
- Bedrooms: Three bedrooms on the main level
- Flooring: Luxury vinyl plank flooring
- Bathrooms: Two full bathrooms (both on the main level)
- Heating & cooling: Heat pump and forced air; Wall unit; Central A/C and ductless/mini-split options; Ceiling fans; Electric heating and electric cooling fuel; 200+ amp / 220 volt electrical service
- Interior features: Open floor plan with combination kitchen/dining and combination dining/living areas; Recessed lighting; Vaulted ceilings; Ceiling fans; Window treatments; Upgraded countertops; Master bath; Walk-in closet(s); Tub shower and walk-in shower; Sliding glass and insulated doors; Not furnished
- Laundry & utility: Washer and dryer in unit (dryer electric); Laundry located on main floor; Water heater (electric)
Neighborhood map
What this means for you Summary
Snapshot
- This is a 3-bed/2.0-bath single-family listed at $239k.
Deal economics
- At list price, monthly cash flow is $332 ($4k/yr) — positive.
- The deal already cash-flows at list — no discount required.
- Meets the 1% rule at list price ($3k rent vs $239k).
- Cap rate 8.0% vs local median 1.7% in Lewes — top-decile yield for the area; either an underpriced asset or a hidden risk that comps aren't pricing in. Stress-test before assuming the spread holds.
Location & tenants
- Location reads 67/100 on livability (#40 in DE) — a middle-class / working-renter tenant base. Strengths: crime A+, employment A+, health & safety A+; Watch: commute F, cost of living F.
- Cape Henlopen School District (town): math 42% / reading 55% proficiency, ranked #5 of 26 in DE (top 19%) — families likely to look elsewhere, expect single-tenant / working-renter base with shorter leases.
- Market conditions: 331 active listings in the ZIP; 7 comparable units currently listed for rent nearby; rentals at typical pace (median 21d on market — plan ~3-4 weeks tenant-placement turnaround); 43% of comp listings sitting > 30 days — soft ceiling on asking rent; solid renter incomes; 4,354 units permitted in Sussex County in 2024 (344 in 5+ unit buildings).
Forward outlook
- Local home prices are declining (-3.0%/yr); year-one equity from $2k of loan paydown is wiped out by about $7k of value loss. Plan a longer hold.
- Sussex County population projected at +25% by 2050 — long-run rental-demand tailwind backs the buy-and-hold thesis.
Negotiation context
- Only 11 days on market — expect competitive offers; lowballing is unlikely to land.
- 2 sale attempts since 11y ago with the ask held roughly flat each time — persistent listings suggest the price (not the market) is what's stuck; bring a comps-based counter.
- Current owner paid $42k; list at $239k implies a 469% gain — meaningful room to come down on a strong offer.
Risks & watch-outs
- Climate carrying-cost: severe wind risk, 80% chance of damaging wind over 30y; extreme-heat days projected 7→18/yr by 2055 (HVAC capex compounding) — expect insurance premiums to compound above CPI over the hold.
Questions for the listing agent
- Is there a deadline driving the sale (1031 exchange, divorce, estate, relocation)? That informs how much negotiation room exists.
- Schools are B-rated — typically a magnet for longer-tenancy family renters. What's the average tenant stay here, and is there a school-zone premium baked into asking?
- The area grade is low — what's the realistic commute time and amenity access for the typical tenant pool here? Any planned neighborhood developments (good or bad) we should know about?
- What's the average days-on-market for RENTAL listings here right now (not sales)? A rising rental-DOM trend means longer vacancies and softer asking-rent achievability than the comps imply.
- What's the recent tenant-quality profile in this submarket — average credit score on applications, eviction rate, late-payment / NSF rate, and stable-employment percentage? A property-management company in the area should have these aggregated.
- How much new for-sale + rental construction is in the pipeline within 1–3 miles? Heavy new supply typically softens prices + rents 12–24 months out; constrained supply supports both.
Investment metrics
- 1% rule
- 1.05% ✓
- Cap rate
- 7.96%
- Cash-on-cash
- 5.95%
- DSCR
- 1.26
- GRM
- 7.9
CMA / ARV
- ARV (on-the-fly)
- $183,600
- Comps found
- 12
Show comp detail 12 sales within ~0.75 mi
| Address | Dist | Beds/Ba | Sqft | Sold | Price | $/sf | Match |
|---|---|---|---|---|---|---|---|
| 35653 Highlands Way #182 | 0.02mi | 3/2.0 | 1,108 (-8%) | 0mo | $115,000 | $104 | 86 |
| 35616 Elk Camp Rd | 0.15mi | 2/2.0 (-1) | 1,236 (+3%) | 0mo | $85,000 | $69 | 82 |
| 13 Wagon Wheel Ln #14374 | 0.47mi | 3/2.0 | 1,200 (0%) | 0mo | $125,000 | $104 | 78 |
| 35715 Elk Camp Rd #77 | 0.22mi | 2/2.0 (-1) | 1,164 (-3%) | 2mo | $125,000 | $107 | 78 |
| 43 Candlelight Ln #11675 | 0.33mi | 3/2.0 | 1,200 (0%) | 9mo | $205,000 | $171 | 77 |
| 21 Powder Horn Ln | 0.36mi | 3/1.5 | 1,180 (-2%) | 10mo | $180,000 | $153 | 70 |
| 35639 Highland Way #184 | 0.02mi | 2/2.0 (-1) | 1,348 (+12%) | 4mo | $169,500 | $126 | 70 |
| 18699 Snowmass Run #27 | 0.06mi | 2/2.0 (-1) | 1,300 (+8%) | 11mo | $200,000 | $154 | 70 |
| 28 Wagon Wheel Ln | 0.41mi | 2/2.0 (-1) | 1,152 (-4%) | 3mo | $169,900 | $147 | 67 |
| 48 Spinning Wheel Ln #10697 | 0.30mi | 2/2.0 (-1) | 1,255 (+5%) | 9mo | $213,000 | $170 | 65 |
| 113 Martin Ln | 0.38mi | 4/1.0 (+1) | 1,304 (+9%) | 8mo | $357,000 | $274 | 52 |
| 22 Vassar Dr | 0.67mi | 3/2.0 | 1,376 (+15%) | 2mo | $465,000 | $338 | 43 |
Match score weights: distance 35% · size 25% · config 20% · recency 20%. Top-matched comps best support the ARV.
Projected returns pro-forma
-3.0% appreciation · 3.0% rent growth · sell at horizon
- IRR
- -7.1%
- Equity multiple
- 0.74×
- Total profit
- $-17,563
- Equity at exit
- $35,636
- IRR
- 2.5%
- Equity multiple
- 1.18×
- Total profit
- $12,065
- Equity at exit
- $20,664
Cash invested: $66,920 (down + closing). Projections, not guarantees.
Landlord ↔ Tenant lean methodology
- Overall (STATE)
- 70 Landlord-Friendly
- State Delaware
- 70 Landlord-Friendly · D+7
- County
- — inherits STATE
- City
- — inherits STATE
ZIP-level market 19971
- Active inventory
- 331
- Price-to-rent
- 7.9×
Monthly cashflow live
- Estimated rent
- $2,511 high interval (Pro) →
- Mortgage (P&I)
- −$1,253
- Tax est. 1.5%
- −$299 /mo · $3,585/yr
- Insurance
- −$100
- HOA
- −$0
- Vacancy / Maint / Mgmt
- −$527
- Net cashflow
- $332
Break-even live
UW: 25.0% down · 7.5% · 30yr · 1.5% tax · 5.0% vac · 8.0% maint · 8.0% mgmt
Financing live
Cash to close
- Down payment
- $59,750
- Closing costs
- $7,170
- Reserves months
- —
- Total cash needed
- —
Loan-product check · same deal, 3 products live
Conventional
25% down · 7.5% · 30yr
- Down + closing
- —
- Monthly P&I
- —
- Monthly cashflow
- —
- DSCR
- —
- Eligible?
- —
Personal DTI + credit; lowest rate.
DSCR
20% down · 8.5% · 30yr
- Down + closing
- —
- Monthly P&I
- —
- Monthly cashflow
- —
- DSCR
- —
- Eligible?
- —
No personal income docs; deal must DSCR.
Hard money
10% down · 12.0% · 12mo
- Down + closing
- —
- Monthly P&I
- —
- Monthly cashflow
- —
- DSCR
- —
- Eligible?
- —
Short-term bridge; refi at stabilization.
Rent comps 7 comps
| Address | Beds | Baths | Sqft | Rent | $/sqft | DOM | Units | Dist |
|---|---|---|---|---|---|---|---|---|
| 300 Pebble Dr #318 Rehoboth Beach, DE | 2.0 | 2.0 | 940 | $1,800 | $1.91 | 21d | 1 | 0.31mi |
| 35948 Haven Dr #201 Rehoboth Beach, DE | 2.0 | 2.0 | 858 | $1,800 | $2.10 | 21d | 1 | 0.39mi |
| 32015 Azure Ave Rehoboth Beach, DE | 1.0–3.0 | 1.0–2.0 | 1054 | $2,375 | $2.25 | 43d | 1 | 0.45mi |
| 15 Colgate Dr Rehoboth Beach, DE | 3.0 | 2.0 | 1120 | $2,275 | $2.03 | 21d | 1 | 0.67mi |
| 16 Colgate Dr Rehoboth Beach, DE | 2.0 | 2.0 | 1192 | $2,400 | $2.01 | 13d | 1 | 0.69mi |
| 107 Strawberry Way Rehoboth Beach, DE | 3.0 | 2.0 | 1025 | $2,750 | $2.68 | 43d | 1 | 0.84mi |
| 17829 Callaway Dr #37 Lewes, DE | 3.0 | 2.0 | 1000 | $2,000 | $2.00 | 43d | 1 | 1.35mi |
Listing history 10 events
-
2026-06-18days on market $239,000 Active 11 DOM
-
2026-06-17days on market $239,000 Active 10 DOM
-
2026-06-16days on market $239,000 Active 9 DOM
-
2026-06-15days on market $239,000 Active 8 DOM
-
2026-06-14days on market $239,000 Active 6 DOM
-
2026-06-13days on market $239,000 Active 5 DOM
-
2026-06-10days on market $239,000 Active 3 DOM
-
2026-06-09days on market $239,000 Active 2 DOM
-
2026-06-07remarks 675-char remark
-
2026-06-07$239,000 Active 1 DOM
ⓘ Source: listings_history table (triggers on properties + properties_extension) + one-shot
backfill from property_details.listing_events for pre-trigger history.
Climate risk First Street
- Flood 1/10 Low FEMA zone X (unshaded) · 0% chance over 30 yrs
- Wildfire 1/10 Low
- Heat 8/10 Severe 7 d/yr ≥101°F today · 18 d/yr by 30 yrs out
- Wind 8/10 Severe 80% chance of damaging wind over 30 yrs
- Air quality 2/10 Low 1 unhealthy d/yr today · 1 by 30 yrs out
Nearby sold comps map
Loading sold comps map…
Walkable amenities ~0.75 mi
Loading nearby amenities…
Taxation est. · year 1
- Rental income
- $30,127
- − Mortgage interest
- −$13,388
- − Property taxes
- −$3,585
- − Insurance
- −$1,195
- − Repairs & maintenance
- −$2,410
- − Management
- −$2,410
- − Depreciation
- −$6,953
- Taxable income
- $187
- Est. tax owed @ 24.0%
- −$45
- After-tax cash flow
- $3,936/yr
For passive investors: Depreciation is non-cash, so a rental often shows a tax loss while cash-flowing — sheltering income. Rental losses are passive: they offset passive income freely, and up to $25,000/yr can offset ordinary (W-2) income if you actively participate and your MAGI is under $100k (phasing out to $0 by $150k); unused losses carry forward. On sale, claimed depreciation is recaptured at up to 25%, and gains may owe capital-gains tax (a 1031 exchange can defer both). Figures are a year-1 estimate at your 24.0% rate — not tax advice; consult a CPA.
Schools (NCES district)
- District
- Cape Henlopen School District
- NCES district ID
- 1000170
- Math proficiency
- 42% ▼ -14.00%
- Reading proficiency
- 55% ▼ -10.00%
- Median HH income
- $60,196
- Composite
- 42.47/100
- National rank
- #3214
- State rank
- #5 of 26 in DE
Livability — Lewes
- Score
- 67/100
- State rank
- #40
- US rank
- #11077
Category grades
Schools grade is shown separately in the Schools card above.
Census & demographics
- County
- Sussex County · 82,708 people
- City population
- 31,938
- Metro
- Salisbury, MD-DE
- Population (ZIP)
- 14,886
- Household income
- $102,146
- Rent vs Own
- Severe rent burden
- 317.0
Population outlook (Sussex County) Hauer SSP2
- Today (2025)
- 248,853 people
- By 2030
- 264,464 · +6.3%
- By 2040
- 290,980 · +16.9%
- By 2050
- 311,259 · +25.1%
- By 2075
- 352,488 · +41.6%
- By 2100
- 367,406 · +47.6%
Race, ethnicity, and origin ACS 2023
- Neighborhood character
- Predominantly White (88%)
- Race & ethnicity
- White 88% Black 4% Two or more races 4% Hispanic / Latino 3% Asian 2%
- Common ancestry
- Romanian 5% Slovak 3% Italian 3%
- Foreign-born
- 6% · Canada, China
- Languages at home
- 95% English-only · Spanish 2% Russian/Polish/Slavic 1% French/Haitian/Cajun 1%
Political lean MEDSL · Sussex
- 2024 margin
- R (+11.0) · D 43.9% · R 54.9% · Other 1.2%
- 2008→2024 swing
- -2.4pp toward R · 2008: -8.6pp · 2024: -11.0pp
- All cycles
- 2024: R+11.0 2020: R+11.2 2016: R+22.0 2012: R+13.0 2008: R+8.6
Not yet ingested
- Civics
- —
Market trends
- HPI YoY
- ▼ -220.39%
- Current HPI
- 353.3977
- Rent YoY
- —
- Metro
- Salisbury, MD-DE
- State GDP YoY
- —
- F500 in state
- 0
Price history
+420.7% since first listed4 events — show timeline
- 2026-06-07 Listed $239,000 BRIGHT MLS
- 2016-08-27 Sold (MLS) $42,000 BRIGHT MLS
- 2016-08-03 Listing Removed — BRIGHT MLS
- 2015-09-23 Listed $45,900 BRIGHT MLS
Cash-flow waterfall
monthlySold comps — $/sqft
last 12 mo · ≤1 miLoading sold comps…